The common mycorrhizal network is to facilitate the underground interchange of materials and information between plants. What the common mycorrhizal network does for plants and the environment yet unknown. The mixed strains (Sm) of Pisolithus orientalis (Po), Scleroderma citrinum (Sc), Suillus luteus (Sl) and non-inoculation (CK) were taken. Varying nitrogen concentrations by used 15N isotope labeling to investigate the impact of mycorrhizal network of Pinus massoniana Lamb. The recipient seedlings could contract mycelia from the donor, the higher of infection rate, the greater of growth and ability to absorb nutrients. P. massoniana seedlings could benefit from both inoculation and nitrogen treatment for growth and nutrient uptake. Under the same nitrogen treatment, donor/recipient seedlings of Sm exhibited a greater uptake of nitrogen compared to those of CK. Under Sm treatment, the 15N absorption by donor/recipient seedlings was the highest at N6 and N4, the 15N utilization and transfer rates were the highest at N4, and the 15N allocation rates were highest in roots at N2 and N6, in leaves at N4 (45.21% and 50.59%, respectively). The 15N transfer rate had a major impact on the biomass of recipient seedlings, 15N absorption, and 15N allocation. Sm-N4 treatment performed well in these areas.
Research Article
Nitrogen transfer mechanism of mycorrhizal network between Pinus massoniana Lamb. seedlings
https://doi.org/10.21203/rs.3.rs-4015336/v1
This work is licensed under a CC BY 4.0 License
Version 1
posted
You are reading this latest preprint version
Common mycorrhizal network
Pinus massoniana Lamb
Ectomycorrhiza
15N label
Nutrient
Plant roots and soil fungus combine to form the symbiont known as ectomycorrhiza (ECM), which has a unique morphological structure and set of functions (Strullu et al. 2018). Due to their loose host specificity, the majority of ectomycorrhizal fungi are able to create symbiotic relationships with nearby plants by extrinsic mycelium, resulting in the formation of a massive mycelium network known as the common mycorrhizal network (CMN) connecting the roots (Bever et al. 2010; Ralf, 2019). The transfer of inorganic nutrients and organic photosynthetic products between plants is made possible by the common mycorrhizal network, which also serves as an essential conduit for information and material exchange between plants below ground (Song et al. 2019). Furthermore, the network plays a crucial role in controlling inter-plant competition and the redistribution of nutrient resources (Wipf et al. 2019; Wang, 2020).
Studies on fungi that enhance plant nutrition uptake and utilization have advanced significantly in the last few years (Musa et al. 2020; Cao et al. 2021; Wu et al. 2022; Lin et al. 2023); however, these studies have mostly focused on endomycorrhizal fungi (Liu et al. 2020; Chandrasekaran et al. 2020; Gao et al. 2021; Guiwei et al. 2023). Fewer studies have been conducted on ECM nitrogen uptake and utilization (Formenti et al. 2023). As research has advanced, more and more emphasis has been drawn to the function of the common mycorrhizal network in the transmission of chemicals and information (Lian et al. 2019; Whiteside et al. 2019). According to reports, ectomycorrhizal fungi (AMF) infiltrate mycelium networks made up of the roots of plants belonging to the same or different species, hence transferring water, minerals, and allelopathy across plants (Song et al. 2019; Awaydul et al. 2019). AMF delivered 94% of the 15N and 33P through the mycelial network system between sorghum and flax, but only absorbed a little quantity of C from flax (Walder et al. 2012).
According to Zhou (2001), P. massoniana is the most extensively dispersed tree species in China and is a common ectomycorrhizal species (Wang and Yang, 2022). One of the key elements preventing P. massoniana from growing and increasing forest production in southern China is the high acidity and deficiency in phosphate and nitrogen in soil. Thus, mycorrhizal symbiosis of P. massoniana is crucial for enhancing plant nitrogen absorption and preserving the nitrogen cycle in the environment. Prior research has revealed that P. massoniana seedlings can create a shared mycorrhizal network that allows for nutrient transfer and redistribution among seedlings (Tu et al. 2022). However, the exact mechanism behind this nutrient transfer remains unclear. Therefore, using a four-cell grid incubator and the results of earlier research, a shared mycorrhizal network was formed between P. massoniana seedlings. 15N labeling was then utilized to examine changes in the growth, nutrient absorption, and transport of donor and recipient seedlings under various N dosages. A theoretical foundation for encouraging the full use of N and the function of the common mycorrhizal network in nutrient circulation of P. massoniana forest area was provided by the discovery of the N transfer mechanism of the mycorrhizal network implicated in P. massoniana.
2.1 Experimental strain
Pisolithus orientalis (Po), Scleroderma citrinum (Sc), and Suillus luteus (Sl) made up the mixed strains (SM), which were provided by Professor Ding from the Guizhou Forest Resources and Environment Research Center, Guizhou University (Guiyang, China). Pachlewski medium was used for strain culture, in accordance with Tu et al.'s (2022) methodology. The growth status of three tested strains on flat solid medium in Fig. 1
2.2 Experimental tree strain
The seeds, designated Duyun-126 and weighing 11.2786 g per thousand grains, were harvested from the P. massoniana improved seed base in Duyun, Guizhou Province, China (E107°31', N26°15'). The seedlings were disinfected as describe by Tu (2022).
2.3 Experimental setup
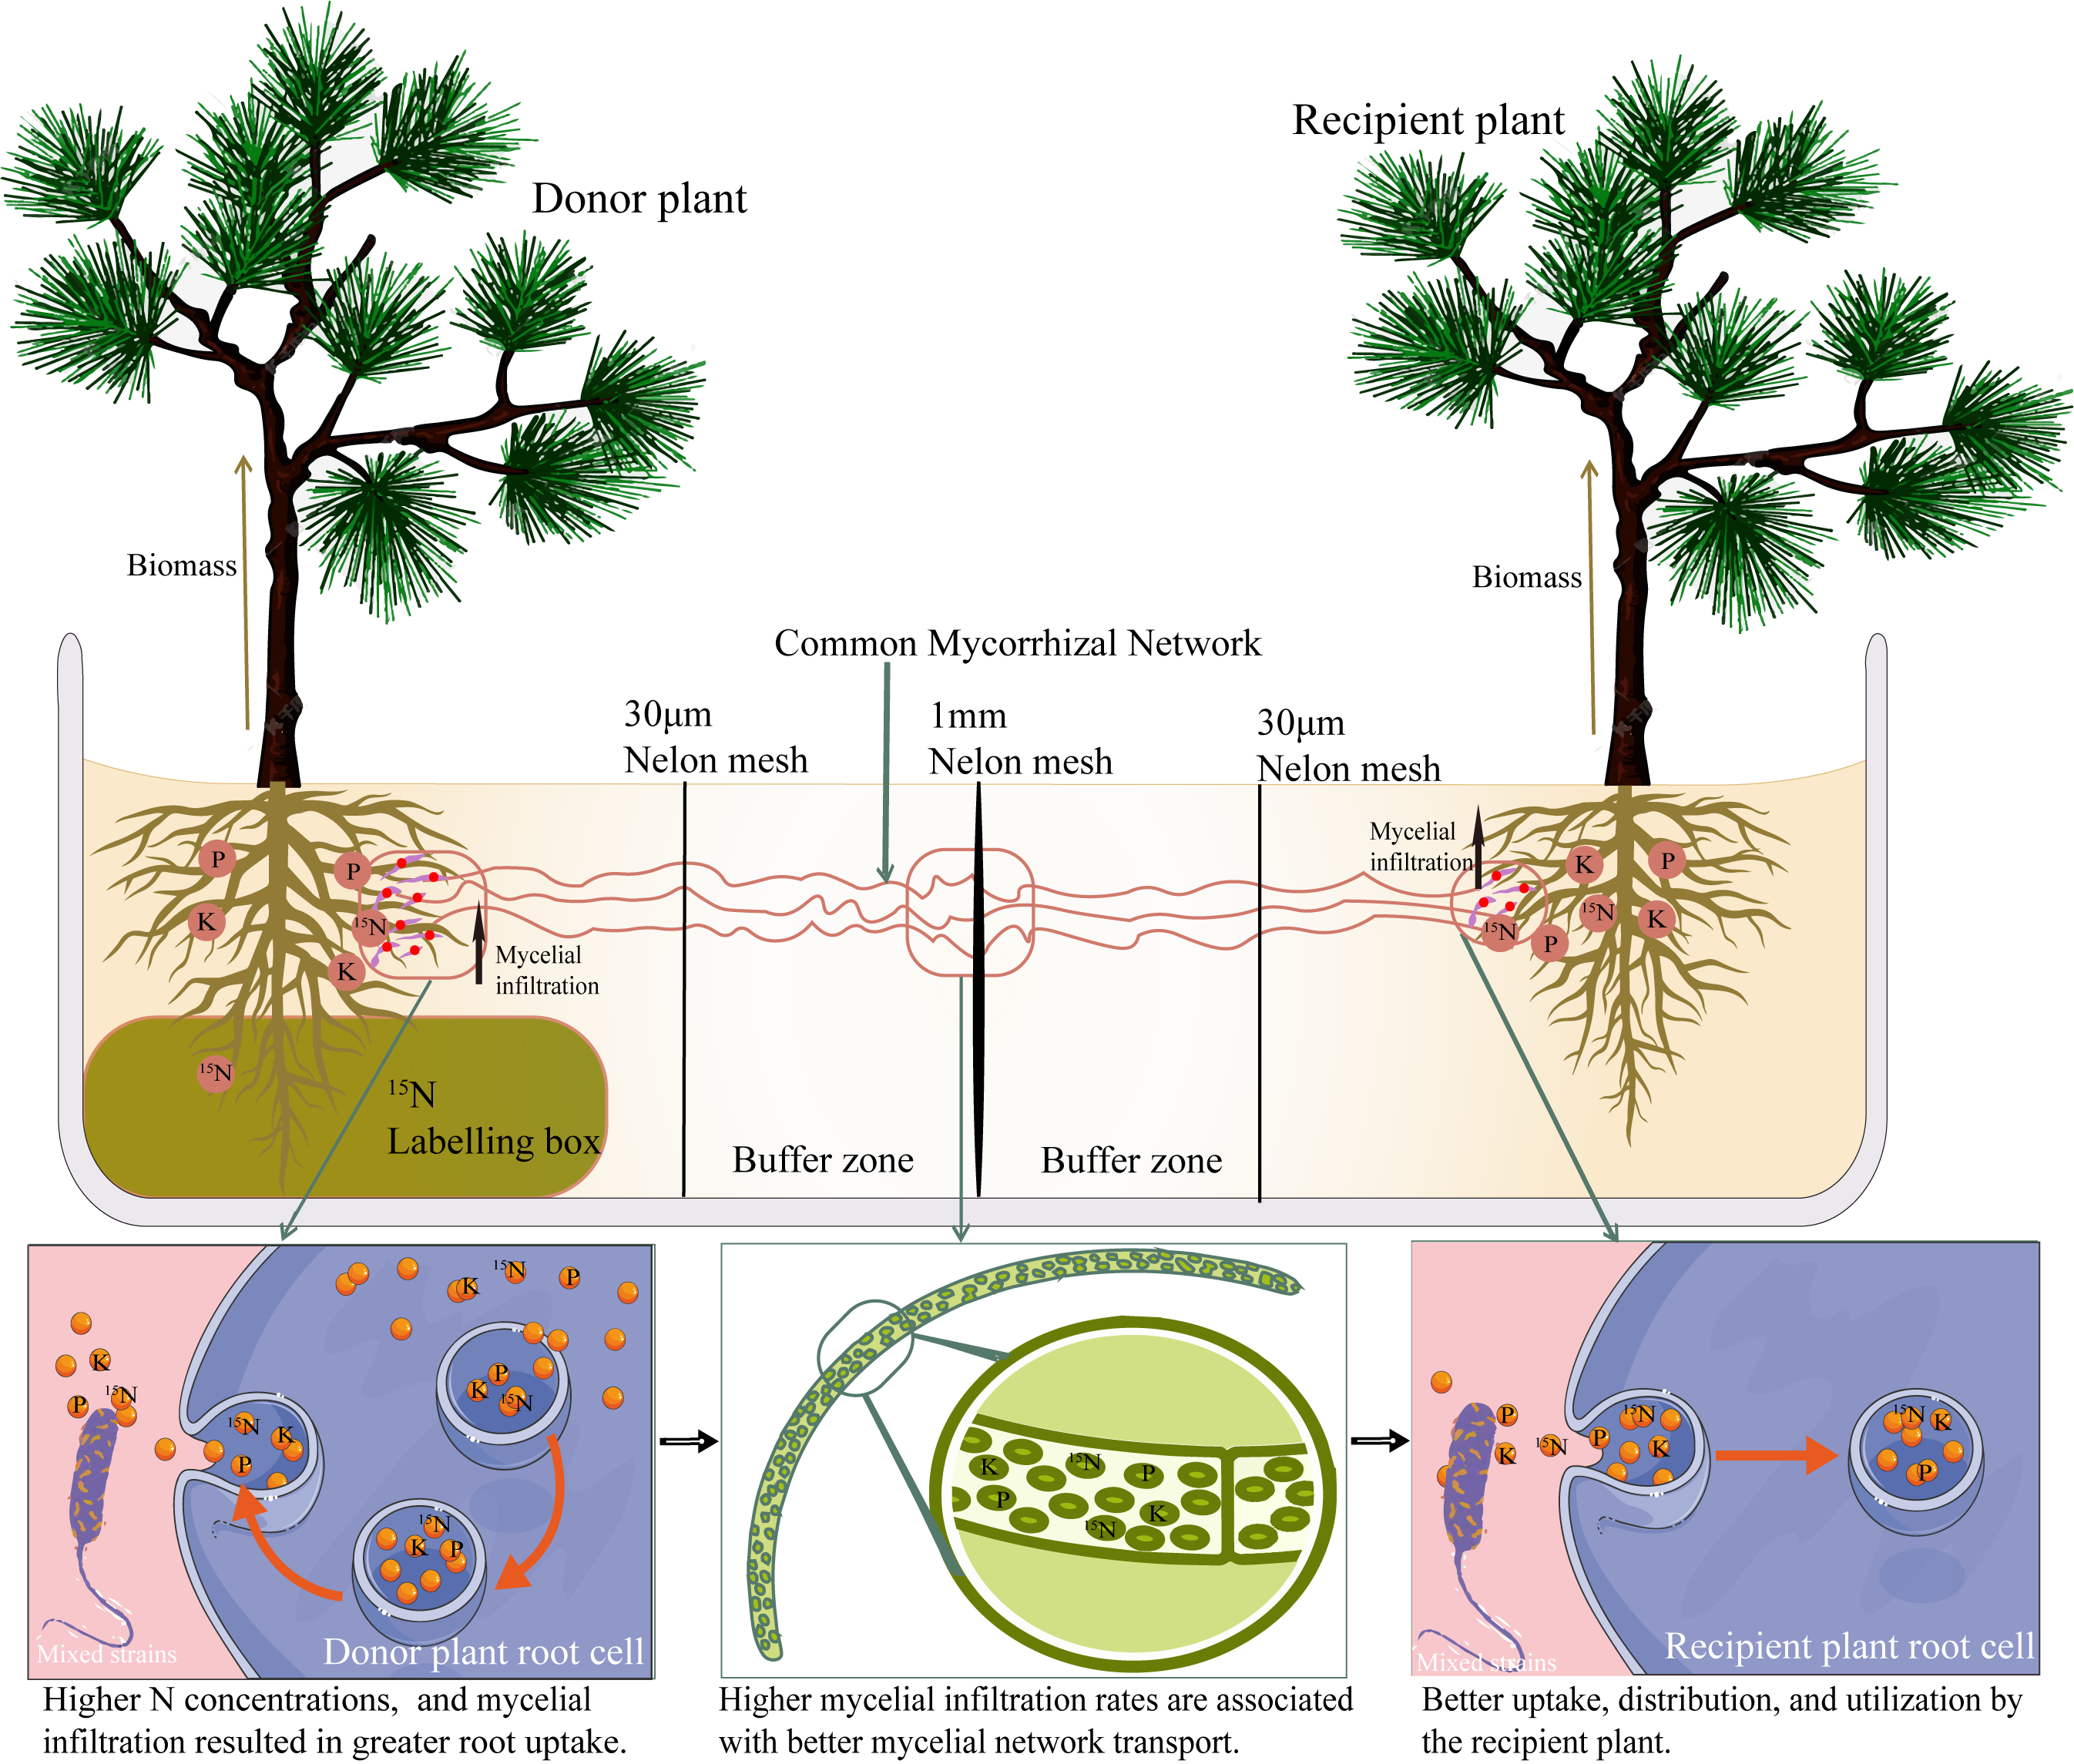
Using a plastic box, a four-cell grid seedling apparatus was constructed by hand (chamber A-D) as described by Tu (2022). The longitudinal section of the seedling equipment is shown in Fig. 2. Each seedling box included a donor chamber (A), clay isolation layer (B), mycelium chamber (C), recipient chamber (D), and marker chamber (E). P. massoniana seedlings were planted in A and D, and the mycelia in A could pass through the nylon net into B and C to reach D and form a mycelial network.
2.4 Medium
The soil was extracted from the P. massoniana forest, dried, and screened (1 cm × 1 cm). It was then combined with vermiculite and perlite in a 9:2:1 volume ratio. Every matrix was continually sterilized in an autoclave for 1 hour at 121°C and 0.14 MPa of pressure, and then packed into A, C, and D of the four-cell grid boxes at concentrations of 1.20, 0.60, and 1.20 kg/pot, respectively. In addition, clay sterilized under the same conditions was also loaded into B at 0.45 kg per basin (Tu et al. 2022). The physicochemical properties of the soil are shown in Table 1.
| pH | Total nitrogen (g/kg) | Alkaline nitrogen (mg/kg) | Total phosphorus (g/kg) | Available phosphorus (mg/kg) | Total potassium (g/kg) | Available potassium (mg/kg) | Organic matter (g/kg) |
|---|---|---|---|---|---|---|---|
| 4.60 | 0.14 | 87.50 | 0.32 | 28.78 | 10.18 | 134.36 | 13.94 |
This study used a two-factor experimental design, with component A being the inoculation treatment, which consisted of both mixed inoculation (Sm) and no inoculation (CK). Factor B involved the application of nitrogen fertilizer, with four amounts established: 0 g/L (nitrogen), 2 g/L (nitrogen 2), 4 g/L (nitrogen 4), and 6 g/L (nitrogen 6). Only the P. massoniana plants in Chamber A received the inoculation; transplanting and inoculation were done concurrently. A total of eight treatments were repeated eight times, with two seedlings in each of Chambers A and D. The inoculation method accordance with Tu et al.'s (2022) methodology. The isotope solution was carefully kept away from soil and seedlings that did not require isotopically labeling throughout the experiment.
4.1 Determination of seedling height, ground diameter, and biomass
Following three months of care, the P. massoniana seedlings were taken out and cleaned of dirt, perlite, vermiculite, and other impurities from the roots. The roots, stems, and leaves were then separated and placed in bags that could seal themselves. Every treatment was carried out three times. The gathered seedlings were weighed after 30 minutes at 105°C in the oven to determine their dry weights. Root biomass/above-ground biomass equaled the root-top ratio.
4.2 Mycorrhizal infestation rate, mycorrhizal dependence, and mycelial contribution rate
According to Zhang (2016), mycorrhizal dependency (%) was calculated as follows: dry weight with inoculation treatment * 100% / (dry weight with inoculation treatment - dry weight without inoculation treatment). According to Cai (2007), the mycelial contribution rate (%) was (N uptake by mycorrhizal plants-N uptake by non-mycorrhizal plants) / N uptake by mycorrhizal plants *100%.
4.3 Seedling nutrient determination
Using a mixed ball mill (Retsch GmbH MM400, Germany) to grind the dry P. massoniana samples, the nutrients in the plant were identified. By using the sodium salicylate and sulfuric acid boiling methods, total nitrogen was ascertained. The ClerverChe automatic intermittent chemical analyzer (DeChem-Tech China Technical Service Center, Shenzhen Langcheng Technology Co., LTD. Chemical Analysis Technology Research and Development Center) was used to determine the total phosphorus using the sulfuric acid deboiling-molybdenum antimony method. Flame photometry using the FP series flame photometer FP6410 (Shanghai Jingke Industrial Co.Ltd.) was used to estimate the total potassium (Bao. 2015).
4.4 15N abundance determination
The experiment used 15N, and the abundance of 15N was calculated as follows:

The Elementar-Sercon Integra2 mass spectrometer (Element, Germam; Sercon Integra2, UK) was used to measure the 15N abundance of plants.
4.5 N utilization efficiency, transfer rate, and allocation rate in P. massoniana seedlings
The computation was predicated using the approach of Zhao (2006).
(1) Total N content in each organ = dry matter in each organ * N uptake in each organ
(2) Above-ground N uptake plus root N uptake equaled total N uptake.
The percentage of 15N absorbed by each organ in the N uptake (Ndff) was calculated by dividing the 15N abundance in ammonium sulfate (15N natural abundance) by the 15N abundance in plants (15N natural abundance [0.366%]).
(4) 15N absorption of every organ = N absorption of every organ × The percentage of 15N in the total N of every organ
(5) In plants, 15N uptake was equal to both above-ground and root 15N uptake.
(6) 15N utilization efficiency (%) =15N uptake of plant /total 15N application *100%
(7) 15N transfer rate (%) =15N absorbed by the recipient plant/ Total 15N absorbed by the plant *100%
(8) N content in each organ = 15N absorbed in each organ / Total N absorbed of plants *100%
4.6 Data analysis
SPSS 22.0 and Excel 2021 were utilized for the statistical analysis. The identical inoculation treatment with varying nitrogen administration levels was subjected to a one-way ANOVA. The Duncan technique was used to evaluate for differences between the treatments (P < 0.05). Plotting OriginPro 2021 was used to display the results, which were expressed as mean ± standard deviation (n = 3).
5.1 Root infection rate of donor/recipient of P. massoniana seedlings under different nitrogen levels
Without receiving CK inoculation, the donor/recipient seedlings had a 0% mycorrhizal infestation rate (Table 2). Donor/recipient with N had a considerably higher rate of mycorrhizal infection than those without N (P < 0.05). The application of N6 nitrogen, which was 47.73% higher than N0, resulted in the greatest mycorrhizal infestation of donor seedlings; N4 nitrogen, which was 65.91% higher than N0, resulted in the greatest mycorrhizal infestation of recipient seedlings.
Table 2
|
CK |
Sm |
|||
|---|---|---|---|---|
|
Treatment |
Mycorrhizal infection of donor plant (%) |
Mycorrhizal infection of receiver plant (%) |
Mycorrhizal infection of donor plant (%) |
Mycorrhizal infection of receiver plant (%) |
|
N0 |
0 |
0 |
31.61 ± 3.27 c |
26.17 ± 0.96 c |
|
N2 |
0 |
0 |
38.42 ± 0.81 b |
31.10 ± 1.83 b |
|
N4 |
0 |
0 |
44.48 ± 1.16 a |
43.42 ± 1.46 a |
|
N6 |
0 |
0 |
46.69 ± 1.23 a |
41.33 ± 2.61 a |
| Note: N0、N2、N4、N6 were 0、2、4、6 g/L, respectively, nitrogen levels treatment; CK was not inoculated, Sm was inoculated; The data were mean ± standard deviation (n = 3); Different lowercase letters indicate significant difference among different nitrogen concentrations of the same strain (P < 0.05). The same below. | ||||
5.2 Effect of common mycorrhizal network on biomass of P. massoniana seedlings under different nitrogen application levels
The biomass of the roots, stems, and leaves in the donor seedlings (Table 3) under CK treatment increased initially before decreasing as N application increased. This trend peaked at N4, where it was 1.42-, 3.02-, and 2.62-fold higher than that of N0, respectively (P < 0.05). There was no significant difference between N2 and N0 (P > 0.05), but the root-top ratio gradually dropped with increasing N application and was considerably lower (P < 0.05) than N0 at N4 and N6 applications. As nitrogen application increased under the Sm treatment, root biomass grew as well. It peaked with N6 nitrogen application, which was 2.62 times greater than that of N0 and significantly different from other nitrogen application rates (P < 0.05). With an increase in N application rate, the biomass of leaves and stems grew initially, then dropped, reaching a maximum value at N4 application, 2.44 and 2.60 times, respectively, that of N0 (P < 0.05). With an increase in the nitrogen application rate, the root-top ratio of seedlings inoculated with Sm changed from rising to falling to rising; the minimum at N4 was significantly different from that at N0 (P < 0.05), and the maximum at N6 was the highest (P < 0.05), but there was no significantly different from that at N0 (P > 0.05). With an increase in nitrogen application rate, the mycorrhizal dependency likewise displayed a rise-fall-rise pattern, with N6 application yielding the maximum value. However, there was no statistically significant difference observed between the nitrogen application rates (P > 0.05). Except for the root biomass treated with N0, the biomass of the Sm-inoculated stems, leaves, and roots was greater than that of CK at the same nitrogen administration rate.
|
Treatment |
N level (g/L) |
Biomass (g) |
Root shoot ratio |
RMD (%) |
||
|---|---|---|---|---|---|---|
|
Root |
Stem |
Leaf |
||||
|
CK |
N0 |
0.15 ± 0.01 Ab |
0.06 ± 0.02 Ab |
0.14 ± 0.05 Ab |
0.80 ± 0.26 Aa |
- |
|
N2 |
0.15 ± 0.02 Ab |
0.07 ± 0.01 Bb |
0.14 ± 0.01 Bb |
0.72 ± 0.12 Aa |
- |
|
|
N4 |
0.21 ± 0.03 Aa |
0.19 ± 0.04 Ba |
0.37 ± 0.02 Ba |
0.38 ± 0.03 Ab |
- |
|
|
N6 |
0.13 ± 0.00 Bb |
0.11 ± 0.05 Ab |
0.29 ± 0.08 Ba |
0.37 ± 0.13 Ab |
- |
|
|
Sm |
N0 |
0.15 ± 0.05 Ac |
0.12 ± 0.02 Ac |
0.31 ± 0.12 Ac |
0.34 ± 0.02 Ba |
32.36 ± 29.25 a |
|
N2 |
0.22 ± 0.02 Ab |
0.16 ± 0.02 Ac |
0.49 ± 0.05 Ab |
0.35 ± 0.05 Aa |
57.80 ± 3.24 a |
|
|
N4 |
0.25 ± 0.03 Ab |
0.30 ± 0.02 Aa |
0.80 ± 0.09 Aa |
0.23 ± 0.05 Bb |
41.99 ± 8.25 a |
|
|
N6 |
0.39 ± 0.00 Aa |
0.24 ± 0.04 Ab |
0.76 ± 0.06 Aa |
0.39 ± 0.04 Aa |
61.86 ± 10.26 a |
|
|
Treatment |
N level (g/L) |
Biomass (g) |
Root shoot ratio |
RMD (%) |
||
|---|---|---|---|---|---|---|
|
Root |
Stem |
Leaf |
||||
|
CK |
N0 |
0.09 ± 0.01 Bb |
0.07 ± 0.01 Ac |
0.13 ± 0.02 Bc |
0.49 ± 0.03 Aab |
- |
|
N2 |
0.11 ± 0.02 Aab |
0.07 ± 0.02 Ac |
0.10 ± 0.03 Bc |
0.65 ± 0.23 Aa |
- |
|
|
N4 |
0.13 ± 0.00 Aa |
0.16 ± 0.01 Ba |
0.40 ± 0.02 Aa |
0.24 ± 0.01 Ac |
- |
|
|
N6 |
0.13 ± 0.01 Ba |
0.11 ± 0.02 Bb |
0.22 ± 0.02 Bb |
0.41 ± 0.02 Abc |
- |
|
|
Sm |
N0 |
0.21 ± 0.01 Aab |
0.13 ± 0.03 Ab |
0.31 ± 0.04 Ab |
0.47 ± 0.05 Aa |
55.31 ± 9.10 a |
|
N2 |
0.16 ± 0.02 Ab |
0.15 ± 0.02 Ab |
0.27 ± 0.04 Ab |
0.39 ± 0.06 Aa |
50.91 ± 6.90 a |
|
|
N4 |
0.27 ± 0.05 Aa |
0.31 ± 0.00 Aa |
0.67 ± 0.27 Aa |
0.29 ± 0.13 Aa |
42.54 ± 10.81 a |
|
|
N6 |
0.23 ± 0.03 Aab |
0.17 ± 0.04 Ab |
0.44 ± 0.08 Aab |
0.38 ± 0.10 Aa |
44.45 ± 1.57 a |
|
When the nitrogen application rate was increased under the CK treatment, the biomass of the roots increased while the biomass of the stems first increased, then decreased as the nitrogen application rate increased, reaching its maximum value at N4 application, which was 143.64% higher than that of N0 with a significant difference (table.4, P < 0.05). The biomass of the root and leaf under the Sm treatment declined as the rate of nitrogen delivery increased, peaking at N4 application, which was 111.94% and 26.81% higher than that of N0, respectively. When nitrogen application increased, stem biomass first increased, then declined, and finally achieved its maximum value at N4 application, which was 137.24% more than that of N0 with a significant difference (P < 0.05). Sm inoculation could raise the dry matter weight of the recipient seedlings' roots, stems, and leaves at the same nitrogen administration rate as CK, but the root-top ratio did not differ significantly (P > 0.05).
5.3 Effects of common mycorrhizal network on roots, stems, and leaves nutrients of P. massoniana seedlings under different nitrogen application levels
5.3.1 Total nitrogen in roots, stems, and leaves of donor/recipient of P. massoniana seedlings
The total nitrogen content of donor and recipient seedlings' roots under CK treatment peaked at N4 application (Fig. 3A, B), which was 32.29% (P < 0.05) and 11.10% (P > 0.05) greater than that of N0, respectively. The total nitrogen in the receiver seedlings' roots reached its maximum at N4 application, 11.26% higher than that of N0 (P > 0.05), whereas the total nitrogen in the donor seedlings' roots was lower than that of N0 (P > 0.05) under the Sm treatment. The total nitrogen of recipient seedlings was higher than that of N0 (Fig. 3D) only at N2 application, and the total nitrogen of donor/recipient seedlings reached the minimal value at N4 application. In stems, the total nitrogen of donor seedlings treated with CK and Sm was lower than that of N0 (Fig. 3C). The total nitrogen in the leaves of donor seedlings in CK and Sm increased initially, but as the nitrogen application rate grew, it dropped (Fig. 3E). The maximal nitrogen application rate in the CK treatment was 103.42% higher than in the N0 treatment (P < 0.05). Total nitrogen was at its greatest under the Sm treatment at N2 application, 5.97% greater than at N0 (P > 0.05). When the nitrogen application rate was increased, the total nitrogen in the leaves of seedlings treated with CK and Sm changed in a fall-rise-fall pattern (Fig. 3F). At the N4 application rate, the total nitrogen reached its maximum value, which was 17.05% and 3.54% greater than that of N0, respectively (P < 0.05). While the total nitrogen of stems was not significantly different from CK (P > 0.05), and the total nitrogen of leaves was significantly higher at N0 and N2 application rates than CK (P < 0.05), Sm inoculation could increase the total nitrogen of donor/recipient seedlings at the same nitrogen application rate and with a significant difference at N2 application (P < 0.05).
5.3.2 Total phosphorus in roots, stems, and leaves of donor/recipient of P. massoniana seedlings
Under CK treatment, donor/recipient seedlings' total phosphorus content changed in a fall-rise-fall manner as the rate of nitrogen application increased (Fig. 4A, B). It peaked at the N4 application, when it was 60.27% and 131.45% higher than N0, respectively (P < 0.05). Total phosphorus in donor seedling stems grew initially, then dropped as nitrogen application increased. It reached its maximum value at N4 application, which was 171.72% greater than N0 application (Fig. 4C, D, P < 0.05). Total phosphorus in recipient seedling stems first declined, then grew as nitrogen treatment rate increased (Fig. 4D). Total phosphorus reached its maximum value at N6 application, 9.10% more than that of N0 (P < 0.05). In the donor/recipient seedlings, overall total phosphorus increased initially, then decreased as the nitrogen application rate increased (Fig. 4E, F). Total phosphorus reached its maximum value under N4 application, which was 284.68% and 269.51% higher than that of N0, respectively (P < 0.05).
Under Sm treatment, the total phosphorus in the recipient's roots and stems and the donor seedling's roots and stems changed fall-rise-fall as the nitrogen application rate increased (Fig. 4), peaking at the N4 application. By 0.36% (P > 0.05), 41.42% (P < 0.05), 39.99% (P < 0.05), 32.35% (P < 0.05), and 49.31% (P < 0.05), it was more than N0, in that order. When the rate of nitrogen treatment was raised, the total phosphorus in the recipient seedlings' leaves declined initially, increased, and reached its maximum value at the N6 application (Fig. 4F), which was 29.91% higher than that of N0 (P < 0.05). Overall, at the N4 treatment, the seedlings inoculated with Sm exhibited the greatest effect on total phosphorus uptake and use.
5.3.3 Total potassium of donor/recipient of P. massoniana seedlings
The total potassium of donor seedlings under CK treatment changed in a fall-rise-fall pattern as the rate of nitrogen application increased. It peaked at the application of N4, which was 11.55% greater than that of N0 (Fig. 5A, B, P < 0.05). Total potassium in the recipient seedlings' roots first rose, then fell as the amount of nitrogen applied increased. It reached its maximum value when N4 was applied, 18.53% more than N0 (Fig. 5C, D). With an increase in the nitrogen application rate, the total potassium of the donor and recipient seedlings changed overall in a fall-rise-fall pattern. It peaked at the N4 application, when it was 36.06% and 49.76% greater than the N0 application, respectively (Fig. 5E, F, P < 0.05).
Total potassium in the donor seedlings' roots, stems, and leaves increased initially under the Sm treatment, then decreased as the rate of nitrogen application increased (Fig. 5). The highest value was reached at the N4 application, which was 9.78% (P < 0.05), 9.02% (P > 0.05), and 28.46% (P < 0.05) higher than that of N0, among other values. When the rate of nitrogen application was increased, the total potassium in the recipient seedlings' roots and leaves changed in a fall-rise-fall pattern (Fig. 5B, F). In contrast, the total potassium in the stems first increased, then decreased (Fig. 5D), and finally reached its maximum at the N4 application. In comparison to N0, the total potassium content of the roots, stems, and leaves was 10.71% (P < 0.05), 64.29% (P < 0.05), and 21.04% (P > 0.05), respectively. Sm inoculation increased the total potassium in the roots, stems, and leaves of donor seedlings when compared to CK, and this difference was significant at the N4 application (P < 0.05). However, there was no significant difference in the total potassium in the roots, stems, and leaves of recipient seedlings inoculated with Sm when compared to CK (P > 0.05).
5.4 Effects of common mycorrhizal network on nitrogen uptake and distribution in roots, stems, and leaves of P. massoniana seedlings under different nitrogen application levels
5.4.1 Nitrogen uptake and mycelial contribution rate in roots, stems, and leaves of donor/recipient of P. massoniana seedlings
Table 5, P < 0.05, indicates that during the CK treatment, the nitrogen uptake of the donor's roots and leaves increased initially, then decreased as nitrogen application increased. Meanwhile, the stems exhibited a fall-rise-fall pattern, peaking at N4 application. The nitrogen uptake of the donor's roots, stems, and leaves was 1.90 times, 1.93 times, and 5.54 times that of N0. The recipient's roots and leaves under CK treatment exhibited a fall-rise-fall pattern as nitrogen application increased, whereas the stems increased initially before decreasing and reaching a maximum at N4 application. The nitrogen uptake of the roots, stems, and leaves was 1.55-, 1.94-, and 3.73-fold greater than that of N0, respectively (P < 0.05). Under the Sm treatment, the donor's stems and leaves absorbed more nitrogen as the amount of nitrogen applied rose. At the N6 application, the maximum amount of nitrogen absorbed was 2.59 times greater than at the N0 application (P < 0.05). The uptake of nitrogen by stems and leaves had an initial increase, followed by a reduction as the nitrogen application rate was raised. The greatest value was attained at the N4 application, where the uptake of nitrogen was 2.23 and 1.93 times higher than that of N0 (P < 0.05). When the rate of nitrogen administration was increased, the recipient seedlings' roots and leaves absorbed less nitrogen, yet the stem initially expanded and later dropped. At the N4 treatment, the maximal nitrogen uptake by the roots, stems, and leaves was 1.41-fold (P > 0.05), 2.14-fold (P < 0.05), and 2.24-fold (P < 0.05), respectively. When donor/recipient seedlings were inoculated with Sm at the same nitrogen delivery rate as CK, the roots, stems, and leaves of the former could absorb more nitrogen.
|
N uptake (mg/pot ) |
|||||||
|---|---|---|---|---|---|---|---|
|
N level |
Inoculation treatment |
Donor |
Recipient |
||||
|
(g/L) |
Root |
Stem |
Leaf |
Root |
Stem |
Leaf |
|
|
N0 |
CK |
0.89 ± 0.06 Ab |
0.35 ± 0.16 Ab |
0.36 ± 0.10Ac |
0.63 ± 0.12 Bb |
0.21 ± 0.06 Ab |
0.51 ± 0.04Bc |
|
Sm |
1.33 ± 0.44 Ac |
0.61 ± 0.07 Ab |
1.85 ± 0.61Ab |
1.45 ± 0.09 Aab |
0.41 ± 0.09 Ab |
1.97 ± 0.29Ab |
|
|
N2 |
CK |
0.95 ± 0.22 Bb |
0.29 ± 0.04 Bb |
0.50 ± 0.02Bc |
0.59 ± 0.11 Ab |
0.29 ± 0.09 Aab |
0.37 ± 0.13Bc |
|
Sm |
1.86 ± 0.14 Abc |
0.65 ± 0.14 Ab |
3.16 ± 0.51 Aa |
1.18 ± 0.19 Ab |
0.48 ± 0.05 Ab |
1.61 ± 0.19Ab |
|
|
N4 |
CK |
1.69 ± 0.39 Aa |
0.68 ± 0.11 Ba |
1.98 ± 0.31 Ba |
0.98 ± 0.07 Ba |
0.40 ± 0.04 Ba |
1.90 ± 0.14 Aa |
|
Sm |
2.17 ± 0.55 Ab |
1.18 ± 0.08 Aa |
4.12 ± 0.58 Aa |
2.04 ± 0.38 Aa |
0.88 ± 0.20 Aa |
4.39 ± 2.03 Aa |
|
|
N6 |
CK |
0.98 ± 0.02 Bb |
0.54 ± 0.22 Aab |
1.27 ± 0.40 Ab |
0.89 ± 0.15 Aa |
0.36 ± 0.06 Aa |
0.98 ± 0.01 Bb |
|
Sm |
3.43 ± 0.08 Aa |
1.05 ± 0.33 Aa |
3.57 ± 0.87 Aa |
1.62 ± 0.58 Aab |
0.51 ± 0.11 Ab |
2.32 ± 0.54 Ab |
|
The mycelial contribution rate was affected differently by varied nitrogen applications during Sm treatment (Table 6). With an increase in nitrogen treatment, donor seedlings' mycelial contribution rate changed in a rise-fall-rise pattern. The mycelial contribution rate peaked at the N2 application, when it was 27.47% greater than at N0, N6 followed suit, with an 18.38% higher rate than at N0 (P > 0.05). Mycelial contribution rate was the lowest with N4 application, and N0 was 1.29 times more than N4 (P < 0.05). The mycelial contribution rate in the recipient seedlings gradually decreased as the nitrogen application increased; it peaked at N0 and decreased at N6, but there was no discernible difference in the mycelium contribution rate between the various nitrogen application levels (P > 0.05).
|
Inoculation treatment |
Donor |
Recipient |
||
|
N level (g/L) |
Mycelial contribution rate(%) |
Mycelial contribution rate(%) |
||
|
N0 |
CK |
- |
- |
|
|
Sm |
54.27 ± 17.33 ab |
64.48 ± 5.85 a |
||
|
N2 |
CK |
- |
- |
|
|
Sm |
69.17 ± 5.21 a |
61.75 ± 5.97 a |
||
|
N4 |
CK |
- |
- |
|
|
Sm |
41.94 ± 5.90 c |
53.2 ± 12.29 a |
||
|
N6 |
CK |
- |
- |
|
|
Sm |
64.24 ± 11.81 a |
49.28 ± 4.50 a |
||
5.4.2 Effects of common mycorrhizal network on 15N uptake, utilization, and transfer rate in roots, stems, and leaves of donor/recipient of P. massoniana seedlings under different nitrogen application rates
Under CK treatment, donor seedlings' roots absorbed more 15N initially, but as the rate of nitrogen application rose, it declined and finally peaked at N4 application. With an increase in nitrogen treatment rate, stem and leaf 15N uptake increased and peaked at N6 application (Table 7). Under the CK treatment, the recipient seedlings' roots and leaves absorbed more 15N initially. However, when the rate of nitrogen supply increased, this absorption reduced and peaked at the application of N4. With an increase in nitrogen application rate, stems absorbed more 15N; this uptake peaked at N6 application. Under Sm treatment, the rate at which donor seedlings' roots, stems, and leaves absorbed 15N increased as nitrogen was applied, peaking at N6 application. As the rate of nitrogen application increased, the 15N uptake of the recipient seedlings' stems changed in a rise-fall-rise pattern, peaking at the N6 application; in contrast, the 15N uptake of the leaves increased initially, then declined, peaking at the N4 application. With the exception of N2, Sm seedlings absorbed more 15N in their roots, stems, and leaves than CK seedlings did.
|
15N uptake (µg/pot) |
|||||||
|---|---|---|---|---|---|---|---|
|
N level |
Inoculation treatment |
Donor |
Recipient |
||||
|
(g/L) |
Root |
Stem |
Leaf |
Root |
Stem |
Leaf |
|
|
N0 |
CK |
0.30 ± 0.00 Ab |
0.07 ± 0.06 Ab |
0.00 ± 0.00 Bb |
0.17 ± 0.06 Bd |
0.00 ± 0.00 Ac |
0.10 ± 0.00 Ac |
|
Sm |
0.73 ± 0.25 Ad |
0.23 ± 0.06 Ab |
1.57 ± 0.50 Ab |
1.00 ± 0.10 Ab |
0.10 ± 0.00 Ac |
0.17 ± 0.06 Ab |
|
|
N2 |
CK |
175.27 ± 40.91 Aa |
23.90 ± 3.12 Ab |
43.77 ± 1.33 Bb |
2.50 ± 0.46 Aa |
0.40 ± 0.10 Bb |
0.30 ± 0.10 Ab |
|
Sm |
113.83 ± 8.57 Ac |
21.80 ± 4.78 Ab |
84.40 ± 13.62 Ab |
1.23 ± 0.15 Ab |
1.23 ± 0.15 Aa |
0.20 ± 0.00 Ab |
|
|
N4 |
CK |
230.67 ± 53.33 Aa |
56.93 ± 9.38 Ba |
159.97 ± 24.69 Ba |
1.97 ± 0.15 Bb |
0.47 ± 0.06 Bb |
0.63 ± 0.06 Aa |
|
Sm |
260.60 ± 65.52 Ab |
85.63 ± 5.78 Aa |
283.63 ± 39.86 Aa |
3.37 ± 0.60 Aa |
1.13 ± 0.23 Aa |
4.90 ± 2.25 Aa |
|
|
N6 |
CK |
221.57 ± 4.60 Ba |
71.40 ± 29.75 Aa |
161.50 ± 50.64 Aa |
0.77 ± 0.15 Bc |
0.90 ± 0.17 Aa |
0.60 ± 0.00 Ba |
|
Sm |
466.53 ± 10.35 Aa |
92.57 ± 29.05 Aa |
328.37 ± 79.92 Aa |
5.10 ± 1.80 Aa |
0.40 ± 0.10 Bb |
1.43 ± 0.31 Ab |
|
The donor/recipient seedlings under CK treatment have the highest 15N utilization rate at the N2 application. With a significant difference from other conditions (Table 8, P < 0.05), the donor/recipient seedlings' 15N utilization rate is maximum with Sm treatment at the N4 application. When nitrogen levels were N0 and N2, the 15N transfer rate of CK was higher than that of Sm; however, there was no significant difference (P < 0.05) between the 15N transfer rates of Sm and CK when nitrogen levels were N4 and N6. The nitrogen rate of N0, under the same inoculation treatment, resulted in the highest 15N transfer rate and was significantly higher than that of the other treatments (P < 0.05). However, the total 15N uptake rate was very low, and the utilization rate of 15N was 0. This could be because the natural abundance of the donor and recipient did not differ significantly from the total 15N uptake rate. N2 application under CK treatment had a greater 15N transfer rate than N4 and N6, whereas N4 application with Sm treatment had a higher 15N transfer rate than N2 and N6 (P > 0.05).
|
Inoculation treatment |
Donor |
Recipient |
||
|
N level (g/L) |
15N utilization (%) |
15N utilization (%) |
Transfer rate (%) |
|
|
N0 |
CK |
0.00 ± 0.00 c |
0.00 ± 0.00 d |
46.26 ± 4.44 Aa |
|
Sm |
0.00 ± 0.00 c |
0.00 ± 0.00 c |
34.22 ± 7.66 Aa |
|
|
N2 |
CK |
2.02 ± 0.36 Aa |
0.03 ± 0.00 Aa |
1.33 ± 0.18 Ab |
|
Sm |
1.83 ± 0.10 Ab |
0.02 ± 0.00 Ab |
1.21 ± 0.14 Ab |
|
|
N4 |
CK |
1.86 ± 0.35 Ba |
0.01 ± 0.00 Bb |
0.69 ± 0.08 Ab |
|
Sm |
2.62 ± 0.23 Aa |
0.04 ± 0.01 Aa |
1.49 ± 0.42 Ab |
|
|
N6 |
CK |
1.26 ± 0.22 Ab |
0.01 ± 0.00 Bc |
0.51 ± 0.13 Ab |
|
Sm |
2.47 ± 0.33 Aa |
0.02 ± 0.00 Ab |
0.79 ± 0.28 Ab |
5.4.3 Effect of common mycorrhizal network on the 15N allocation rate in roots, stems, and leaves of donor/recipient of P. massoniana seedlings under different nitrogen application levels
Figure 6A illustrates this. At the N0 application, the donor of P. massoniana seedlings under CK treatment had the greatest 15N allocation rate in the roots, at 74.8%, followed by 15.37% in the stems; with Sm treatment, the highest value was in the leaves, at 62.47%, followed by 28.17% in the roots. With the exception of N4 treatment, when Sm seedlings' 15N allocation rate was slightly higher in the root (41.13%), CK and Sm seedlings' 15N allocation rate was highest in the roots (45.21%) and lowest in the leaves (41.13%) during N2, N4, and N6 application.
The recipient seedlings (Fig. 6B) had the highest 15N allocation rate in their roots, followed by their leaves, under the CK and Sm treatment at the N0 application. The 15N allocation rates of the CK and Sm treatments were root > stem > leaf at the N2 application. Under CK treatment, the maximum rate of 15N allocation at N4 application was 63.83% in roots, followed by 20.42% in leaves; under Sm treatment, leaves (50.59) were greater than roots (37.01%) and stems (12.40%). When N6 was applied, the stems had the highest 15N allocation rate under the CK treatment (39.28%), followed by the roots (33.69%), and the roots had the highest 15N allocation rate under the Sm treatment (72.66%), followed by the leaves (21.38%).
5.5 Principal component and correlation analysis
5.5.1 Principal components and correlation analysis of donor
In order to perform principal component analysis of the seedlings treated with different nitrogen concentrations of Sm and CK, 26 indexes were selected from the donor seedlings, including infection rate, root-stem-leaf biomass, root-top ratio, root-stem-leaf nutrient NPK content, root-stem-leaf nitrogen uptake, mycelial contribution rate, root-stem-leaf 15N uptake, 15N utilization rate, 15N transfer rate, and root-stem-leaf 15N allocation rate (Table 9). The first three main components had cumulative contribution rates of 80.088% with eigenvalues larger than 1.
|
Number |
Initial feature root |
Feature roots |
||||
|---|---|---|---|---|---|---|
|
Eigenvalue |
Contribution rate/% |
Cumulative contribution rate/% |
Eigenvalue |
Contribution rate/% |
Cumulative contribution rate/% |
|
|
1 |
13.095 |
50.365 |
50.365 |
13.095 |
50.365 |
50.365 |
|
2 |
4.830 |
18.576 |
68.941 |
4.830 |
18.576 |
68.941 |
|
3 |
2.898 |
11.147 |
80.088 |
2.898 |
11.147 |
80.088 |
|
4 |
1.381 |
5.310 |
85.398 |
|||
|
5 |
1.256 |
4.831 |
90.229 |
|||
|
6 |
0.831 |
3.197 |
93.425 |
|||
|
7 |
0.471 |
1.813 |
95.238 |
|||
|
8 |
0.314 |
1.207 |
96.445 |
|||
|
9 |
0.263 |
1.013 |
97.457 |
|||
|
10 |
0.227 |
0.874 |
98.331 |
|||
|
11 |
0.173 |
0.666 |
98.997 |
|||
|
12 |
0.081 |
0.31 |
99.307 |
|||
|
13 |
0.067 |
0.258 |
99.565 |
|||
The first primary component's contribution rate was 50.365%. The donor seedlings' biomass, nitrogen uptake through their roots, stems, and leaves, as well as the rate at which nitrogen is absorbed and allocated by their stems and leaves, all show positive trends and high loads.
The second primary component's contribution rate was 18.575%. There is a positive sign and high load for the total K in roots, total K in leaves, total K in roots, and 15N uptake in roots.
The third primary component's contribution rate was 11.146%. The mycelial contribution rate, infection rate, and total P in the roots, stems, and leaves all show substantial loads and good signs.
The PCA analysis (Fig. 7A) showed that the Sm treatment was primarily dispersed in PC1 and PC2's positive region, whereas the CK treatment was primarily distributed in PC1 and PC2's negative region. It is evident that the donor seedlings' development under Sm treatment outperformed that of CK, suggesting that mycorrhiza promotes growth. Additionally, it can be observed that Sm-N0 is primarily dispersed in the positive region of PC1, Sm-N6 is primarily distributed in the positive region of PC2, and Sm-N4 and Sm-N2 are primarily distributed in the positive regions of PC1 and PC2 (Fig. 7B). Of these, there was a substantial correlation between Sm-N4 and the biomass of the stem, nitrogen intake, and mycelial infection rate. Sm-N4 and Sm-N6 treatment had a significant effect on the biomass and nitrogen uptake of donor seedlings, as evidenced by the high correlations found between them and the 15N uptake of the root, stem, and leaf as well as the 15N allocation rate. Additionally, the complete score showed that at N4, donor seedling development and nutrient absorption, transfer, and distribution under Sm treatment were at their greatest (Table 10).
|
F1 |
F2 |
F3 |
F |
Order |
|
|---|---|---|---|---|---|
|
Sm-N4 |
4.9237 |
1.4157 |
-0.7426 |
5.5969 |
1 |
|
Sm-N6 |
5.0581 |
-2.2912 |
2.6259 |
5.3927 |
2 |
|
Sm-N2 |
0.9149 |
2.0572 |
0.6134 |
3.5855 |
3 |
|
Sm-N0 |
-1.7264 |
3.6711 |
0.3444 |
2.2892 |
4 |
|
CK-N4 |
1.1312 |
-0.0253 |
-3.0236 |
-1.9177 |
5 |
|
CK-N0 |
-5.6890 |
0.2430 |
1.8541 |
-3.5919 |
6 |
|
CK-N6 |
-1.0463 |
-2.6558 |
-0.8741 |
-4.5762 |
7 |
|
CK-N2 |
-3.5663 |
-2.4147 |
-0.7974 |
-6.7785 |
8 |
5.5.2 Principal components and correlation analysis of recipient
In order to perform principal component analysis of the seedlings treated with different nitrogen concentrations of Sm and CK, 26 indexes were selected from the donor seedlings, including infection rate, root-stem-leaf biomass, root-top ratio, root-stem-leaf nutrient NPK content, root-stem-leaf nitrogen uptake, mycelial contribution rate, root-stem-leaf 15N uptake, 15N utilization rate, 15N transfer rate, and root-stem-leaf 15N allocation rate (Table 11). The first four main components had cumulative contribution rates of 78.587% with eigenvalues that were all greater than 1.
|
Number |
Initial feature root |
Feature roots |
||||
|---|---|---|---|---|---|---|
|
Eigenvalue |
Contribution rate/% |
Cumulative contribution rate/% |
Eigenvalue |
Contribution rate/% |
Cumulative contribution rate/% |
|
|
1 |
11.961 |
46.002 |
46.002 |
11.961 |
46.002 |
46.002 |
|
2 |
3.672 |
14.122 |
60.124 |
3.672 |
14.122 |
60.124 |
|
3 |
2.744 |
10.555 |
70.680 |
2.745 |
10.555 |
70.680 |
|
4 |
2.056 |
7.906 |
78.586 |
2.056 |
7.906 |
78.586 |
|
5 |
1.687 |
6.487 |
85.073 |
|||
|
6 |
1.049 |
4.034 |
89.107 |
|||
|
7 |
0.794 |
3.055 |
92.162 |
|||
|
8 |
0.684 |
2.631 |
94.793 |
|||
|
9 |
0.447 |
1.718 |
96.511 |
|||
|
10 |
0.328 |
1.262 |
97.773 |
|||
|
11 |
0.218 |
0.839 |
98.612 |
|||
|
12 |
0.145 |
0.556 |
99.168 |
|||
|
13 |
0.067 |
0.258 |
99.565 |
|||
The first primary component's contribution proportion was 46.002%. There was a positive sign and high load in the root-stem-leaf biomass, nitrogen uptake, 15N uptake, allocation and utilization rates, and infection rate.
The second primary component's contribution proportion amounted to 14.122%. The root-top ratio, mycelial contribution rate, and total P content in roots and stems were all positive and heavily loaded.
The third primary component's contribution percentage was 10.555%. There was a positive sign and high load for the 15N transfer rate, total N content in roots, stems, and leaves, mycelial contribution rate, and 15N allocation rate in stems.
The fourth primary component's contribution proportion is 7.906%. Roots and stems have a positive sign and a high load for the absorption and allocation rate of 15N.
The PCA analysis (Fig. 8A) shows that the Sm treatment was primarily dispersed in PC1 and PC2's positive region, whereas the CK treatment was primarily distributed in PC1 and PC2's negative region. As can be observed, the recipient seedlings' development under Sm treatment outperformed that of CK, suggesting that P. massoniana seedlings could create a shared mycorrhizal network and that mycorrhiza was beneficial to the recipient seedlings' growth. The distribution of Sm-N6 and Sm-N2 is primarily found in the positive regions of PC1 and PC2, whereas the distribution of Sm-N0 and Sm-N4 is primarily found in the positive regions of PC1 and PC2, respectively (Fig. 8B). The results showed that Sm-N6 treatment had the greatest effect on recipient seedlings' biomass and nitrogen uptake. Of them, the biomass of the root, stem, and leaf, nitrogen uptake, mycelial infection rate, and contribution rate of recipient seedlings were strongly correlated with Sm-N6 and Sm-N4. The complete score also showed that at N4, recipient seedlings under Sm treatment had the best growth, nutrient absorption, transfer, and distribution (Table 12).
|
F1 |
F2 |
F3 |
F |
Order |
|
|---|---|---|---|---|---|
|
Sm-N4 |
4.9237 |
1.4157 |
-0.7426 |
5.5969 |
1 |
|
Sm-N6 |
5.0581 |
-2.2912 |
2.6259 |
5.3927 |
2 |
|
Sm-N2 |
0.9149 |
2.0572 |
0.6134 |
3.5855 |
3 |
|
Sm-N0 |
-1.7264 |
3.6711 |
0.3444 |
2.2892 |
4 |
|
CK-N4 |
1.1312 |
-0.0253 |
-3.0236 |
-1.9177 |
5 |
|
CK-N0 |
-5.6890 |
0.2430 |
1.8541 |
-3.5919 |
6 |
|
CK-N6 |
-1.0463 |
-2.6558 |
-0.8741 |
-4.5762 |
7 |
|
CK-N2 |
-3.5663 |
-2.4147 |
-0.7974 |
-6.7785 |
8 |
The biomass of roots and stems, as well as the uptake of N by roots, stems, and leaves, showed a strong positive connection with the mycorrhizal infection rate (P < 0.01, Fig. 9). The biomass, nitrogen uptake, and 15N uptake of roots, stems, and leaves were also strongly positively associated (P < 0.01), as were the total K, total N, and total P of donor/recipient seedlings. Furthermore, a noteworthy positive association was seen between the rate of 15N absorption and allocation in the roots of recipient and donor seedlings, as well as the nitrogen intake and biomass of the roots, stems, and leaves (P < 0.01).
6.1 Effects of ectomycorrhizal fungi and nitrogen application on the growth of donor/recipient of P. massoniana seedlings
Plant development and the distribution pattern of nutrients are significantly influenced by the rate at which nitrogen is applied (Duan et al. 2022). In times of nitrogen scarcity, plants will transfer more photosynthates to the roots, improving the roots' ability to absorb nitrogen. Increased nitrogen supply at the right rate greatly aided in the growth of the roots, stems, and leaves. In general, stem and leaf growth outpaced root growth, thus as nitrogen treatment increased, the root-top ratio decreased (Li et al. 2023). Additionally, the study discovered that when nitrogen delivery increased, the root-top ratio of donor seedlings receiving CK treatment progressively dropped. Furthermore, in line with the findings of Wang et al. (2018), the biomass of donor/recipient seedlings grew initially before declining as nitrogen treatment increased. In line with other research (Guo et al. 2021; Zhou et al. 2020; Tu et al. 2022), inoculation may encourage the biomass accumulation of P. massoniana seedlings at the same nitrogen delivery rate. The best performance was attained at the N4 (4 g/L).
6.2 Effects of ectomycorrhizal fungi and nitrogen application on nutrient uptake of donor/recipient of P. massoniana seedlings
Increased total nitrogen content results from fertilizing the seedlings, which aids in fostering their growth and bolstering their resilience (Zhu et al. 2011). According to Wang et al. (2023) and Fabiańska et al. (2020), ECM fungi have the ability to secrete phosphatase, increase soil phosphatase activity, improve soil phosphorus absorption and transport capacity, and enhance phosphorus absorption by host plants. These actions indirectly promote nutrient absorption. Furthermore, ECM fungi's mycelium spreads throughout the soil, encouraging host plants to absorb nutrients and raising their levels of potassium, phosphate, and nitrogen (Xiao et al. 2023; Ortas et al. 2022). The study's findings demonstrated that Sm inoculation might raise the amounts of total nitrogen, potassium, and phosphorus in roots, leaves, and the stem. The nutrient demand of stems inoculated with Sm has likely reached saturation, as evidenced by the lower content of total potassium and total nitrogen in stems compared to CK. This means that nutrients will be transported to the leaves and roots, where they will improve photosynthetic capacity and encourage the growth of seedlings. With the N4 application, there was an improvement in the absorption of total phosphorus, total potassium, and total nitrogen.
It appears that inoculation could enhance nitrogen uptake since the roots, stems, and leaves of seedlings inoculated with Sm absorbed more nitrogen than seedlings inoculated with CK under the same nitrogen administration. Apart from the maximum uptake of nitrogen by the roots at N6, the maximum uptake of nitrogen by the donor/recipient stems and leaves happened at N4, and then at N6. While ECM fungi can supply nitrogen to their host plants, when nitrogen is scarce, they also store different amounts of nitrogen to suit their own requirements (Benavent et al. 2019; Gu et al. 2023). Additionally, the study discovered that donor/recipient seedlings absorbed very little 15N during N0 treatment, and that this may have been due to soil 15N. When nitrogen application increased during the Sm treatment, the amount of 15N absorbed by the recipient's roots, donor roots, stems, and leaves grew progressively. The maximum amounts of 15N absorbed by the recipient's stems and leaves were N2 and N4, respectively.
6.3 Effects of ectomycorrhizal fungi and nitrogen application on 15N utilization, transfer and allocation rates of donor/recipient of P. massoniana seedlings
One crucial indicator of a plant's ability to absorb and use nitrogen is its nitrogen consumption rate (Ghadirnezhad et al. 2024). The type of nitrogen present in the growth medium had an impact on plants' ability to utilize nitrogen (Martins et al. 2022). Higher plants primarily absorb nitrogen in the forms of ammonium and nitrate nitrogen. Nitrous nitrogen, elemental nitrogen, and certain soluble organic nitrogen compounds are less readily absorbed by plants, making nitrogen one of the primary factors limiting plant growth (Ma et al.2024; Deb et al. 2023). The fact that the study's donor/recipient 15N consumption rate under N0 was zero suggests that the meager amount of 15N present in the soil was insufficient to meet the needs of the plants. The reason for the high transfer rate could be that the donor and recipient seedlings have similar absorption capacities of the natural 15N concentration in the soil, meaning that there is little variation in their 15N content.
The results of this investigation showed that the nitrogen treatment rates of donor and recipient seedlings varied. The 15N allocation rate in the donor seedlings under Sm treatment was root > leaf > stem at N2 and N6, and leaf > root > stem at N0 and N4. In the recipient seedlings, at N0 and N6, root > stem > leaf; at N2 treatment, root > stem > leaf; and at N4 treatment, leaf > root > stem was the 15N allocation rate under Sm treatment. According to Qiang et al. (2023) increased N allocation rate in leaves promotes the synthesis of photosynthetic pigments, which in turn increases seedlings' capability for photosynthetic processes. Additionally, it was discovered that the Masson pine seedlings' mycorrhization reduced the roots' distribution ratios of N, P, and K (Sun et al. 2023).
6.4 Principal component and correlation analysis
In this study, the rate of mycorrhizal infection rose with the amount of nitrogen that seedlings absorbed, and the rate of nitrogen intake increased with the amount of biomass. The 15N transfer rate had an impact on the stem and leaf biomass, 15N absorption, and 15N allocation rate of recipient seedlings. ECM fungi are evidently essential to the nitrogen nutrition of seedlings, as they can boost the host plants' ability to absorb nutrients (Plett et al. 2023), and ectomycorrhiza can improve the efficiency of N utilization while encouraging the growth of seedlings (Sun et al. 2022).
(1) Through chambers B and C, the donor's P. massoniana mycelia can infect the recipient seedlings in chamber D, forming a mycorrhiza network between the donor and recipient. The greater the infection rate, the more detrimental the infection is to the recipient seedlings' growth and ability to absorb nutrients. P. massoniana seedling biomass accumulation was encouraged by inoculation at the same nitrogen level, with N4 (4 g/L) treatment demonstrating the greatest results.
(2) The N4 application is advantageous to donor/recipient seedlings' absorption of total nitrogen, total phosphorus, and total potassium under the same inoculation treatment, and the nitrogen absorption rate was the highest. The inoculation of donor/recipient seedlings enhanced their root, stem, and leaf uptake of nitrogen at the same nitrogen delivery rate.
(3) Applying nitrogen may enhance the uptake of 15N by recipient and donor plants. With N6 application, donor/recipient seedlings absorbed the most 15N, followed by N4. When the nitrogen dose of N4 was provided, the donor/recipient seedlings injected with Sm showed the highest rates of both 15N utilization and transmission. The 15N transfer rate had a substantial impact on the recipient seedlings' 15N absorption and allocation rates. The effects of varying nitrogen treatment rates on recipient and donor seedlings' 15N allocation varied. The donor/recipient seedlings under Sm treatment had the highest 15N allocation rate in the root under N2 and N6, and the highest in the leaf under N4.
In summary, P. massoniana seedlings develop and absorb nutrients, transfer, and distribute themselves more readily when treated with Sm-N4.
Conflicts of Interest:
The authors declare that they have no known competing financial interests or personal relationships that could have appeared to influence the work reported in this paper.
Funding:
This research was supported by the National Natural Science Foundation Project (32360379), Guizhou Provincial Basic Research Program of Natural Science (qjhe-ZK[2022]General207), The Key Laboratory of Guizhou Plateau Mountain Forest Cultivation Open Foundation Project, National Natural Science Foundation Project(32360007).
Author Contribution
Y.W conceived and designed the experiment; Y.Z.R and G.Y.T analyzed the data and wrote the manuscript; C.M performed the experiments and sorted out data; Z.Y.Z revise the manuscript. All authors have revised the manuscript and approved the version submitted.
Acknowledgments:
We would like to thank Professor Guijie Ding from the College of Ecological and Environmental Engineering of Guizhou University for support and help the project. The excellent forest stands in Duyun City, Guizhou Province, provided P. massoniana seeds.
Data Availability Statement:
Data will be made available on request.
- Awaydul A, Zhu W, Yuan Y et al (2019) Common mycorrhizal networks influence the distribution of mineral nutrients between an invasive plant, Solidago canadensis, and a native plant, Kummerowa striata. Mycorrhiza 29(1):29–38. https://doi.org/10.1007/s00572-018-0873-5
- Bao SD (2015) Soil agrochemical analysis, 3rd editio. China Agriculture Press, Beijing
- Benavent-González Alberto R, José V, Johana et al (2019) High nitrogen contribution by Gunnera magellanica and nitrogen transfer by mycorrhizas drive an extraordinarily fast primary succession in sub-Antarctic Chile. New Phytol 223(2):661–674. https://doi.org/10.1111/nph.15838
- Bever JD, Dickie IA, Facelli E et al (2010) Rooting theories of plant community ecology in microbial interactions. Trends Ecol Evol 25(8):468–478. https://doi.org/10.1016/j.tree.2010.05.004
- Cai XB, Feng G, Qian C, Gai JP (2007) Effects of am fungi on steppe plants and soil environment in Tibet plateau. Acta Pedol Sin 44(1):63–72. 10.11766/trxb200506140110
- Cao BF, Jiang HX, Liu L et al (2021) Research progress on mechanism of arbuscular common mycorrhizal networks in plant-plant interactions. Chin J Appl Ecol 32(9):3385–3396. 10.13287/j. 202111. 032
- Chandrasekaran M (2020) A meta-analytical approach on arbuscular mycorrhizal fungi inoculation efficiency on plant growth and nutrient uptake. Agriculture 10(9):370. https://doi.org/10.3390/agriculture10090370
- Deb Paramita M, Anwesha H et al (2023) Improving plant nutrient use efficiency for climate-resilient agriculture. Climate-Resilient Agric 2:209–243. https://doi.org/10.1007/978-3-031-37428-9-10
- Duan YK, Yang HY, Wu WL et al (2022) Molecular Mechanisms of Nitrogen Absorption, Transport, and Assimilation in Plants. Fujian J Agricultural Sci 37(4):547–554. 10.19303/j.issn.1008-0384.2022.004.016
- Fabiańska Izabela P, Lina K, Eva et al (2020) Neighboring plants divergently modulate effects of loss-of-function in maize mycorrhizal phosphate uptake on host physiology and root fungal microbiota. PLoS ONE 15(6):e0232633. https://doi.org/10.1371/journal.pone.0232633
- Formenti Ludovico IA, Natalie H, Gustavo et al (2023) Macroevolutionary decline in mycorrhizal colonization and chemical defense responsiveness to mycorrhization. iScience 26(5):106632–106632. 10.1016/j.isci.2023.106632
- Gao WL, Zaynur Turxun, Sang Y et al (2021) Effect of arbuscular mycorrhizal fungi on nitrogen absorption of plants: A review. Chin Agric Sci Bull 37(27):53–58. https://kns.cnki.net/kcms2/article/abstract
- Roghie GSS, Amin F, Fakher K et al (2024) Nitrogen contribution in plants: recent agronomic approaches to improve nitrogen use efficiency. J Plant Nutr 47(2):314–331. https://doi.org/10.1080/01904167.2023.2278656
- Gu XR, Jia H, Wang XH et al (2023) Differential aluminum tolerance and absorption characteristics in Pinus massoniana seedlings colonized with ectomycorrhizal fungi of Lactarius deliciosus and Pisolithus tinctorius. J Forestry Res 34(5):1523–1533. https://doi.org/10.1007/s11676-022-01583-1
- Gui WW, Ze XJ, Timothy S, George et al (2023) Arbuscular mycorrhizal fungi enhance plant phosphorus uptake through stimulating hyphosphere soil microbiome functional profiles for phosphorus turnover. New Phytol 10(3):1462–1490. https://doi.org/10.1111/nph.18772
- Guo PP, Huang XR, Wu WW et al (2021) Effects of different nitrogen application methods and levels on soil bacterial communities of Pinus massoniana and Schima superba seedling roots. Acta Ecol Sin 41(1):149–161. 10.5846 /stxb201907071429
- Li YJ (2023) Effects of different nitrate-ammonium nitrogen ratios on nitrogen uptake and physiological metabolism of flue-cured and burley tobacco. Henan Agricultural University
- Lian FZ, Lin YB, Hu L et al (2019) Transfer of mechanical wounding signaling between tomato plants through common mycorrhizal networks. Journal of Fujian Agriculture and Forestry University (Natural Science Edition) 48(1):9–15. 10. 13323 /j. Cnki. J. fafu(nat. Sci.). 2019. 01. 003
- Lin Z, Qun C, Jianwei Z et al (2023) Soil phosphorus availability determines the preference for direct or mycorrhizal phosphorus uptake pathway in maize. Geoderma 403(20):115–261. https://doi.org/10.1016/j.geoderma.2021.115261
- Liu YY, Zhao QX, Deng X et al (2020) Effects of indigenous arbuscular mycorrhizal fungi and nitrogen forms on plant nitrogen utilization and the influencing factors in a pepper-common bean intercropping system. Chin J Eco-Agriculture 28(2):245–254. 10.13930/j.cnki.cjea.190575
- Ma DC, Teng WC, Mo YT et al (2024) Effects of nitrogen, phosphorus, and potassium fertilization on plant growth, element levels in plants and soil, and the relationships among nutrient concentrations, plant yield, and nutrient status in; Erythropalum scandens; (Blume). J Plant Nutr 47(1):82–96. https://doi.org/10.1080/01904167.2023.2262504
- Martins LF, Oh J, Melgar A et al (2022) Effects of phytonutrients and yeast culture supplementation on lactational performance and nutrient use efficiency in dairy cows. J Dairy Sci 106(3):1746–1756. 10.3168/jds.2022–22482
- Musa Y, Ridwan I, Ponto H et al (2020) Application of arbuscular mycorrhizal fungus (AMF) improves the growth of single-bud sugarcane (Saccharum officinarum L.) seedlings from different bud location. IOP Conf Ser: Earth Environ Sci 486:12122. 10.1088/1755 – 1315/486/1/012122
- Ortas Ibrahim B Gizem (2022) Mycorrhizal species selectivity of sweet sorghum genotypes and their effect on nutrients uptake. Acta Agriculturae Scand Sect B-Soil Plant Sci 72(1):733–743. https://doi.org/10.1080/09064710.2022.2063167
- Plett Krista L, Wojtalewicz Dominika, Anderson Ian C et al (2023) Fungal metabolism and free amino acid content may predict nitrogen transfer to the host plant in the ectomycorrhizal relationship between Pisolithus spp. and Eucalyptus grandis. The New phytologist 19400. https://doi.org/10.1111/nph.19400
- Qiang BB, Zhou WX, Zhong XJ et al (2023) Effect of nitrogen application levels on photosynthetic nitrogen distribution and use efficiency in soybean seedling leaves. J Plant Physiol 287:154051. 10.1016/j.jplph.2023.154051
- Ralf Oelmüller (2019) Interplant communication via hyphal networks Plant Physiology Reports: Formerly known as 'Indian. Journal of Plant Physiology 24(1901):463–473. https://doi.org/10.1007/s40502-019-00491-7
- Song Y, Wang M, Zeng R et al (2019) Priming and filtering of antiherbivore defences among Nicotiana attenuata plants connected by mycorrhizal networks. Plant Cell Environ 42(11):2945–2961. 10.1111/pce.13626
- Strullu DC, Selosse MA, Kenrick P et al (2018) The origin and evolution of mycorrhizal symbioses: From palaeomycology to phylogenomics. New Phytol 220:1012–1030. https://doi.org/10.1111/nph.15076
- Sun PF, Cheng RM, Xiao WF et al (2022) The Relationship between ectomycorrhizal fungi, nitrogen deposition, and Pinus massoniana seedling nitrogen transporter gene expression and nitrogen uptake kinetics. J Fungi 9(1):65. https://doi.org/10.3390/jof9010065
- Sun PF, Shen YF, Wang LJ et al (2023) Effects of nitrogen addition and ectomycorrhizal fungi on growth and photosynthetic characteristics of Pinus massoniana seedlings. Plant Sci J 41(1):112–120 10.11913/PSJ. 2095 – 0837. 22113
- Tu GY, Wang Y, Tian L et al (2022) Effects of ectomycorrhizal fungal hyphae on transfer of nitrogen among Pinus massoniana seedlings. Mycosystema 41(12):2004–2015. 10.13346/j.mycosystema.220075
- Walder F, Niemann H, Natarajan M et al (2012) Mycorrhizal networks: common goods of plants shared under unequal terms of trade. Plant Physiol 159(2):789–797. https://doi.org/10.1104/pp.112.195727
- Wang C (2020) The effect of arbuscular mycorrhizal fungi on the interaction between wheat and aphid in different districts. Henan University, Kai Feng
- Wang GW, Jin ZX, George Timothy S et al (2023) Arbuscular mycorrhizal fungi enhance plant phosphorus uptake through stimulating hyphosphere soil microbiome functional profiles for phosphorus turnover. New Phytol 238(6):2578–2593. https://doi.org/10.1111/nph.18772
- Wang YM, Wan FX, Li RR et al (2018a) Effects of Exponential Fertilization on Growth and Nutrient Accumulation of Carya illinoensis Seedlings. J Northeast Forestry Univ 46(9):21–25. 10.13759/j.cnki.dlxb.2018.09.005
- Wang Y, Yang KL (2022) Response of mycorrhizal Piuns massoniana seedling on growth morphology to drought and rewatering. Southwest china J agricultural Sci 35(8):1794–1801. 10.16313/j.cnki.scjas.2022.8.009
- Whiteside MD, Werner GDA, Caldas VEA et al (2019) Mycorrhizal fungi respond to resource inequality by moving phosphorus from rich to poor patches across networks. Curr Biol 29(12):2043–2050. https://doi.org/10.1016/j.cub.2019.04.061
- Wipf D, Krajinski F, Van Tuinen D et al (2019) Trading on the arbuscular mycorrhiza market: from arbuscules to common mycorrhizal networks. New Phytol 223(3):1127–1142. https://doi.org/10.1111/nph.15775
- Wu JY, Hu W, Yang ZY et al (2022) Recent advances in the interaction between mycorrhizal fungi and different fungi in plant root microecosystem. Journal of Henan Agricultural Sciences 51(2):1–9. 10. 15933/j. cnki. 1004–3268. 2022. 02. 001
- Xiao XF, Liao XF, Yan QX et al (2023) Arbuscular mycorrhizal fungi improve the growth, water status, and nutrient uptake of cinnamomum migao and the soil nutrient stoichiometry under drought stress and recovery. J Fungi 9(3):321–321. https://doi.org/10.3390/jof9030321
- Zhang ZF, Zhang JC, Huang YQ et al (2016) Effects of mycorrhizal fungi on the drought tolerance of Cyclobalanopsis glauca seedlings. Acta Ecol Sin 36(11):3402–3410. http://dx.doi.org/10.5846/stxb201506261301
- Zhao DC, Jiang YM, Peng FT et al (2006) Storage and Remobilization of Nitrogen by Chinese Jujube (Z. jujuba Mill. var. inermis Rehd) Seedling as Affected by Timing of 15N Supply. Scientia Agricultura Sinica 8:1626–1631. https://doi.org/10.1016/S1671-2927(06)60123-5
- Zhou W, Su CH, Cao Y (2020) Effects of N and P Fertilizers on Growth and Nutrient Accumulation and Transportation of Pinus massoniana Seedling. Guangdong Agricultural Sci 47(7):88–96. 10.16768/j. issn. 1004-874X.2020.07.011
- Zhou ZX (2001) Chinese Piuns massoniana. China forestry publishing house, Bei Jin
- Zhu Y, Liu Y, Li GL et al (2011) Effects of Nitrogen Fertilization on the Growth and Nutrient Status in Larix olgensis Seedlings. Scientia Silvae Sinicae 47(9):168–172. 10.11707/j.1001-7488.20110929
No competing interests reported.