Short-term HF diet had a significant effect on body weight loss and partially mitigated motor decline in rNLS mice
Exposure to HF diet resulted in weight gain changes over time (Fig. 2A). Both rNLS mice and WT controls fed with HF diet began to gain more weight than SC diet fed groups at 7 weeks of age, two weeks after starting the nutritional intervention, until the end of the experimental period. Statistical analysis revealed significant differences in responses to the nutritional intervention between SC and HF diet-fed rNLS mice at weeks 7 to 13 off dox, indicating that HF diet had a significant effect on weight gain in rNLS mice (Fig. 2A).
To assess eating behavior and the regulation of appetite of the animals fed both diets, the animals chow consumption (Fig. 2B) was recorded every week during the experimental period. As shown by ANOVA, dietary treatment significantly influenced total chow consumption. The duration of the nutritional intervention also had a significant influence on chow consumption (Fig. 2B). Taking in consideration the Kcal of fat obtained from both diets, it ranges between 4% of fat in the SC chow and 45% of fat in the HF chow. The overall caloric consumption, on average, per group during the 8 weeks of treatment, expressed in Kcal (SEM), was significantly higher for HF animals compared to SC control animals over all timepoints (Fig. 2C).
To determine if the nutritional intervention could delay the onset of ALS-like motor phenotypes, we conducted behavioural tests in all mice for 8 weeks, beginning at 5 weeks of age, and, 4 weeks prior to the initiation of hTDP-43ΔNLS expression by removal of dox. We performed rotarod testing on HF and SC diet-fed controls and rNLS mice and found a progressive decline in motor coordination in rNLS mice (Fig. 3A). This confirms the progressive motor deficits of the rNLS mouse model reported previously [28]. Our analysis revealed that HF diet consumption improved rotarod performance in rNLS mice. While the SC fed rNLS mice showed a significant deficit on the rotarod at 1 and 2 weeks off of dox, this was not seen with the HF fed rNLS mice, suggesting an initial protective effect of the nutritional intervention and revealing that HF diet did not significantly impair any of the neural structures implicated in the locomotor behaviour. However, we believe this calculation to be an underestimate of the beneficial effect of HF diet, because HF fed rNLS mice were significantly heavier than the SC fed rNLS mice, and weight gain itself reduces rotarod latencies [53]. Indeed, as the weight gain in HF fed rNLS mice increased further, their rotarod latencies reduced to match that of the SC fed rNLS controls.
To determine changes in neuromuscular strength the inverted grid test was performed. Our analysis revealed that SC diet-fed rNLS mice exhibited significantly decreased time to fall from the inverted grid as compared to SC diet-fed WT littermate controls from weeks 3 to 5 off dox, confirming the results reported previously [28]. Although there was a significant difference between HF and SC diet-fed rNLS mice at 3 weeks off dox (p < 0.01), no differences were observed between both groups at the latter time points (Fig. 3B). Overall, these results suggest that HF diet has a subtle effect on muscle weakness in rNLS mice.
Short-term HF diet does not impair the progression of disease in skeletal muscle in rNLS mice
To investigate the effect of the nutritional intervention on muscle innervation we analysed hindlimb TA muscle NMJs using IHC (Fig. 4A-D). Densitometry demonstrated a significant decrease in innervated NMJs in the TA muscle of SC or HF diet-fed rNLS mice relative to WT mice in response to SC (Fig. 4E). Similarly, there was a significant increase in denervated NMJs in the TA muscle of SC or HF diet-fed rNLS mice compared to WT mice (Fig. 4F). Finally, there was a slight increase in partially denervated NMJs in the TA muscle of HF diet-fed WT mice and SC or HF diet-fed rNLS mice, but the differences were not statistically significant (Fig. 4G). Overall, these results suggest that HF diet did not significantly alter the disease-associated atrophy of hindlimb tibialis anterior muscle in rNLS mice.
Short-term HF diet did not reverse the hippocampal LTP impairment in rNLS mice
We next studied synaptic transmission and plasticity in hippocampal slices of rNLS mice compared to age-matched WT littermate controls in response to SC or HF diet exposure. Statistical analysis demonstrated an impairment of induction and maintenance of LTP [54] compared with WT controls (Fig. 5A). The magnitude of post-tetanic potentiation, which represents increased neurotransmitter release after HFS was significantly attenuated in rNLS mice (10 min after HFS), regardless of the diet (Fig. 5C), and LTP maintenance was fully abolished in rNLS mice; potentiation level was statistically lower than WT controls 100 (Fig. 5D) and 180 min (Fig. 5E) after HFS application (Fig. 5E). Moreover, rNLS mice showed a tendency to impaired basal synaptic transmission, indicating lower synaptic efficacy in CA1 pyramidal neurons if rNLS mice. Overall, these results demonstrate that rNLS mice have a significant deficit in hippocampal synaptic plasticity, and that this phenotype was not influenced by the nutritional intervention.
Short-term HF diet impacts glial activation in the brain of rNLS mice.
Next, we used IHC to evaluate glial responses to nutritional intervention (Fig. 6). The distribution of GFAP immunopositive astrocytes in M1 and M2 areas was similar in rNLS mice (Fig. 6A). Image analysis demonstrated a significant increase in number and size of astrocytes in M1 and M2 regions, respectively, in rNLS mice irrespective of diet compared with WT controls, which had low number of GFAP-labelled astrocytes regardless of diet (Fig. 6B). There was a significantly higher number of Iba1-labelled microglia in the M1 area in rNLS mice on a SC diet compared to HF diet, however, microglial size was higher in HF diet-fed rNLS mice (Fig. 6C). This suggests diet differentially affects microglia cells in the M1 area of rNLS mice. This effect of diet on microglia was not seen in the M2 region in either rNLS mice or WT controls (Fig. 6D; Supple. Figure 2).
Similarly, in the hippocampus, significantly higher numbers of GFAP-labelled astrocytes were present in CA1, CA2, CA3 and DG in rNLS mice compared with WT controls (Fig. 7A). However, no significant changes were determined in GFAP-labelled astrocyte size in these hippocampal areas in rNLS mice regardless of diet (Supple. Figure 3). Finally, no significant differences in the number or size of Iba1-labelled microglia were present in the hippocampus of rNLS mice compared with WT controls (Fig. 7B; Supple. Figure 4).
Short-term HF diet improved glucose homeostasis and modified plasma metabolic disturbances in rNLS mice
To examine the metabolic effects of HF diet consumption we examined plasma samples from our mice. We found that levels of glucose were altered in rNLS mice exposed to SC or HF diets relative to WT controls. Exposure to HF diet significantly increased plasma glucose levels of WT mice, which was accompanied by higher body mass gain compared to SC fed WT mice (Fig. 8). In addition, our results indicated that SC diet-fed rNLS mice were hypoglycemic compared to either SC or HF diet-fed WT controls at 13 weeks of age (Fig. 8), confirming the disturbances in the energy metabolism of this TDP-43 mouse model as reported previously [55, 56]. As expected, HF diet rNLS mice showed higher plasma glucose levels compared with SC diet rNLS mice (Fig. 8; 164.6 mg dL-1 ± 13.97 vs. 111.3 mg dL-1 ± 11.07).
Furthermore, we also measured circulating levels of ghrelin, a gut hormone that promotes feeding, and the adipokines resistin, an adipokine associated with obesity-mediated insulin resistance, and leptin, a peptide hormone synthesized by white adipose tissue (Fig. 9). While no differences were determined in circulating ghrelin levels between rNLS mice and WT controls (Fig. 9A), peripheral resistin levels showed genotype-specific differences in response to the nutritional treatment (Fig. 9B), with circulating resistin concentrations statistically lower in rNLS mice compared to WT controls, and both SC or HF diet rNLS mice statistically lower than HF diet WT controls (Fig. 9B). In addition, leptin levels were reduced in rNLS mice compared to WT controls, being significantly lower at in both SC or HF diet-fed rNLS mice compared to HF diet-fed WT mice (Fig. 9C). To further analyze metabolism, we measured circulating levels of PAI-1, GIP, GLP-1, insulin and glucagon peptides (Fig. 9D-H). No statistically significant differences were found between rNLS mice and WT controls in response to either SC or HF diet-fed. However, significantly lower levels of insulin were present in HF diet rNLS mice compared to HF diet WT mice (Fig. 9G), suggesting a compensatory response to prevent hyperglycemia when there is insufficient insulin-stimulated glucose uptake [57].
Short-term HF diet fed had a significant effect on the gut microbiome of rNLS mice
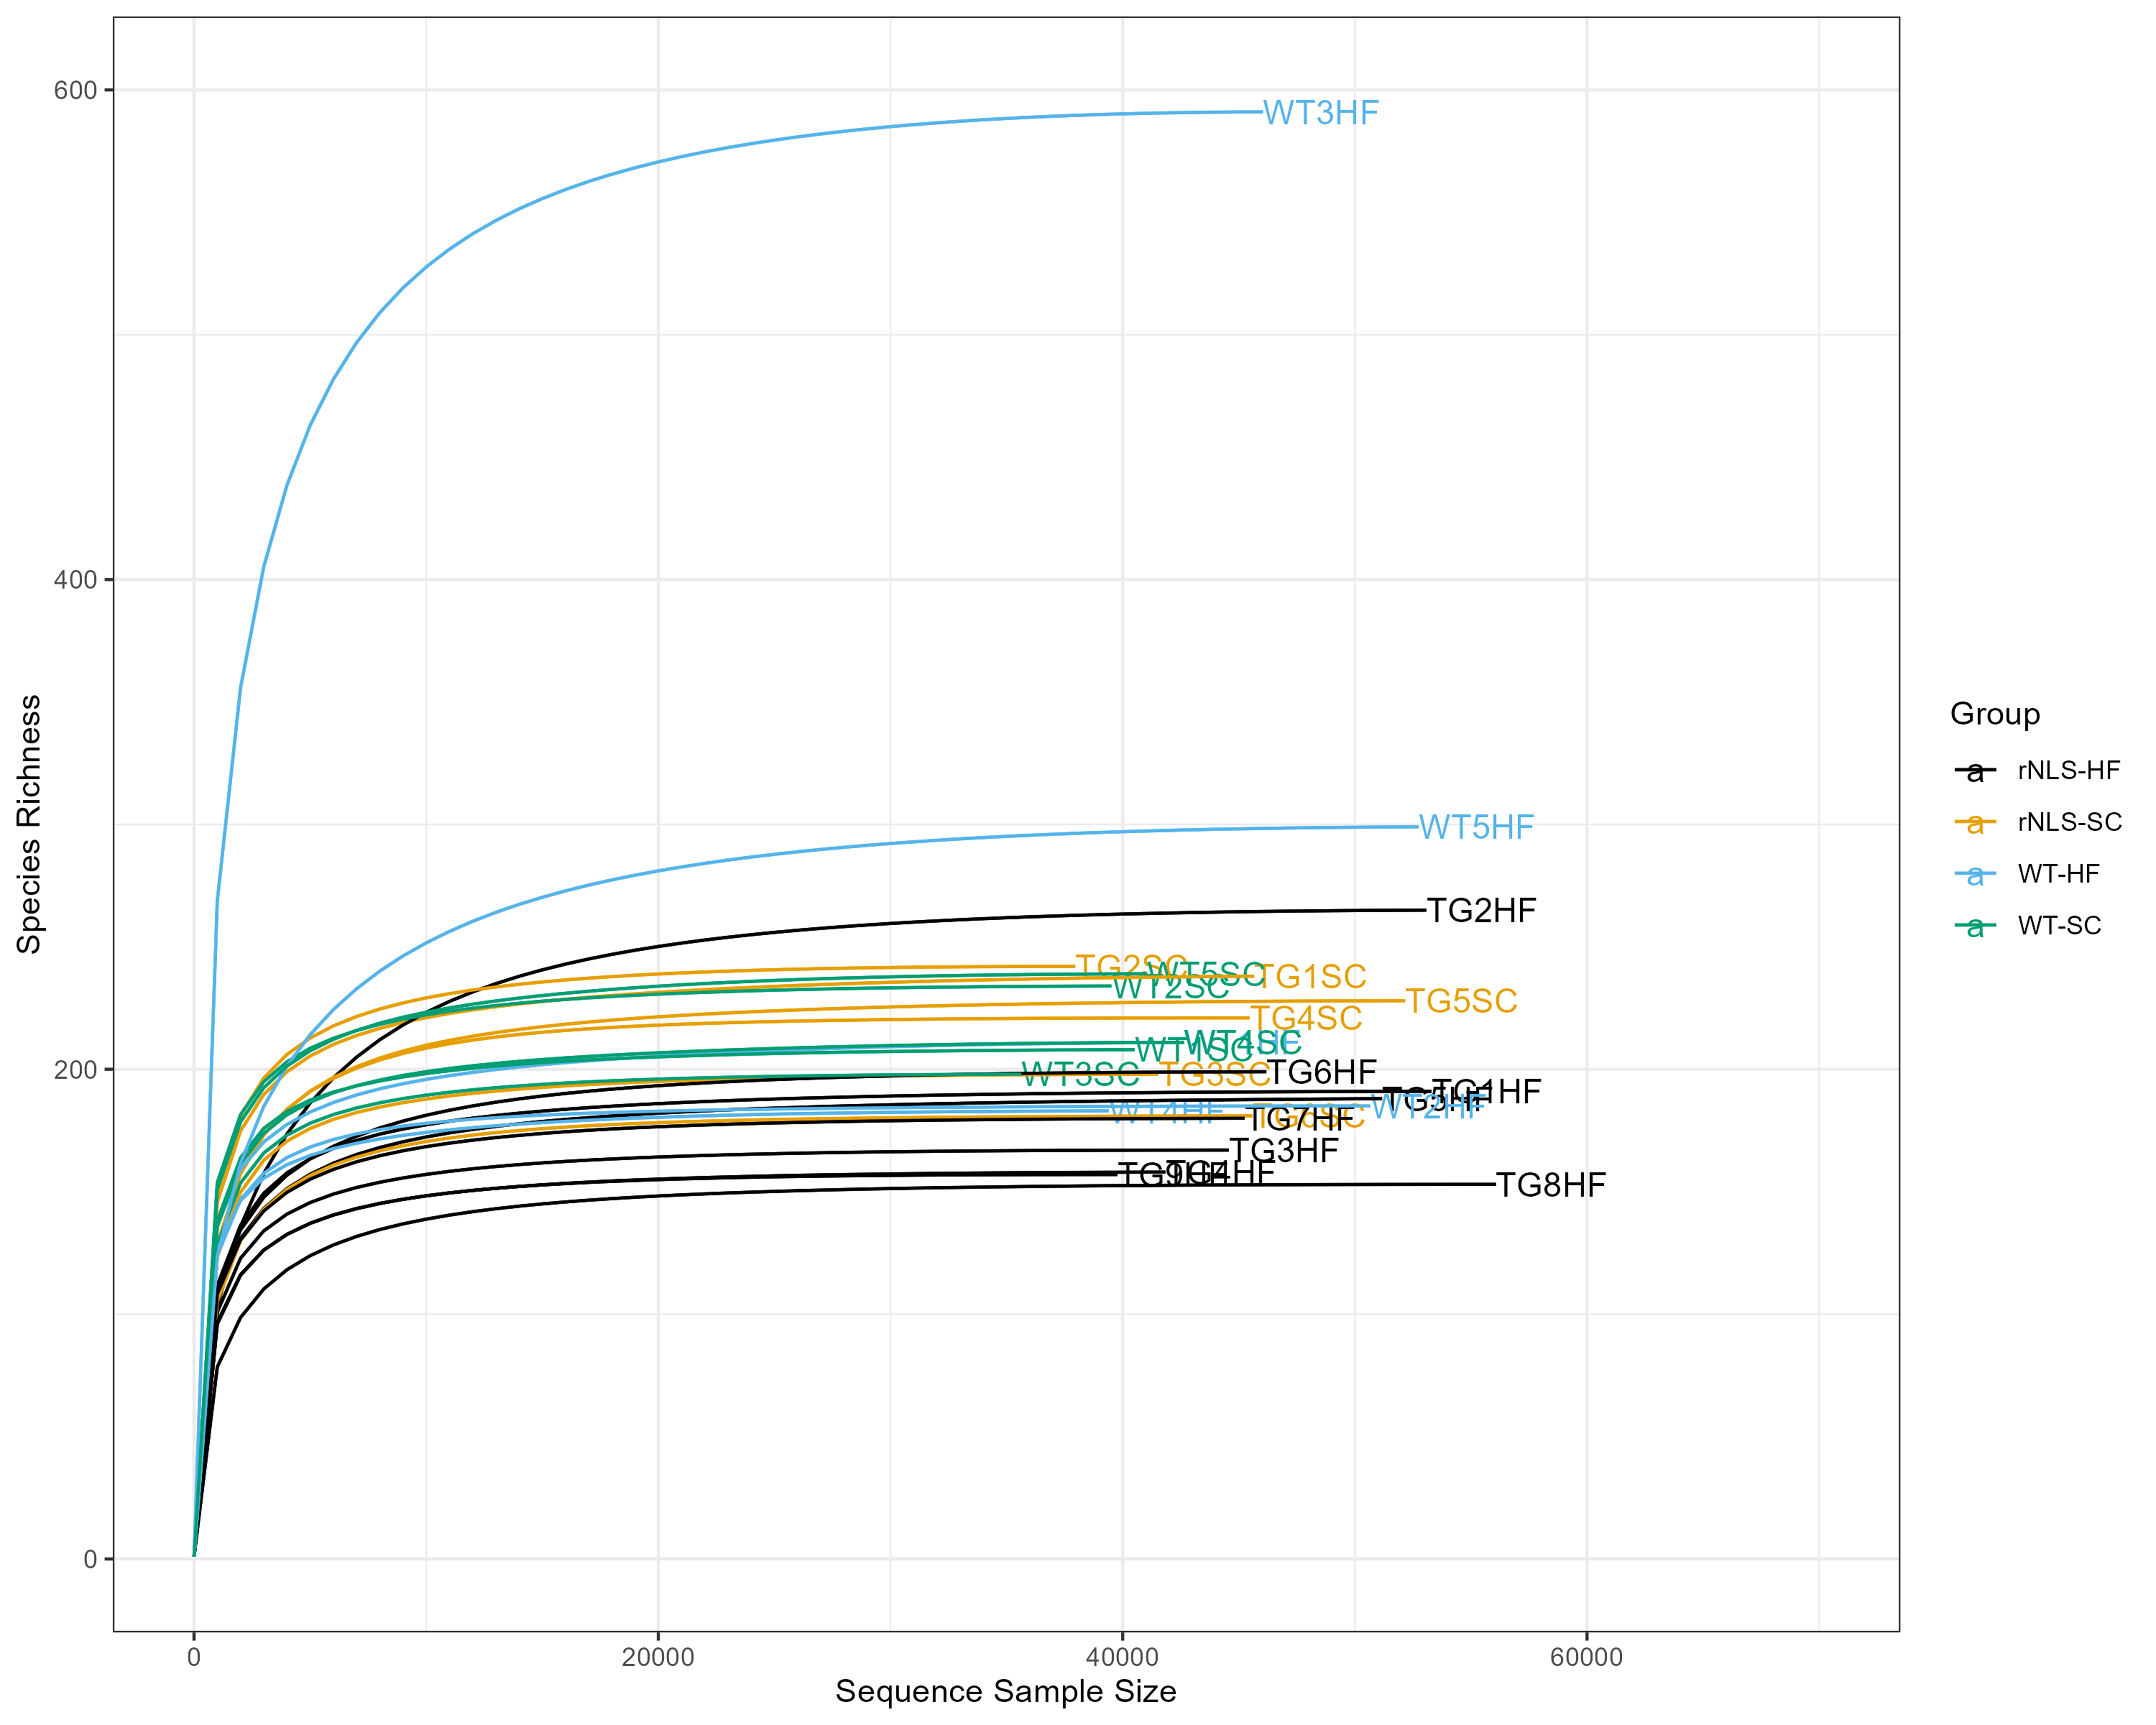
The impact of HF diet on the gut microbiome was assessed through 16 rRNA amplicon sequencing in fecal samples of rNLS mice, and compared to WT littermate controls. The rarefaction curve did not show differences in ASVs richness within genotype (rNLS vs. WT) or in response to the nutritional intervention (HF vs. SC) (Suppl. Figure 5), except for the fecal sample of WT3-HF, which showed a relatively high number of ASVs compared to the rest (approximately 600 ASVs). Considering that all the curves reached the plateau, we further conclude that deeper sequencing would not have significantly increased the number of ASVs obtained.
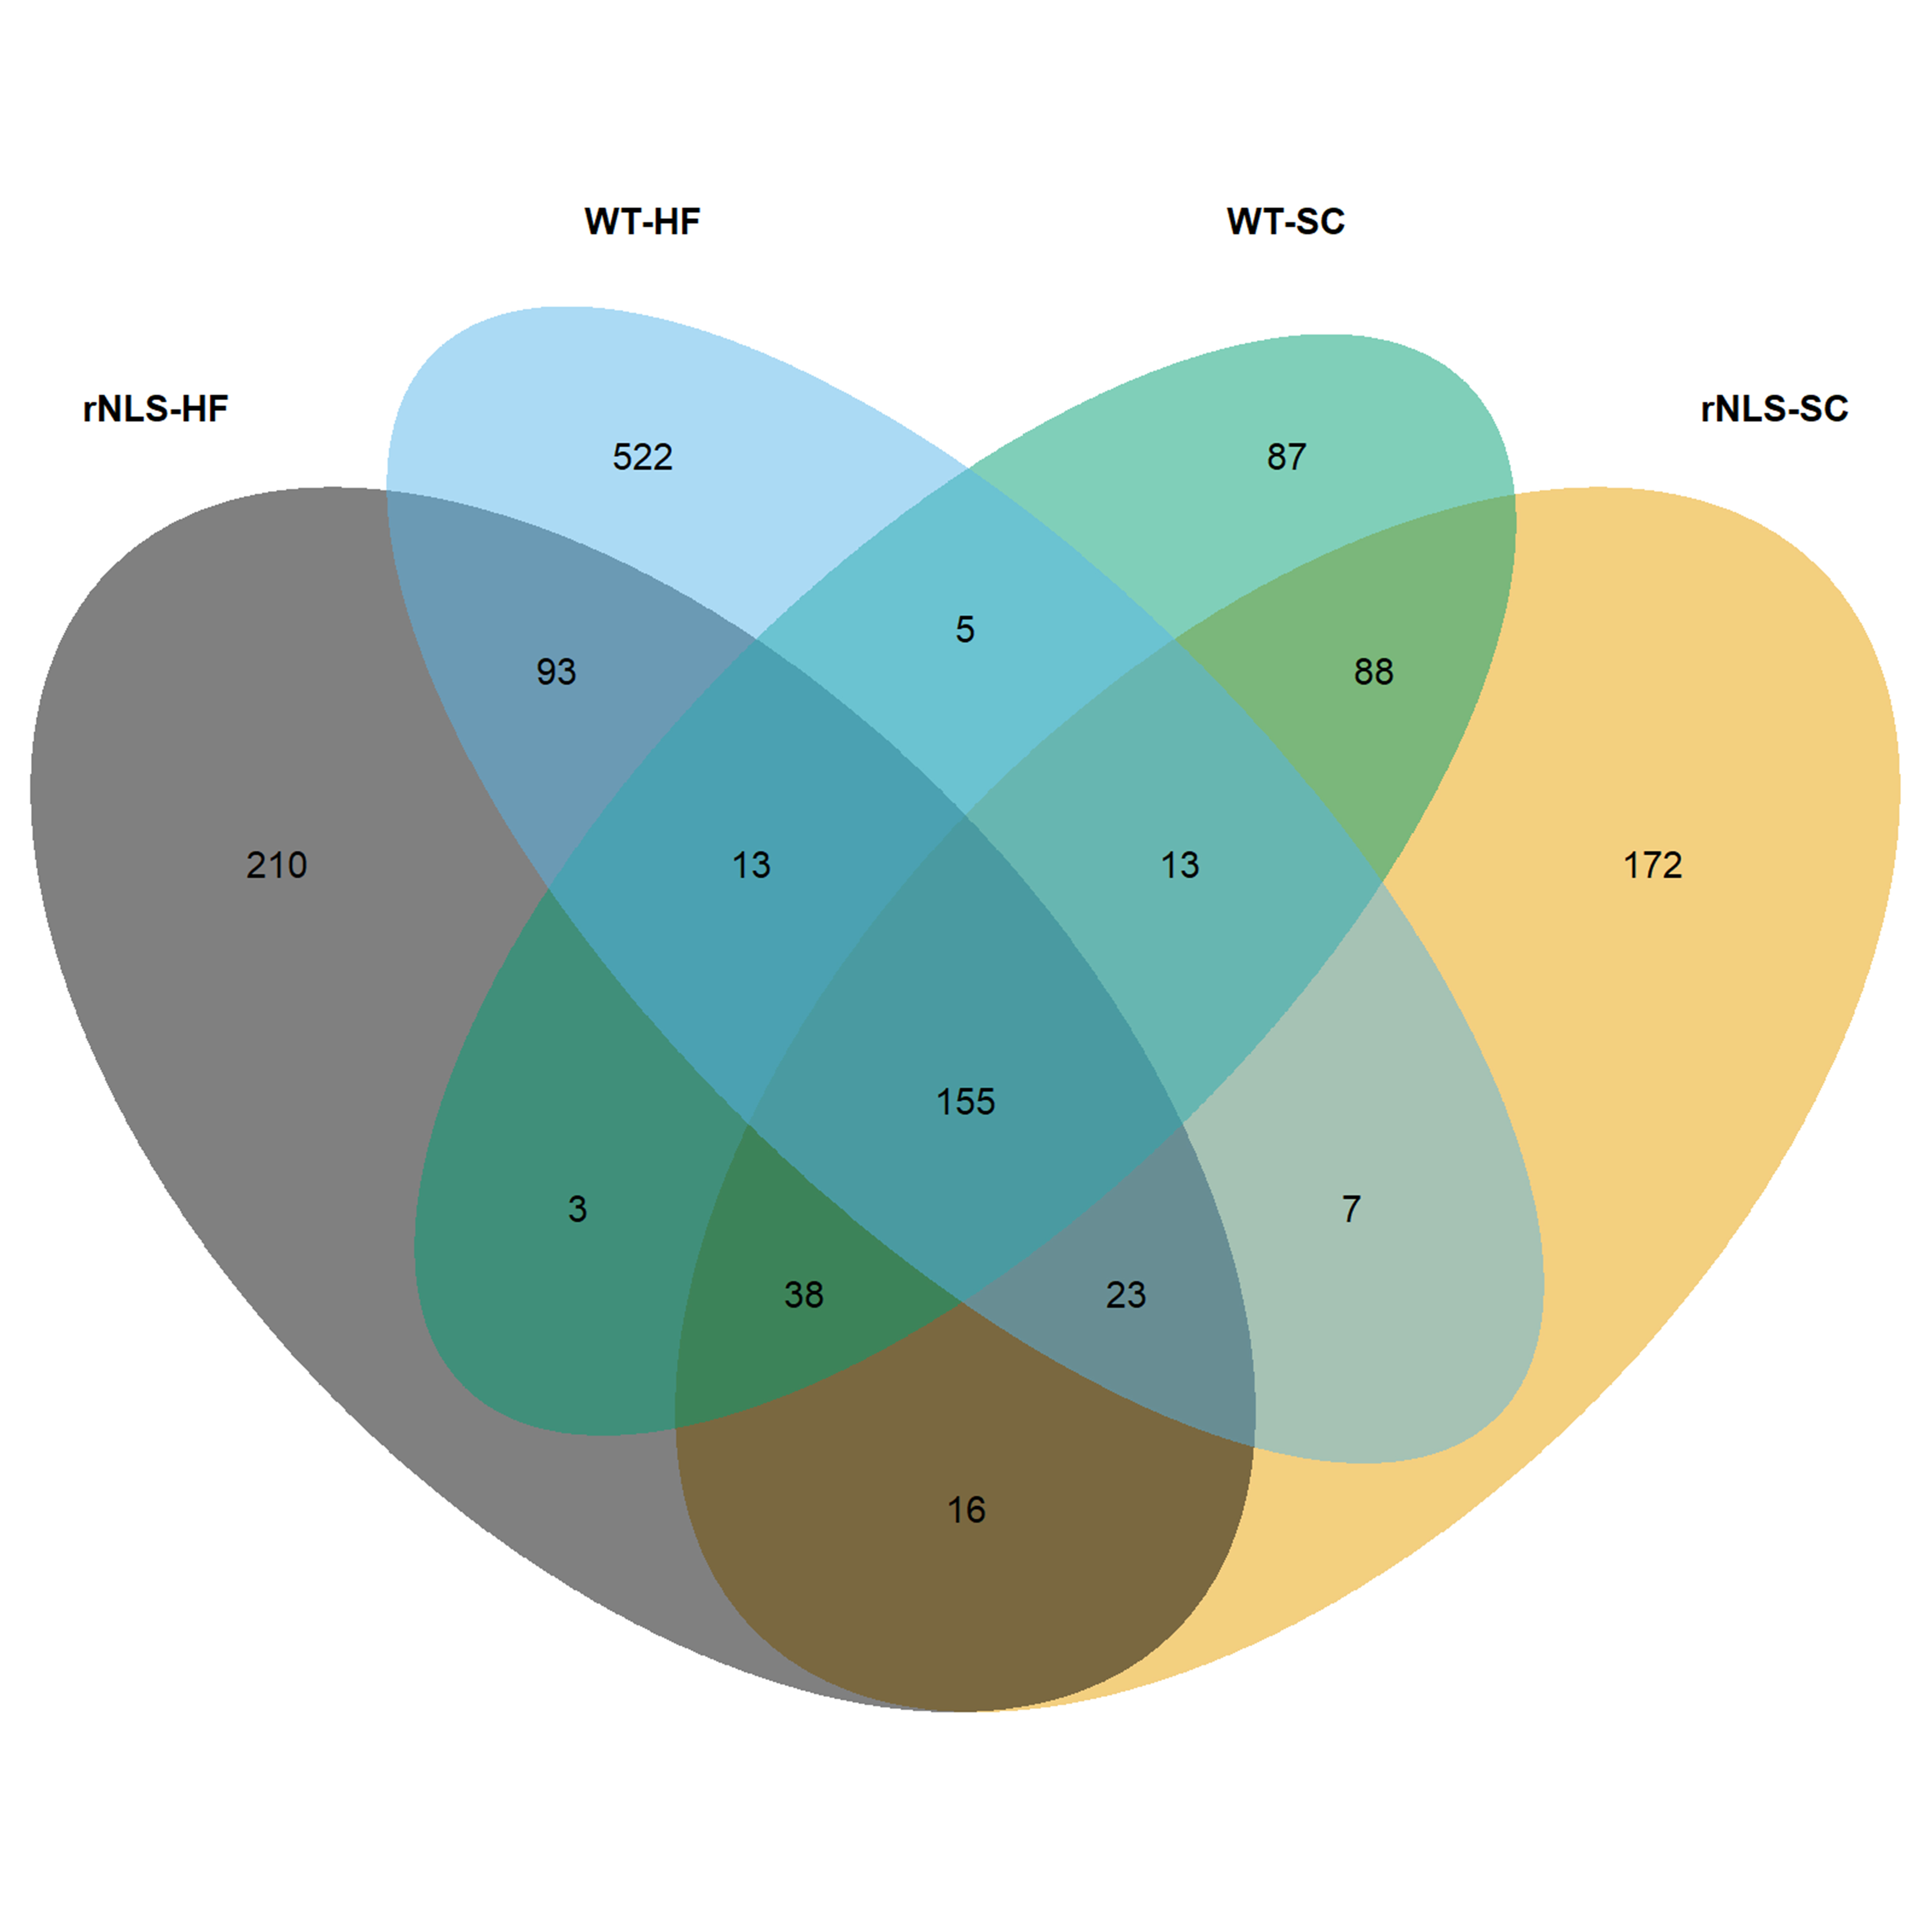
Alpha diversity indexes (i.e., Shannon, Gini-Simpson) showed a higher diversity in WT controls compared to rNLS mice (p < 0.01). Differences in alpha diversity were also found in response to the nutritional intervention, showing a higher diversity (Gini-Simpson) and evenness (Pielou) in those groups exposed to SC diet (p < 0.05). The Venn diagram showed a common number of 155 ASVs among the four groups, relatively higher than the number of unique ASVs determined in SC diet of WT mice (Suppl. Figure 6). On the other hand, mice exposed to HF exhibited a greater number of unique ASVs (522 and 210 for WT controls and rNLS mice, respectively).
Community composition (Fig. 10A-B) significantly differed both between genotypes (rNLS vs. WT) and in response to the nutritional intervention (HF vs. SC). This was clearly observed when looking at the PCoA based on the Bray-Curtis distance. The first two axes of PCoA explained 46.3% variation. Mice exposed to HF diet shifted to the right side of the graph (positive values of Axis.1, Fig. 10B) and those exposed to SC diet aligned to negative values of Axis.1. The vertical component of the PCoA (Axis.2) was weighed significantly lower than the horizontal component (13.9% vs. 32.4%). It broadly separated rNLS mice, on the positive values of Axis.2, vs. WT controls, on the negative values of the vertical axis. A similar trend was observed in the taxonomic profile at the genus level within the groups (Fig. 10A). For mice exposed to SC diet, the dominant genera were similar regardless the genotype. Such profiles differed when compared to those observed in mice exposed to HF diet. The pairwise comparisons showed significant differences in the relative abundance of genera in response to the nutritional intervention. For mice exposed to SC diet, higher relative abundances were found in the genera Bacteroides (p = 0.020), A2 (p = 0.027), Lachnospiraceae (p = 0.001) and Prevotellaceae (p = 0.001). However, for mice exposed to HF diet, higher relative abundances were observed for Akkermansia (p = 0.027), Blautia (p = 0.001), Colidextribacter (p = 0.024), Faecalibaculum (p = 0.007) and Lachnoclostridium (p = 0.002) genera. Finally, when mice exposed to the same diet were compared, the SC diet (n = 11) only showed significant differences in the relative abundance of the Colidextribacter genus (higher in WT mice; p = 0.005). On the contrary, mice exposed to the HF diet (n = 14) showed significant differences in the relative abundances of bacterial genera. In rNLS mice, a higher abundance of Romboutsia (p = 0.002), Parabacteroides (p = 0.001) and Alloprevotella (p = 0.034) genera were observed. HF diet applied in WT controls showed a higher abundance in A2 (p = 0.04) and Roseburia (p = 0.037) genera. Overall, these results indicate that diet had a significant impact on the gut microbiome shifts, and within the same diet (i.e., HF), between the different types of mice exposed.