2.1. Animals
Mice were placed in a temperature/humidity-controlled environment (24 ± 2°C/40%) and were maintained on a 12 h light/12 h dark cycle (8 a.m. and 8 p.m.) with free access to food and water. C57BL/6 mice were purchased from the Changsheng Biological Corporation (Changchun, China) and randomly divided into two groups: a cold exposure group and a room temperature control group. The cold exposure group was exposed to a stimulation temperature of 4℃ and humidity of 40% for 3 h per day for 3 weeks. All groups in one experiment contained individuals of the same strain and sex. C57BL/6 mice were used for long-term experiments. Sirt2 knockout mice were generated on a C57BL/6 background. All experimental procedures were approved by the Management Committee of Laboratory Animal Center of Heilongjiang Bayi Agricultural University.
2.2. Adeno-associated virus 9 (AAV9)-mediated gene expression
The AAV9 delivery system was used for liver-specific overexpression of Sirt2 in mice. The open reading frame encoding these genes, without stop codons, was cloned into the AAV9 vector AAV-pTBG-Luciferase. Each mouse was injected with 100 µl of AAV9 virus solution containing the target gene via tail vein at a titer of 1.4 × 10¹² vg/mL. Target gene expression was monitored by bioluminescence imaging (BLI) after 3 weeks.
2.3. Cell culture and treatment
Mouse AML-12 hepatocytes were cultured in DMEM/F12 medium supplemented with 10% fetal bovine serum (FBS), 40 ng/mL Dexamethasone, and ITS liquid media supplement. HEK293T cells were cultured in DMEM supplemented with 10% FBS and antibiotics at 37°C and 5% CO2 in a humidified incubator. AML12 cells were treated for 12 h with 300 µM CoCl2 (Sigma-Aldrich, St. Louis, MO, USA; C8661).
2.4. Histopathological analysis
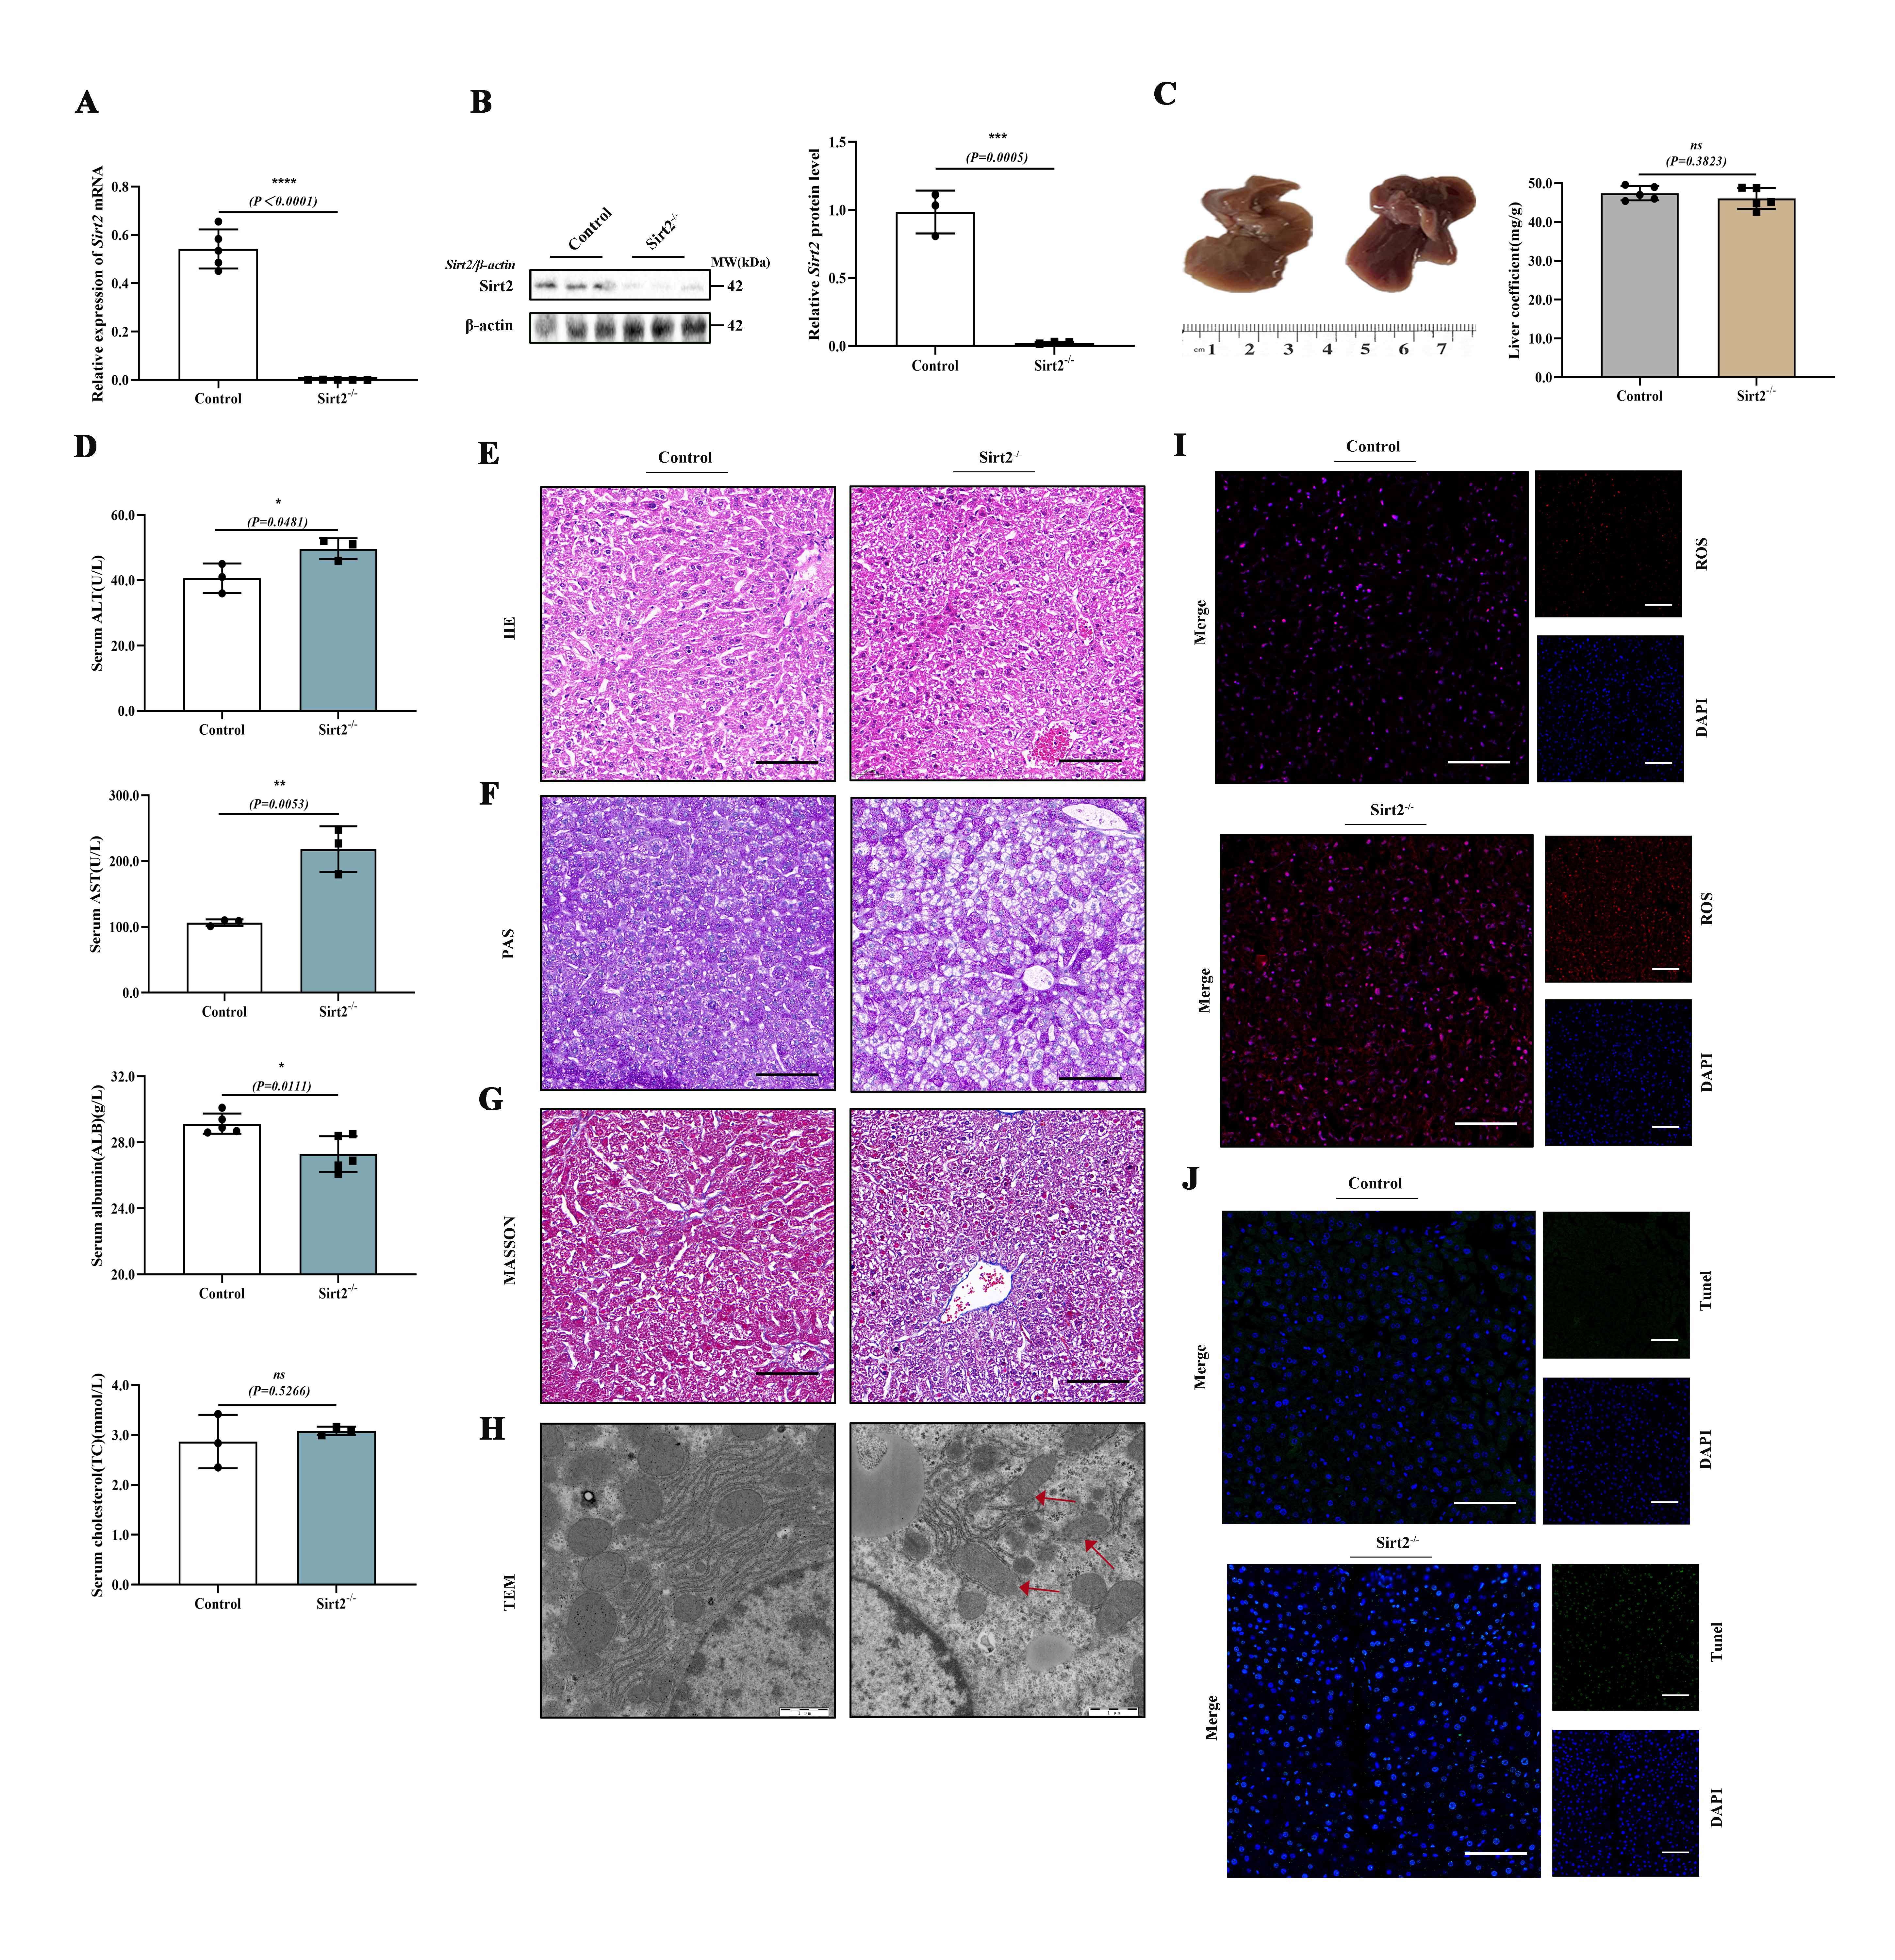
Oil Red O, hematoxylin and eosin (H&E), and Masson staining were performed on serial sections (5 µm thick) of liver tissue specimens. The sections were observed under an optical microscope.
2.5. Immunofluorescence (IF) staining
For immunofluorescence staining, cells were grown on microscope cover glasses and treated as indicated. After treatment, the cells were fixed with 4% paraformaldehyde, blocked with 0.2% Triton X-100 for 15 min and incubated with antibodies against Sirt2 (Proteintech, Rosemont, IL, USA; 19655-1-AP) and PKM2 (Cell Signaling Technology, Danvers, MA, USA; 4053) overnight for approximately 12 h at 4°C. The cells were then washed with phosphate-buffered saline (PBS) (Beyotime, Beijing, China; C0221A) and incubated with fluorescently labeled secondary antibodies for 1 h at room temperature; 4ʹ,6-diamidino-2-phenylindole (DAPI) (Beyotime; C1005) was used to stain nuclei. Sections were observed under a confocal microscope (Nikon, Tokyo, Japan).
2.6. Immunohistochemistry (IHC) staining
Sections were stained with PKM2 (1:200) primary antibody (Rabbit) followed by HRP antibody (Rabbit). A DAB Plus Substrate (Sigma-Aldrich) with added DAB Plus Chromogen was employed to visualize staining.
2.7. Serology and glucose and insulin tolerance tests
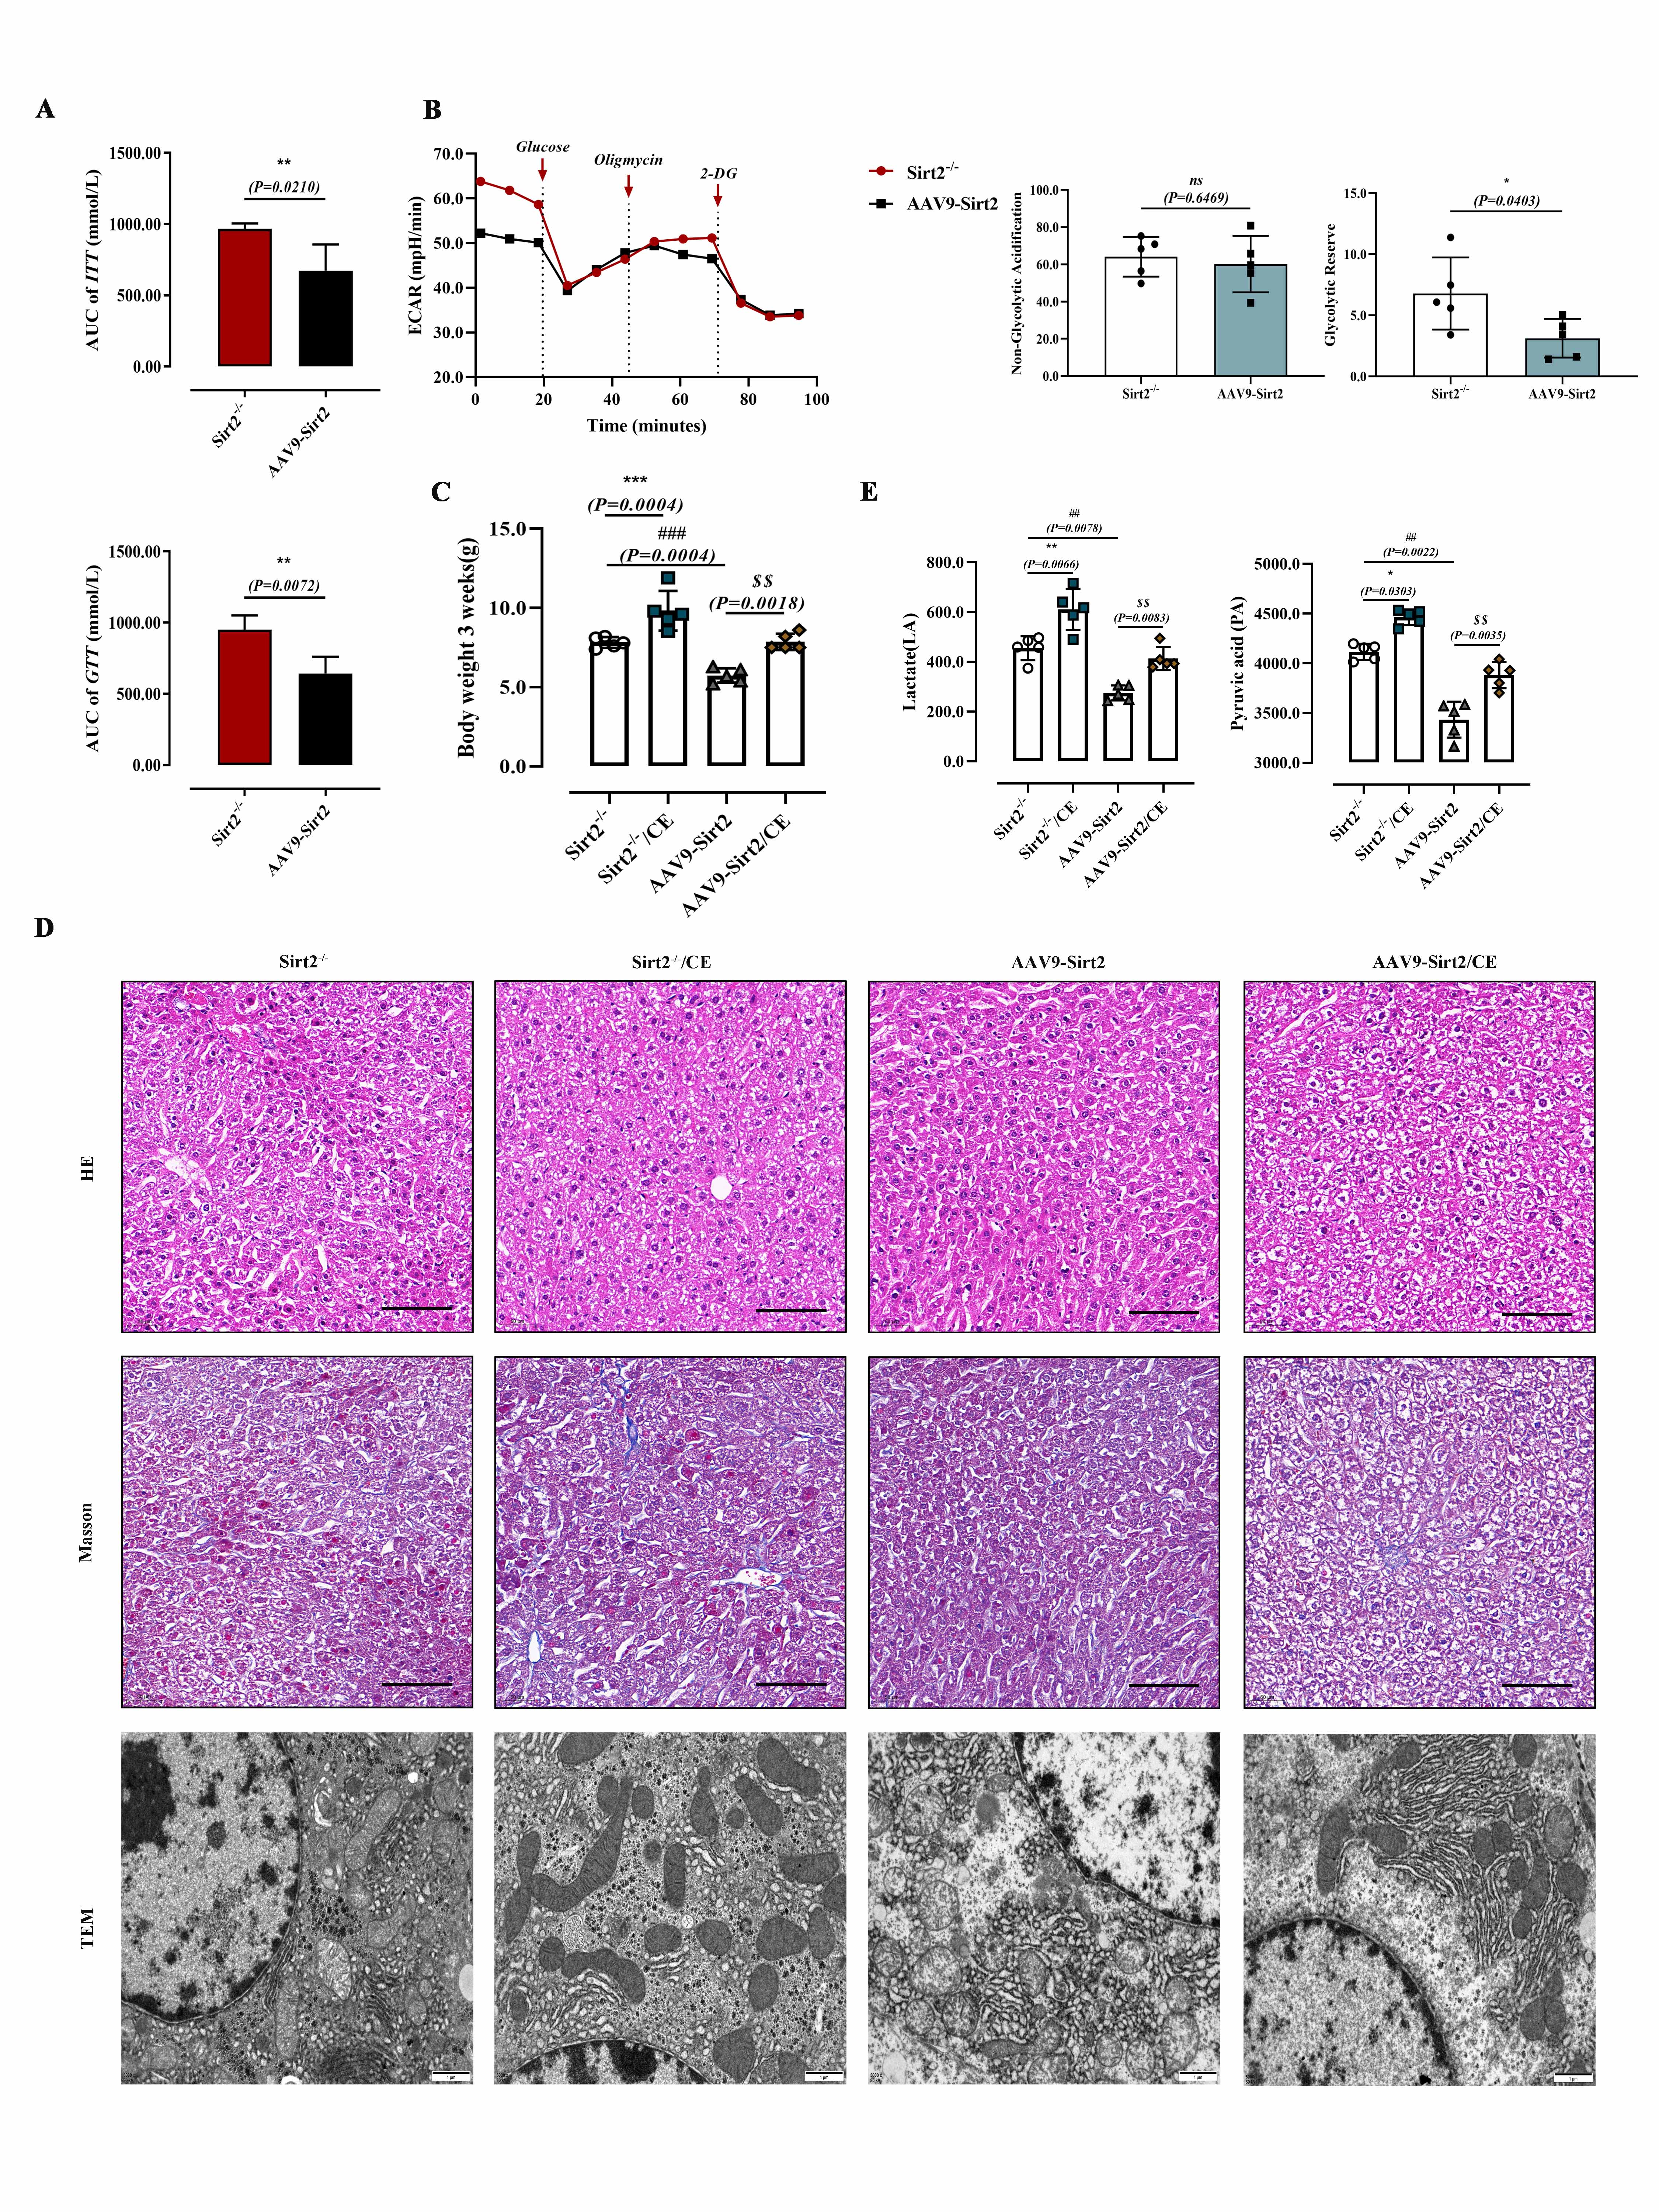
Serum levels of ALT, AST, and TG were measured using a veterinary automatic biochemical analyzer (Seamaty, SMT-120VP). Mice were individually caged for 3 days before experiments. Mice were fasted for 16 h (from 5 p.m. to 9 a.m.) and blood glucose was measured through the tail vein using an automatic glucometer (Yicheng, city, country; JSP-6). Then, glucose was intraperitoneally injected at 1 g/kg body weight, and blood glucose levels were measured at various time points. For the ITT, mice were treated as in the GTT, except they were intraperitoneally injected with a single dose of insulin (1 U/kg). The mice used for the GTT and ITT assays were from different groups to prevent stress interference from earlier blood collection.
2.8. Quantitative real-time PCR
Total RNA was isolated with TRIzol reagent (Invitrogen, Carlsbad, CA, USA). Purified RNA was retro-transcribed using the RT Kit (Takara, RR047A) and quantitative real-time PCR experiments were performed. All reactions were repeatedly processed.
Primers used for quantitative real-time PCR were (5´-3´): mouse β-actin, GATGGCCACTGCCGCATCCTC and GGTCTTTACGGATGTCAACGTCAC; Sirt2, CTCATCAGCAAGGCACCACTAGC and CATCCGAGGAGGTCAGCGAGAG; and PKM2, AAGTTTACACGAAGGTCGACAT and TATCATTGCCGTGACTCGAAAT.
2.9. Western blot analysis
Western blot analysis was performed as described previously[62]. Total protein (30 µg) was immunoblotted with rabbit anti-Sirt2 (Proteintech, 19655-1-AP, 1:1,000), rabbit anti-PKM2 (Proteintech, 19655-1-AP, 1:1,000; Cell Signaling Technology, 4053, 1:1,000), rabbit anti-ATP5a1, rabbit anti-UQCRC2, rabbit anti-SDHB, rabbit anti-NDUFB8, and mouse anti-actin (Proteintech, 66009-1-Ig, 1:10,000) followed by corresponding secondary antibodies conjugated to horseradish peroxidase (HRP) for 1 h [HRP-conjugated Affinipure goat anti-mouse IgG (H + L) (Proteintech, SA00001-1, 1:8,000) and HRP-conjugated Affinipure goat anti-mouse IgG(H + L) (Proteintech, SA00001-1, 1:8,000)].
2.10. Seahorse bioenergetics
Primary mouse hepatocytes were isolated and cultured in Seahorse XF24 Extracellular Flux Analyser (Agilent Technologies, Santa Clara, CA, USA) culture plates with 2 × 10⁴ cells per well. Plates were incubated for 1 h at 37°C in an incubator without CO2 according to the instructions of the XFp Cell Mito Stress Test Kit (103015-100; source and address) and a XFp Glycolysis Stress Test Kit (103020-100; source and address). Oxygen consumption (OCR) and extracellular acidification rate (ECAR) were measured as instructed. Data were assessed with XFe Wave Software. Liver blocks with a diameter of 3 mm were cut off and placed in tissue culture trays. OCR and ECAR were measured as instructed.
For liver tissue, inoculation was measured at the same weight on hippocampal tissue culture plates, and real-time mitochondrial respiration was measured on the hippocampal XFe24 analyzer using the Mitochondrial Stress Assay Kit.
2.11. RNA sequencing
RNA sequencing was performed by Biomarker (Beijing, China). Briefly, RNA from liver tissue (20 mg) was extracted and quantified using a NanoDrop (ThermoFisher Scientific, Waltham, MA, USA) and used to construct RNA libraries that were sequenced using Illumina NovaSeqTM 6000 by Biomarker (Beijing, China).
2.12. Targeted metabolomics
Liver tissue (100 mg) was weighed, 1 mL of pre-cooled methanol/acetonitrile/water was added, and the samples were left by ultrasound in an ice bath then centrifuged at 16,000 × g at 4℃ for 30 min. The supernatant was removed. The same amount of internal standard L-glutamate-D5 was added to each sample and vacuum dried. During mass spectrometry detection, 100 µL of acetonitrile-water solution was added for resolution, and the samples were centrifuged at 16,000 × g at 4℃ for 30 min and the supernatant removed for sample analysis. Separation was performed by Shimadzu Nexera X2 LC-30AD high performance liquid chromatography. Mass spectrometry was performed using a QTRAP5500 Mass Spectrometer (AB SCIEX, Redwood City, CA, USA) in positive/negative ion mode. The peak area and retention time were extracted by MultiQuant software. A metabolite standard was used to adjust retention time and identify metabolites. The peak area of metabolite extracted ions was normalized by the internal standard L-glutamate_D5. Encyclopedia of Genes and Genomes (KEGG) pathway enrichment analysis were applied for the differentially expressed related genes.
2.13. Coimmunoprecipitation (Co-IP)
Co-IP were performed as described by Song. Briefly, liver tissues and cells were lysed in IP-lysis buffer [50 mM Tris (pH 7.4), 150 mM NaCl, 0.1 mM EDTA, 20% glycerol, 0.2% NP-40, 0.1% SDS, protease and phosphatase inhibitors]. After freezing and centrifugation at high speed, the lysate supernatants were incubated with the indicated antibodies at 4℃. The pre-cleared protein A/G beads (Thermo Fisher Scientific; 88803) were then incubated with the supernatant at room temperature for 1.5 h. The collected proteins were analyzed by western blotting.
2.14. Metabolic measurements
Mice were housed in metabolic cages individually with access to food and water in metabolic chambers of the Comprehensive Laboratory Animal Monitoring System to monitor global metabolism (CLAMS™, Columbus Instruments, Columbus, OH, USA). After acclimation for 24 h, energy expenditure was measured for 24 h. Metabolic parameters including carbon dioxide production (VCO2), oxygen consumption (VO2), respiratory exchange ratio (RER = VCO2/VO2), and heat production (heat) were recorded every 12 min over a period of 24 h and determined using an Oxymax system (Columbus Instruments).
2.15. Oxidative stress detection in vivo
ROS generation was detected by dihydroethidium (DHE) staining. Briefly, frozen liver sections were incubated with DHE (5 µmol/L) at 37°C for 30 min in a dark chamber. Fluorescent images were observed with a fluorescence microscope (Olympus IX53; Olympus, Tokyo, Japan).
2.16. TdT-mediated dUTP nick end-labelling (TUNEL) staining
Liver sections (10 µm) were fixed with 4% paraformaldehyde for 45 min at room temperature and TUNEL staining was measured using a kit (Beyotime) according to the manufacturer's instructions. Images were acquired using a confocal microscope (FV3000; Olympus).
2.17. Cycloheximide and MG132 assays
CHX or MG132 was added to the culture medium at a final concentration of 10 µM or 20 mM, respectively. Cell lysates were collected at 0, 1, and 4 h after CHX or 4 h after MG132 treatment.
2.18. Yeast two hybrid
Using the SIRT2 gene constructed on the pGBKT7 vector as bait, a yeast two hybrid mouse library was screened. After multiple reporter gene detection, DNA sequencing, and BLAST comparison analysis of positive clones, the proteins that interact with pGBKT7 SIRT2 were identified. Amplify positive clones from yeast cells for DNA sequencing and perform BLAST alignment analysis with sequences from the GenBank database. Identify positive cloned genes screened from SD-TLH + 5 mM 3AT plates. Dilute the positive clone transformants with sterile water and point them to SD-TL, SD-TLH + 5 mM 3AT, SD-TLHA + 5 mM 3AT, and SD-TLHA + 5 mM 3AT + X, respectively-α- Gal defect plate, incubated at 30 ℃ for 3–4 days.
2.19. Detection of enzyme activity and content
Enzyme activity was detected using a Lacate Dehydrogenase Activity Assay Kit or a Pyruvate kinase Assay Kit (Solarbio Science and Technology, Beijing, China), following the manufacturer’s instruction. According to the ratio of the number of cells to the volume of the extracted liquid is 500 ~ 1000:1, ultrasonic crushing, standing for 30min, 8000g, centrifugation at room temperature for 10min, and the supernatant is taken and tested according to the instructions; According to the ratio of liver tissue mass to the volume of extracted fluid is 1:5 ~ 10, the homogenize in an ice bath, stand for 30min, 8000g, centrifuge at room temperature for 10min, and take the supernatant for testing. For detection of pyruvate content and lactate content, the content was detected using a Pyruvate Content Assay Kit or a Lactic Acid Content Assay Kit (Solarbio Science and Technology, Beijing, China), following the manufacturer’s instruction.
2.20. Statistics
Statistical analyses were performed using GraphPad Prism 8.0 software (Chicago, IL, USA). Data are expressed as mean ± SD. Except where indicated, statistical significance was analyzed using two-tailed Student’s t-test and differences were considered statistically significant at P < 0.05.