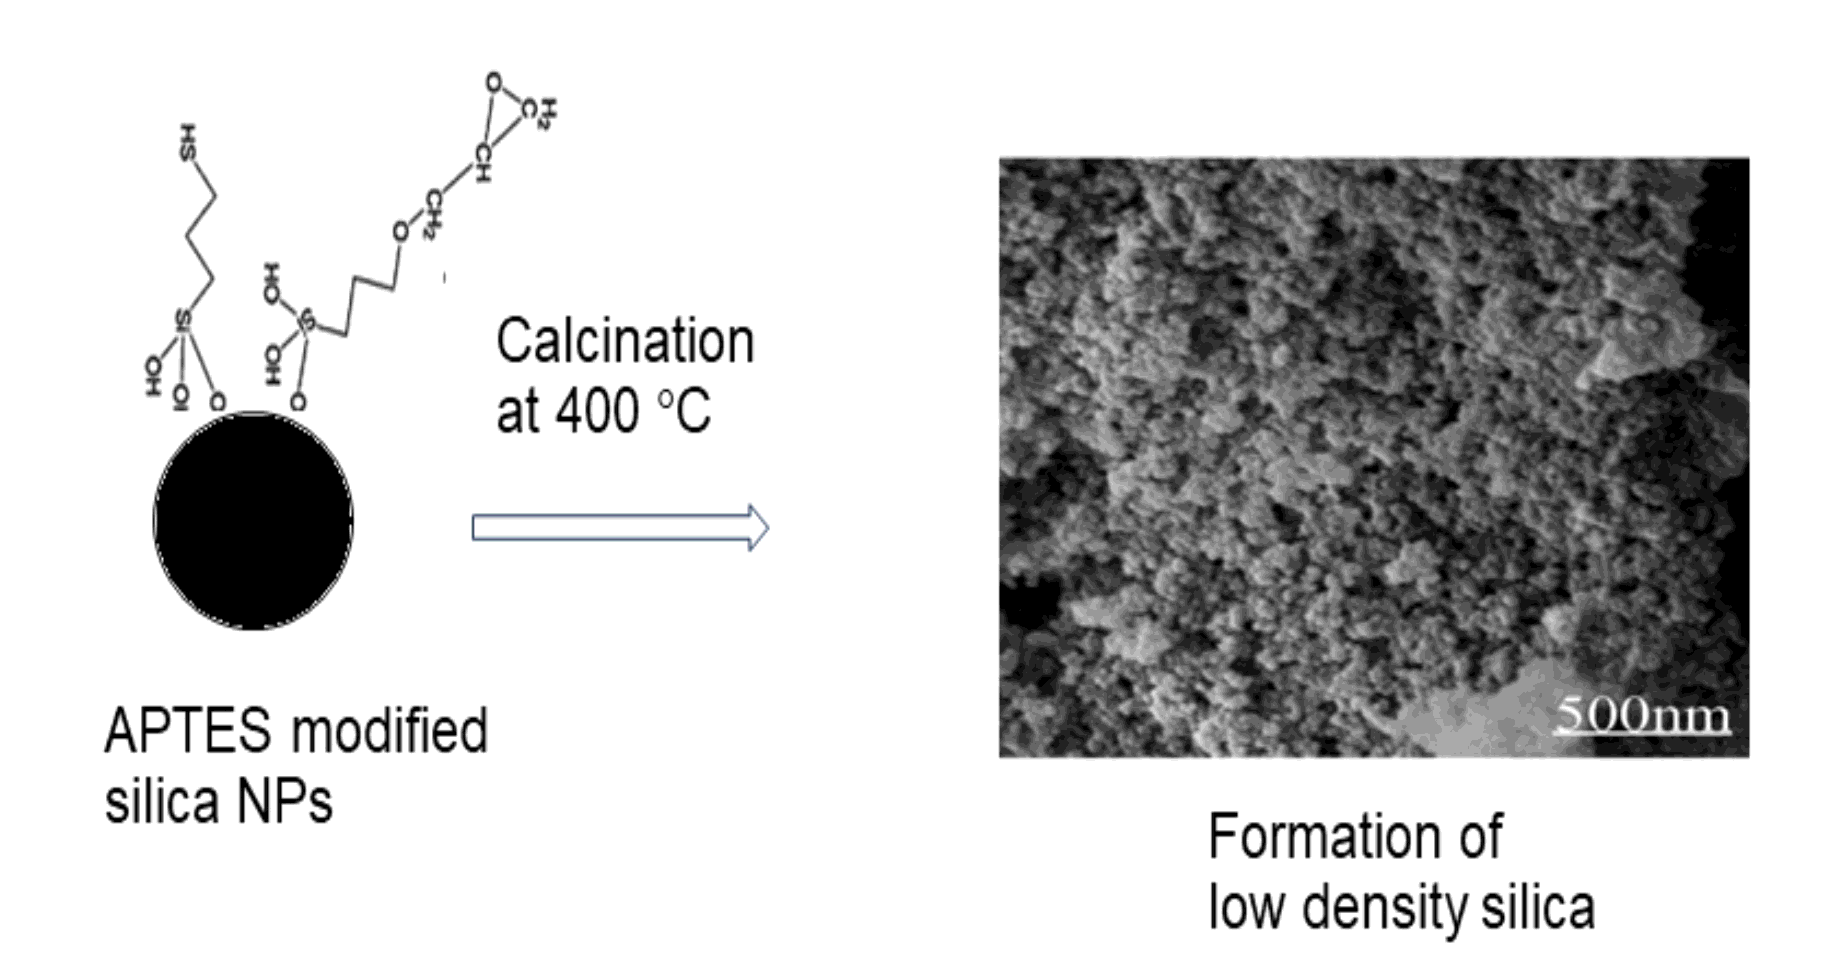
In this report, we describe the characterization and adsorption properties of functionalized silica nanoparticles containing vitamin B2 and horseradish peroxide enzyme. Silica nanoparticles are particularly appealing due to their biocompatibility, ease of manufacture, and low aggregation. The wet chemical method was utilized to easily change the surface of the silica layer. In this study, organosilane-modified silica nanoparticles were produced using a modified Stober process and then calcined to generate the mesoporous structures. Figure 1 displays the findings of a research of functionalized particles in terms of their morphology, structure, and properties. The DLS, SEM, and zeta potential measurements all confirmed that the particle size varied according to the aminopropyl triethoxy siliane (APTES). After calcination, plain silica nanoparticles have a zeta potential of around 39 mV. The values of APTES modified silica nanoparticles varied based on APTES concentrations, with the maximum concentration (3.576 M) revealing a value of -10 mV and the lowest concentration (0.298 M) revealing a value of -26 mV. During calcination, the produced particles immediately lose weight due to the removal of water molecules adsorbed on the silica surface, followed by APTES degradation and -C-Si bond breaking. As a result, the density of the nanoparticles varied significantly when compared to typical silica. The APTES network generates a cage-like structure in the outer silica layer, regulating the production and density of silica nanoparticles. The density of control silica nanoparticles after calcination was around 1.986g/cm3, but the density of APTES modified silica nanoparticles was dramatically lowered to 0.979 g/cm3 due to 3.56 M of APTES, and the particles' shape is very porous, as shown in Figure 2a. The amine functional groups were measured using the ninhydrin test, revealing a maximum of 1.81´1011 NH2 functional group/particles. Calcination caused amine groups to decompose, as evidenced by a reduction in the NH2 group to 1.23x 10⁴/particle. Surface characterizations were explored using FTIR spectra, with a strong and stretching peak at 1080 cm-1 suggesting that the Si-O-Si derives from silica, and three characteristic peaks at 462, 799, and 805 cm-1 indicating that the SiO2 arises from vibrational modes. Peaks at 3439-3450 correspond to OH stretching and bending vibrations, while peaks at 1633-1637 cm-1 correspond to the amine group. The intensity of the Si-OH absorption band reduced following calcination, according to the findings. These findings suggested that the condensation process in the sol-gel method was improved, resulting in the creation of Si-O-Si functional groups, as depicted in figure 2b.After calcination, the nanoparticles showed absorbance maxima between 420 and 480 nm. The peak intensity and refractive index parameters were adjusted based on the APTES concentration. The peak shift was driven by defect states produced by surface oxidation of Si-O-Si and amine group functionalization of silica nanoparticles. The peak was quite broad, and emission mechanisms can be ruled out due to their massive size and quantum confinement effects. The maximum emission was seen at lower APTES concentrations (0.298 M), as indicated in Figure 2c. The refractive index studies demonstrated that the values decreased and the band gap energy changed following calcination. The photodegradation study was conducted using crystal violet dye at various time intervals. The nanoparticles may serve as a catalyst by accepting electrons, allowing for a powerful oxidizing electron hole and the subsequent transfer of trapped electrons to the absorbed O2. As a result, more molecules are adsorbed on nanoparticle surfaces, enhancing both photoexcited electron transport to the conduction band and electron transfer to the adsorbed O2. The kinetics were presented in Figure 3. According to this, during UV irradiation, the maximum concentration of crystal violet dye was 9 mg/ml, while without UV irradiation, the maximum concentration of nanoparticles was 5 mg/ml. UV irradiation destroyed up to 90% of the dye. The degradation research uses a pseudo-first-order reaction. Table 1 is a summary of the values. The rate constant (k) was estimated by taking the starting concentration of crystal violet solution (Co) and the concentration of crystal violet at time t (Ct). The slope of the ln Co/Ct Vs time figure indicates the rate constant k in minutes (lnCo/Ct = kt). The k values obtained through linear fitting from Table 1 were 0.025 with UV irradiation and 0.01192 without UV irradiation. The activity of the particle's adsorbed enzymes was tested using o-phenylenediamine as a substrate for 70 days, and the stability results are presented in Figure 4a. It was clearly demonstrated that HRP-absorbed LDS particles are very stable and had higher activity than free HRP enzyme, as illustrated in 4b. The kinetics plot for HRP absorbed LDS was created using the Michaelis-Mentan equation, which is (Km/Vmax) 1/[S] + 1/Vmax = 1/v. Lineweaver-Burk plots (1/v.1/[S]) were used to derive the Michaelis-Menten constant Km and the maximum rate Vmax, while Kcat was calculated as Vmax= Kcat [E0], where [E0] is the initial concentration of the enzyme entrapped on the nanoparticle surface. The Kcat value represents enzyme activity by reflecting the maximum number of substrate molecules that can be converted into product by one enzyme molecule in a given amount of time, as shown in table 1. The influence of solution pH on the immobilized enzyme-catalyzed reaction was studied in the pH range of 3 to 9, with no other experimental conditions altered. The assay findings revealed that the maximum intensity was recorded at pH 7. As a result, the pH of the reaction solution was adjusted to 7. We optimized the catalytic reaction time by conducting the assay at various reaction periods (ranging from 5 to 30 minutes) while leaving the other experimental parameters constant. Based on these findings, the reaction time was set to 20 minutes (Figure 4c). Figure 4d depicts the findings of an investigation into the impact of o-phenylenediamine concentrations on the assay. Increasing the concentration of o-phenylenediamine from 2.5 x10⁻³ to 3.0 x10⁻²mol L-1 boosted the intensity of the assay system. The assay findings showed a plateau exceeding 3 x10⁻²mol L-1. The optimal concentration of o-phenylenediamine was determined to be 3 x10⁻² mol L-1. HRP enzyme linked nanoparticles served as a calorimetric enzyme probe for detecting H2O2 in the presence of o-phenyl diamine as a substrate. The results showed that nanoparticles had a low detection limit of up to 10-10 mol L-1 of H2O2, comparable to 5 nmol, and the H2O2 concentrations had a linear range from 5x10⁻¹⁰ ~ 1x10⁻⁵(M) (R2=0.995), as shown in Figure 5. The milk sample was spiked with H2O2 for real-world examination, and the results were measured. For the tests, 1, 50, and 100 nmol of H2O2 were produced and spiked with 1 mL of sterile milk samples, and the recovery rate was measured using colorimetric assays. The average absorption values (O.D) for the H2O2 solution were 0.183 ± 0.08, 0.457 ± 0.02 and 0.501 ± 0.07. The spiked milk samples yielded levels of 0.183 ± 0.04, 0.454 ± 0.09, and 0.505 ± 0.01.