Two forms of orthorhombic Nb2O5 (T-Nb2O5) were synthesized utilizing the previously reported method.22, 32 As shown in Fig. 1a, F-Nb2O5/CP was derived from the calcination of orthorhombic Nb3O7F precursor on carbon fiber under argon conditions. T-Nb2O5 nanoparticles on carbon fiber (Nb2O5/CP) were synthesized using the same method without HF for comparison. X-ray diffraction spectroscopy (XRD) results (Fig. 1b) show that the diffraction peaks of F-Nb2O5 can be indexed to the orthorhombic Nb2O5 phase (PDF 00-030-0873). In comparison, the diffraction peaks of Nb2O5 (Supplementary Fig. 1a) were indexed to the orthorhombic Nb2O5 phase (PDF 00-027-1003). F-doping slightly shifted the diffraction peaks to lower angles, resulting in the expansion of the crystal lattice. The scanning electron microscopy (SEM) images indicate the well-maintained nanosheet morphologies of F-Nb2O5/CP (Fig. 1c, d) after heat treatment of the Nb3O7F/CP precursor (Supplementary Fig. 1e, f), with the length of rectangular sheets ranging from 400 to 900 nm and a thickness of around 50 nm. The rectangular sheet structure (Fig. 1e) was further confirmed by transmission electron microscopy (TEM). The high-resolution TEM image (Fig. 1f) shows two groups of lattice fringes with spacings of 0.395 nm and 0.365 nm, in good agreement with the spacings of the (001) and (080) planes of Nb2O5, respectively, indicating that these nanoflakes are mostly exposed with the (100) facet.22 The high-angle annular dark-field scanning transmission electron microscopy (HAADF-STEM) image and Energy dispersive spectroscopy (EDS) elemental mapping results shown in Fig. 1g demonstrate the uniform distribution of Nb, O, and F elements.
The orthorhombic phase and the doped F element of Nb2O5 were further confirmed by Raman and X-ray photoelectron spectroscopy (XPS) analysis. Figure 2a depicts the Raman spectrum of F-Nb2O5 with the typical Nb–F vibrational band at 132 cm− 1. The bands at 230 cm− 1, 304 cm− 1, and 690 cm− 1 are attributed to the Nb − O bond stretching vibration, confirming the orthorhombic phase of Nb2O5 with F doping.22,23,33 The band at 994 cm− 1 was attributed to the peak of the short Nb-O bond, which could enhance the performance of methanol oxidation.34 In contrast, Fig. 2b exhibits a relatively weak vibrational band at 126 cm− 1, indicating the absence of F doping. The bands at 228 cm− 1, 309 cm− 1, and 689 cm− 1 also confirm the orthorhombic phase of Nb2O5.35,36,37 The survey XPS spectrum for F-Nb2O5 demonstrates that it is composed of F 1s, O 1s, Nb 3p, Nb 3d, and Nb 4p peaks, confirming the doping of the F element (Fig. 2c). The distinct F 1s peak shown in the high-resolution F 1s XPS spectrum (Fig. 2d) at a binding energy of 685.2 eV suggests that the F ion was substituted into the lattice of F-Nb2O5. The high-resolution XPS spectrum for O 1s, shown in Fig. 2e, can be fitted into characteristic peaks with binding energies at 530.0 and 532.4 eV. The peak at 530.0 eV is attributed to the Nb − O bond, while the 532.4 eV peak arises due to the existence of loosely bonded oxygen on the surface of Nb2O5.22, 32,32, 38 In the high-resolution Nb 3d XPS spectrum (Fig. 2f), Nb atoms in Nb 3d5/2 and Nb 3d3/2 electronic configurations can be observed at 207.8 and 210.6 eV. Moreover, the two small binding energy peaks appearing around 206.5 and 209.2 eV are ascribed to the Nb–F bond.22, 33 XPS analysis of Nb2O5/CP were detailed in Supplementary Fig. 2, which notably demonstrates the absence of the fluorine element. The aforementioned results substantiate the successful fabrication of F-Nb2O5/CP, with the (100) facet exposed.
We evaluated the electrocatalytic synthesis of formamide from the co-oxidation of methanol and NH3 using a two-compartment cell separated by a Nafion117 membrane. The three-electrode system was composed of F-Nb2O5/CP or Nb2O5/CP as the working electrode, Hg/HgO as the reference electrode, and a Pt plate as the counter electrode. All potentials are reported versus the Hg/HgO scale unless otherwise noted. All subsequent tests were based on the optimized methanol-to-ammonia ratio, which is a molar ratio of 8:1 (Supplementary Fig. 3). The activity of electrocatalytic formamide synthesis was evaluated by linear sweep voltammetry (LSV) in 0.5 M KHCO3. As shown in Fig. 3a, the current density slightly increased in the presence of 20 mM methanol from the onset potential of 1.2 V, then decreased compared to the LSV curve of 0.5 M KHCO3. This suggests that electrochemical methanol oxidation and water oxidation are competitive reactions on the surface of F-Nb2O5/CP. Interestingly, the LSV curve exhibits a sharply increased current density and a low onset potential with the presence of 2.5 mM NH3 and methanol in the electrolyte, indicating the co-oxidation behavior of methanol and NH3. Similar trends of competitive reactions, onset potential, and oxidation current density were observed with the Nb2O5/CP catalyst, as shown in Supplementary Fig. 4a. Based on the results above, a potential window ranging from 1.2 to 1.9 V was selected for the study of electrocatalytic formamide synthesis. The steady current densities observed in the chronoamperometry curves at different applied potentials (Supplementary Fig. 5) indicate the robust electrochemical oxidation stability of F-Nb2O5/CP during the electrocatalytic synthesis tests of formamide.
High-performance liquid chromatography (HPLC) was used for qualitative and quantitative analysis of the electrochemically produced formamide (Supplementary Fig. 6a, b), which was further cross-verified by gas chromatography − mass spectrometry (GC − MS) and 1H-nuclear magnetic resonance (1H NMR, Supplementary Fig. 7). UV − Vis and Ion Chromatography (IC) were employed for the detection of byproducts such as H2O2 (Supplementary Fig. 6c, d), HCOO−, NO2−, and NO3−. The Faradaic efficiency, product distribution, and yield of formamide show a volcano-like trend (Fig. 3b) as the applied potential increases from 1.2 to 1.9 V. The FEformamide on F-Nb2O5/CP achieves 52.0%, with a yield of 252 µmol cm− 2 h− 1 at − 1.5 V. Meanwhile, the selectivity of N and C, calculated from the consumption of NH3 and methanol (Supplementary Fig. 8), are 79.1% and 20.5% respectively. The FEformamide and yield on Nb2O5/CP achieve 25.6%, with a yield of 96 µmol cm− 2 h− 1 at − 1.6 V (Supplementary Fig. 4b). An isotope-labeled experiment was performed to validate the origin of the formamide products. Figure 4c displays the total ion chromatography (TIC) of formamide and 15N-labeled formamide, where the N source was NH3 and 15NH3. Correspondingly, the mass spectra of 15N-labeled formamide (m/z = 46) rise more sharply than that of the formamide, as depicted in Fig. 3d, thereby proving the N source of formamide. Moreover, no TIC signals from other organic compounds were observed, indicating that the product of the C–N coupling reaction is formamide on F-Nb2O5/CP. Control experiments were conducted to validate the reaction pathway. Initially, a significant increase in both the yield and Faraday efficiency (94%) of formamide was observed when formaldehyde was used as a substitute for the carbon source (Fig. 3e). This finding suggests that the aldehyde intermediate, derived from methanol, plays a pivotal role in the C-N coupling process. However, when NH2OH was substituted for the NH3 feedstock, there was a marked reduction in both the yield and Faraday efficiency of formamide. This indicates that NH2OH may not act as a key intermediate in the reaction. Furthermore, in a 0.5 M NaOH solution, there is a noticeable decrease in both the Faraday efficiency and yield of formamide. This can be ascribed to the competitive reaction that involves nucleophilic reagents, namely, OH− and NH3 derivatives, indicating that C-N coupling may proceed through a nucleophilic attack process. 13 The results of the long-term stability test are shown in Fig. 4f, where both the current density and FEformamide remain steady over 120 hours. The long-term stability of the F-Nb2O5/CP catalysts after the test, as confirmed by XPS (Supplementary Fig. 9), XRD, and SEM analyses (Supplementary Fig. 10), indicating the robust electrochemical oxidation stability for the anodic formamide synthesis.
Studies have indicated that the adsorption of halogen ions is potential dependence, where reactions between these ions and adsorbed species produce oxidation-resistant compounds, even at high anodic potentials.39,40 Fig. 3g displays that the FEformamide on Nb2O5/CP was effectively increasing when 10 mM of fluoride or chloride ions were added to the solution. Conversely, after the addition of 10 mM bromide or iodide ions to the solution, the FEformamide sharply decreases. Thus, it can be concluded that fluoride and chloride ions appear to facilitate the anodic amide synthesis process. To evaluate whether the performance of catalysis is influenced by the electrochemically active surface area (ECSA) of F-Nb2O5/CP and Nb2O5/CP, we conducted measurements of the double-layer capacitance (Cdl). Supplementary Fig. 11a and 11b display the cyclic voltammograms (CVs) of F-Nb2O5/CP and Nb2O5/CP at various scan rates (10–100 mV s–1), respectively. As shown in Fig. 3h, the Cdl of F-Nb2O5/CP (3.9 mF cm–2) is nearly equivalent to but marginally lower than that of Nb2O5/CP (4.3 mF cm–2). This suggests that F-Nb2O5/CP possesses a slightly smaller ECSA. Furthermore, Nb2O5/CP exhibits lower charge transfer resistance in the Nyquist plots (Fig. 3i). Hence, it can be inferred that the contribution to the C-N bond formation activity is not derived from the ECSA or the catalyst's impedance. Instead, it primarily stems from the doping of fluorine.
Given the fact that Nb2O5 nanoparticles have been identified as a promising non-noble semiconductor for surface-enhanced Raman substrates, capturing the reaction intermediates using in-situ Raman spectroscopy on F-Nb2O5/CP is of interest. As displayed in Fig. 4a, the in-situ Raman spectra of F-Nb2O5/CP were captured under operando conditions at various operating potentials. As the applied potential escalated from the open circuit potential (OCP) to 1.9 V, significant peaks centered at 1336 cm− 1 and 1580 cm− 1 emerged on F-Nb2O5/CP. These peaks correspond to the stretching vibrations of the C–N and NH2, thereby affirming the presence of the *NH2 intermediate and the formation of the C–N bond.20,41 To further reveal the changes in reaction intermediates, we performed in-situ electrochemical attenuated total reflection surface-enhanced infrared absorption spectroscopy (ATR-SEIRAS). The in-situ IR spectra signals of F-Nb2O5/CP ranged from OCP to 1.9 V (Fig. 4b). The characteristic IR peaks of the amide were successfully traced as the potential changed. The spectral features in the wavenumber region of 2900–3400 cm− 1 are identified as ν(NH2), corresponding to the amide A bands (typically found within the 3300–3500 cm− 1 range). Notably, the emergence of new bands at 1631, 1498, and 1238 cm− 1 can be observed. These bands can be respectively classified as the amide I band (generally within the 1600–1800 cm− 1 range), the amide II band (typically within the 1470–1570 cm− 1 range), and the amide III bands (usually found within 1250 to 1350 cm− 1 range)., which can be assigned to δ(NH2), ν(C = O), and ν(C − N) of adsorbed formamide.42 The key intermediate species of *CHO and *CH2O were successfully detected at 1366 and 1418 cm− 1, respectively. This observation aligns with the electrocatalytic C–N bond coupling processes that lead to the production of formamide, achieved through the coupling of *CH2O/*CHO with *NH2 intermediates.
To gain further insights into the electrocatalytic C–N bond coupling process, online differential electrochemical mass spectrometry (DEMS) was employed. Importantly, an experiment utilizing 15N-labeled NH3 was conducted to differentiate between the anodic formation of N2 and CO during the reaction, given their identical mass-charge ratio of 28. As shown in Fig. 4c, the potential-dependent mass signals of m/z = 44, assigned to CO2, and m/z = 28, assigned to CO, were observed during the LSV scan. Interestingly, the intensities of the m/z = 29, m/z = 30, assigned to 15N2, and m/z = 31 peaks are negligible in our test (Fig. 4d). This deviates from the DEMS test results reported in previous literature on formamide electrochemical synthesis, suggesting that our reaction may involve distinct reaction intermediates and pathways. The intensity of the m/z = 32 peak can be ascribed to the competitive oxygen evolution reaction. It is also noteworthy that the intensity of mass signals of m/z = 33 and m/z = 34, attributed to 15NH2OH, is quite faint, implying that it may not be a key intermediate. The potential-dependent mass signals of m/z = 45 and m/z = 46 can be respectively attributed to the formation of formamide and 15N-labeled formamide. From the results, we can deduce the following. Firstly, ammonia does not readily oxidize to nitrogen, nitrite, and nitrate on the surface of F-Nb2O5, indicating that *NH2, derived from the dehydrogenation of NH3, serves as the key intermediate. Secondly, the oxidation products of methanol primarily comprise CO and CO2, with trace amounts of formic acid, suggesting the existence of an aldehyde intermediate. It can be postulated that the yield of in-situ aldehyde intermediates may be a limiting factor in the production rate of formamide.
To extract a further level of insights into the formamide electro-synthetic pathways, DFT calculations, and AIMD calculations were implemented on F-Nb2O5 (100) and Nb2O5 (100) surfaces toward electro-formamide synthesis. The Gibbs free energy change during the C-N coupling reaction was meticulously analyzed. Figure 5a and 5b illustrate the first pathway for the electro-synthesis of formamide on F-Nb2O5 (100) and Nb2O5 (100), respectively. The corresponding atomic configurations are depicted in the Supplementary Figs. 13 and 14. A thermodynamically viable path was identified for the production of an aldehyde intermediate, following the sequence CH3OH* → CH3O* → CH2O*. The formation of CH3O* is an uphill process on both catalysts, but it is more favorable on F-Nb2O5 (100) with an energy barrier of 0.12 eV. It is noteworthy that the formation of *NH2 on F-Nb2O5 (100) is a downhill process with an energy barrier of 0.12 eV. This is in stark contrast to the process on Nb2O5 (100), which is an uphill process and has a significantly higher energy barrier of 1.01 eV. Initially, the C-N bond is formed via the nucleophilic attack of the *NH2 intermediate on the *CH2O intermediate. Subsequently, the resulting *NH2CH2O intermediate undergoes a dehydrogenation step to produce formamide. A transition state search was conducted to further investigate the differences in electrocatalytic performance. The findings reveal that F-Nb2O5 presents a lower kinetic barrier, with an energy of 0.29 eV. The formation of the C-N bond process and free energy change have been corroborated by the results of the restrictive molecular dynamics slow growth simulation (Supplementary Fig. 15a, b). In contrast, the C-N coupling barrier for Nb2O5 is considerably high at 0.97 eV. The intermediate is more predisposed to dehydrogenate to *CHO, as opposed to C-N coupling. The *NH2 tends to extract H from *CH2O, forming adsorbed *NH3, which exhibits a catalyst-like behavior. This could serve as one explanation for the high nitrogen selectivity and low carbon selectivity observed on the Nb2O5 catalyst. Ultimately, the desorption barrier of formamide from the surface of the F-Nb2O5 catalyst is 0.02 eV lower than that of the Nb2O5 surface.
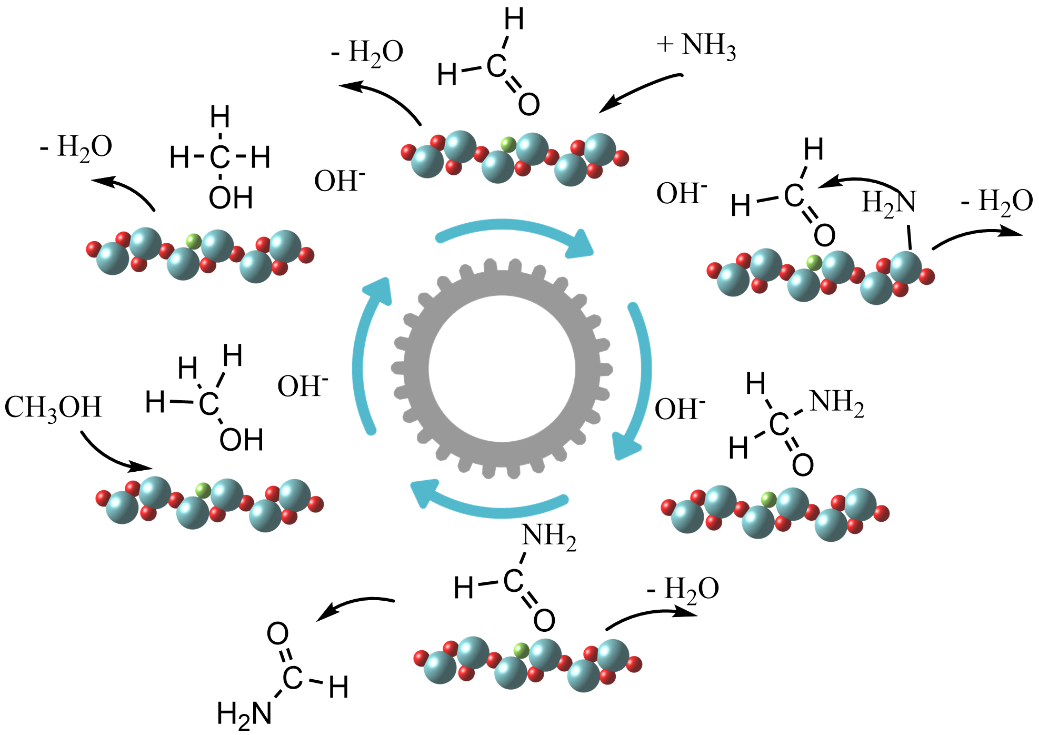
Supplementary Fig. 12 a and b illustrate the second pathway, which involves the formation of a C-N bond via a nucleophilic attack between the *NH2 and *CHO intermediates on F-Nb2O5 (100) and Nb2O5 (100). The corresponding atomic configurations are depicted in the Supplementary Figs. 16 and 17. F-Nb2O5 (100) presents a lower barrier of 0.24 eV compared to the first pathway. However, *CHO tends to be preferentially oxidized to CO products, as identified by the slow growth simulation (refer to Supplementary Fig. 14c, and 14d), and the production of CO was confirmed by the DEMS results. In contrast, the barrier for *CHO and *NH2 coupling on the Nb2O5 surface is only 0.12 eV. This process, however, is hindered by the dehydrogenation step of *NH3, which has a significantly higher barrier of 1.01 eV. To ascertain whether the C-N coupling process pathway involves a nucleophilic attack, we performed an electrostatic potential (ESP) analysis of the *NH2 + *CH2O process (Fig. 5c). The analysis revealed that *CH2O possesses an electrophilic carbon center, which subsequently undergoes a nucleophilic attack by the adjacent *NH2. Ultimately, the thermodynamically favorable reaction pathway on F-Nb2O5 (100) was unveiled, as depicted in Scheme 1. This pathway involves the nucleophilic attack of the ammonia-derived *NH2 on the methanol-derived *CH2O, followed by a dehydrogenation process to form formamide.
To further investigate the contribution of F-doping to the C-N coupling process, we performed a computational analysis of the electronic structural properties at the Nb sites. Figure 5d displays the projected density of states (PDOS) of the d orbitals of the Nb sites, confirming a significant downshift in the band center of the F-doped Nb site, from 0.507 eV to -1.659 eV, which could significantly impact the electrochemical reaction performance. Given the significance of OH− adsorption under alkaline conditions, Fig. 5e presents the Crystal Orbital Hamilton Population (COHP) analysis results of the adsorbed OH− intermediate on the surfaces of F-Nb2O5 (100) and Nb2O5 (100). The findings suggest that OH− adsorption is more thermodynamically favorable on F-Nb2O5 (100), primarily due to the contribution of single-electron adsorption. This is confirmed by differential charge density results (Supplementary Fig. 18), which show that the Nb site adjacent to the F element, exhibiting an electron-deficient state, is a significant contributor. As illustrated in Fig. 5f, the COHP results of the adsorbed *NH2 intermediate suggest that the *NH2 intermediate exhibits greater stability on the F-Nb2O5 (100) surface, which is evidenced by the relationship between the adsorption energy and ICOHP data. The interaction between the pz orbital of the adsorbed *OH and *NH2 intermediate, and the dz2 orbital of Nb, plays a significant role in the formation of the Nb-O and Nb-N bonds, respectively. This could be a crucial factor in understanding the adsorption strength on metal surfaces, particularly in the context of back-donation interactions. Interestingly, the COHP results of the adsorbed *CH2O (Supplementary Fig. 19) show that the Nb-O bond originates from the contribution of O 2p and Nb 5s. On the F-Nb2O5 (100) surface, *CH2O shows stable and moderate adsorption energy, not affected by the downshift of the d-band center. These results are in accordance with the Sabatier principle, which states that an effective catalyst should demonstrate a moderate binding strength with the reactants.43,44 Therefore, by elucidating the mechanism of fluorine doping in boosting C-N coupling, we can conclude that F-Nb2O5 (100) is more favorable for the electrochemical anodic formamide synthesis.