Detection and monitoring of toxic and exhaust gases are crucial for energy and environmental conservation. Low-power, inexpensive gas sensors are in high demand. Metal oxide gas sensors are gaining interest due to their high selectivity and sensitivity. This research work aims to synthesize and characterize metal oxides, specifically thorium(IV) oxide, iron(III) oxide, and FTMMO, which is a mixed metal oxide consisting of iron and thorium. The synthesis of nanoparticles is accomplished using the co-precipitation method with a microwave reaction system. The resulting nanoparticles are subsequently characterized utilizing various analytical techniques such as FT-IR, UV-VIS (DRS), FE-SEM, EDAX, AFM, and XRD analysis. The cubic geometry of ThO2 and the face-centered rhombohedral structure of α-Fe2O3 nanoparticles were verified by XRD analysis. In order to investigate the utilization of iron(III) oxide, thorium(IV) oxide and iron thorium mixed metal oxides (FTMMO) are used to recognizes of ammonia and sulfur dioxide with the help of electrochemical method in the basic medium. The binding behavior of metal oxides and ovalbumin were investigated using UV-visible adsorption and fluorescence spectral techniques. The binding constant (Kb), Stern-Volmer constant (Ksv), and fluorophore quenching rate constant (kq) were calculated with the help of spectral data. Using the disc diffusion technique, research has been carried out to investigate the exceptional antibacterial activities of prepared metal oxides and mixed metal oxides against the different bacterial strains.
Research Article
Microwave-assisted Synthesis and Characterization of Metal Oxide Nanoparticles for Biological and Electrochemical Applications
https://doi.org/10.21203/rs.3.rs-4092184/v1
This work is licensed under a CC BY 4.0 License
Version 1
posted
You are reading this latest preprint version

gas molecule recognition
iron(III) oxide
mixed metal oxides
ovalbumin binding interaction and thorium(IV) oxide
-
Iron(III) oxide, thorium(IV) oxide, and iron thorium mixed metal oxide, often referred to as FTMMO, were synthesized using the microwave-assisted co-precipitation method using the precursors ferric chloride hexahydrate [FeCl3.6H2O] and thorium nitrate [Th(NO3)4].
-
Analysis using energy dispersive X-rays revealed that the material's elemental composition was extremely pure.
-
The prepared materials were confirmed to be nanometer-sized using a field emission scanning electron microscope.
-
XRD confirmed the planes of a face-centered rhombohedral lattice of α-Fe2O3 nanoparticles.
-
Cyclic voltammetry was used in gas molecule sensing studies, exhibiting exceptional sensing abilities towards NH3 and SO2.
-
UV-visible absorption and emission spectral titrations were used to examine the binding interaction between ovalbumin and the prepared nanoparticles.
-
Metal oxides and mixed metal oxide nanoparticles displayed unmatched antibacterial activity, making them a crucial tool in combating bacterial infections.
Nano particles have distinct properties and behaviors that differ from their larger counterparts due to their small size. Because of their uniqueness, they are in high demand in a wide range of applications [1]. Metal oxides and mixed metal oxides have been identified as especially intriguing for a broad spectrum of applications among the many types of nano particles. Metal oxide nanoparticles are very small particles made up of metal and oxygen atoms [2]. Because of their nanoscale dimensions, these nanoparticles have unique properties such as an elevated surface area-to-volume ratio, enhanced the reactivity, and better electrical, mechanical and catalytic functions, gas detectors, devices for storing energy, electronics, sensors, batteries and supercapacitors [3, 5]. Because of their unique properties and wide-ranging applications, metal oxide nanoparticles have ushered in a new era of possibilities in the field of advanced materials [6]. Numerous studies has been conducted in recent years to investigate the potential of mixed metal oxides to create innovative materials by combining the desirable characteristics of various metal oxides [7]. Recent studies have reviewed a variety of techniques for making metal oxide and mixed oxide nanoparticles [8]. Among these methods, microwave-assisted co-precipitation method involves synthesizing nanoparticles by co-precipitating metal ions in the presence of microwave irradiation [9]. By utilizing microwave energy, the reaction kinetics are accelerated, leading to the rapid formation of nanoparticles. Surprisingly, the particle sizes, surface areas, and mechanical properties of the resulting materials can be altered by adjusting the temperature, operating conditions and precursor used [10].
Because of their exceptional properties and wide range of applications, iron oxide and thorium oxide have garnered significant attention among the various types of metal oxides in recent years [11]. Owing to their unique and advantageous properties, these metal oxides, iron oxide and thorium oxide, have revolutionized a variety of industries. Furthermore, research into mixed oxides of metals has opened up new avenues for the development of advanced materials with improved performance [12]. Recognizing the characteristics and uses of iron oxide, thorium oxide, and combined metal oxides enables us to capitalize on their potential and continuously push the boundaries of metal oxide technology [13].
Iron oxide nanoparticles (NPs) have recently stimulated the scientific imagination due to their versatile chemical, electrical, optical, and magnetic properties, making it a promising material for a wide range of applications including storage devices, bio-medical applications, catalysts, and magnetic fluids [14]. By maintaining charge neutrality with the oxygen atoms, both the divalent and trivalent cationic states (i.e. ferrous and ferric) assist iron in occurring at different positions in the unit cell. The most common iron oxides are trivalent oxides, which have four crystalline phases, namely α, ß, γ and ɛ. Among these crystalline phases, hematite (α -Fe2O3) is the most stable form of iron oxide, with unusual magnetic properties, non-toxicity, and corrosion resistance [15]. The crystal structure is rhombohedral. Iron oxide-based sensors are widely used in gas detection and air quality monitoring systems due to their high sensitivity and selectivity for various gases [16, 17]. When exposed to a target gas or volatile compound, iron oxide reacts chemically with the analyte, causing changes in its electrical properties. These changes can be used to accurately detect the presence and concentration of specific gases or substances. Iron oxide sensors can be used to detect hazardous gas leaks, ensuring worker safety and preventing potential accidents [18, 19]. Iron oxide nanoparticles can be used to detect specific biomarkers in biological samples, which have enormous potential in early disease diagnosis and personalized medicine [20].
Thoria, also known as thorium(IV) oxide, has received a lot of attention in recent years due to its unique properties. This compound has distinct properties that make it highly desirable for a variety of applications, including nuclear energy, catalysts and electronic devices [21]. The use of thorium(IV) oxide (ThO2) as a sensing material in electronic devices has revealed an innovative progress known as thorium oxide sensing in the field of advanced technology. Furthermore, thorium oxide is an excellent electrical conductor, making it especially suited for gas sensing applications. Thorium oxide has exceptional thermal stability, good electrical conductivity, and durability against corrosion, making it an ideal material for the fabrication of adaptable and reliable sensors. Thorium oxide gas sensing technology offers unparalleled sensitivity, selectivity, and stability, making it an ideal choice for a wide range of applications [22].
The goal of this article was to look into the potential of different metal oxides, specifically iron(III) oxide, thorium(IV) oxide and a combination of iron and thorium mixed metal oxides. The use of microwave assisted co-precipitation method to synthesize and characterize these oxides, highlighting their structural characteristics, electrical and optical properties and topography. To accomplish this, X-ray powder diffraction (XRD), field emission scanning electron microscopy (FE-SEM), FT-IR spectroscopy, UV-visible absorption spectroscopy, and atomic force microscopy were used for a thorough examination of the nanoparticles. Recently, there has been a growing interest in the development of gas sensors in a variety of fields such as environmental tracking, manufacturing processes, and medical care. Iron oxide and thorium oxide have received a lot of focus as materials with a lot of potential in gas sensing. Because of their impressive properties, these compounds have received substantial study, making them a good option for the detection of multiple gas types.
Characterization
The FT-IR spectra in the 4000–400 cm-1 range were produced using KBR pellets and a Shimadzu 8400S spectrometer. The XRD data was acquired using a PANalytical X'pert-pro powder X'celerator diffractometer with Cu-kα radiation. UV-visible absorption and fluorescence spectra were analyzed using quartz cells equipped with a JASCO FP-6300 spectrofluorometer and a JASCO variant-630 spectrophotometer. The FE-SEM images were taken using a JEOL JSM-6700F field emission scanning electron microscope. The electrochemical studies were conducted by CH-instrument Inc., a company based in Texas, USA. AFM images were acquired using an Easy Scan 2 controller from Nanosurf, and contact mode measurements were made using a micromachined silicon probe.
In this research, two metal oxide nanoparticles, namely iron(III) oxide and thorium(IV) oxide, as well as a iron thorium mixed metal oxide, were synthesized. Then, a variety of analytical methods were used to characterize these nanoparticles. The spectral methods like UV-Visible absorbance (DRS) and FT-IR were used to examine the optical characteristics of the nanoparticles. XRD was used for investigating into the nanoparticles' crystal structure. Energy dispersive X-Ray (EDX) spectrometry and field emission scanning electron microscopy were used to analyze the microstructure, including size, shape, and composition. By using atomic force microscopy, the topography images of the nanoparticles were studied. The data obtained from these analyses are discussed underneath.
Electronic spectra of nanomaterials (DRS)
The technique of measuring the amount of light absorbed by a sample in the UV and visible range is called UV-Visible absorbance analysis, or Diffuse Reflectance Spectroscopy (DRS) [23]. It is a method that clarifies the characteristics of solid materials' absorbance and reflectance throughout the visible and ultraviolet light spectrum [24]. The UV-Visible DRS offers important insights into the chemical makeup, structural characteristics, and optical behavior of a variety of solid samples through the analysis of the spectrum reflectance curves.
Using UV-visible absorption spectroscopy, the optical properties of the prepared nanoparticles in the 200–900 nm wavelength range were examined. Figure 1(a) shows that the iron(III) oxide has exhibited a significant absorbance peak at 305 nm, with absorbance value is 1.28 which indicating the remarkable UV absorption capacity of the synthesized iron(III) oxide nanoparticles. The compound's energy band gap was calculated using the formula 𝐸 = h. 𝑐 /𝜆, in which c is the light's velocity, λ is the wavelength of maximum absorbance, and h is Planck's constant. The band gap energy of iron(III) oxide was measured and found to be 4.07 eV [25]. Similarly thorium(IV) oxide was exhibited an absorption peak at 307 nm and band gap energy is 4.04 eV [Fig. 1(b)]. The analysis of the spectra showed that the mixed metal oxide had a noticeable broad peak at 462 nm, which indicates a strong absorbance in the visible region (A = 0.90). This indicates that the good absorption capacity in the visible range. The band gap energy of the FTMMO nanoparticles was determined to be 2.68 eV [Fig. 1(c)]. The smaller size of the FTMMO nanoparticles is the cause of this decrease in band gap energy when compared to iron oxide and thorium oxide, as shown by XRD and FE-SEM. The electronic properties of nanomaterials are tabulated in the Table.1.
Table.1. Absorption band (λmax) and band gap energy values of Iron(III) oxide, Thorium(IV) oxide and FTMMO.
|
S.No |
Name of the samples |
Absorption band (λmax) (nm) |
Band gap energy (eV) |
|---|---|---|---|
|
1 |
Iron(III) oxide |
305 |
4.07 |
|
2 |
Thorium(IV) oxide |
307 |
4.04 |
|
3 |
FTMMO |
462 |
2.68 |
Fourier Transform – Infra Red Spectral Analysis
The FT-IR spectroscopy is a technique that analyzes the interaction between molecules and infrared radiation [26, 27]. The FT-IR spectra of iron(III) oxide, thorium oxide and mixed oxides of Fe and Th are given in Fig. 2.
According to [Fig. 2(a)], the infrared spectrum (FT-IR) of the synthesized iron(III) oxide nanoparticles was in the range of 400–4000 cm-1 wavenumber which identify the chemical bonds as well as functional groups in the compound. The large broad band across 3435.28 cm-1 is ascribed to the O-H stretching vibration, indicating the presence of H2O. The absorption picks around 1627.96 cm-1 are due to the bending vibration of hydroxyl groups [28]. The strong band below 700 cm-1 is assigned Fe-O stretching mode. The band corresponding to Fe-O stretching mode of iron oxide is seen at 566.15 cm-1 and 475.25 cm-1. The FT-IR spectrum of ThO2 is exhibited an absorption band observed at 3440.67 cm-1 signifies the stretching vibration of O-H, indicating the presence of H2O [Fig. 2(b)]. Similarly, the bending vibration of O-H can be attributed to the absorption band at 1645.95 cm-1. The intense peak was detected at 466.02 cm-1 and 844.18 cm-1 corresponds to the characteristic Th-O stretching band, specifically associated with ThO2. The FT-IR spectrum of FTMMO is given in Fig. 2(c) and which displayed an absorption bands at 3414.99 cm-1, indicating the O-H stretching vibration. Additionally, the absorption bands at 1618.06 cm-1 were observed, signifying the bending vibration of O-H. The strong peak at 451.94 cm-1, 526.34 cm-1 and 852.10 cm-1 which indicating the formation of M-O stretching band of FTMMO. Ultimately, this suggests that the formation of a mixed metal oxide of iron (Fe-O) and thorium (Th-O). The FT-IR spectral data of various metal oxides are given in the Table.2.
Table.2. FT-IR spectral data for (1) Iron(III) oxide, (2) Thorium(IV) oxide and (3) FTMMO.
|
S.No |
Name of the samples |
Assigned functional groups |
||
|---|---|---|---|---|
|
O-H Stretching vibration (cm-1) |
O-H bending vibration (cm-1) |
M-O stretching vibration (cm-1) |
||
|
1 |
Iron(III) oxide |
3435.28 |
1627.96 |
475.25 566.15 |
|
2 |
Thorium((IV) oxide |
3440.67 |
1645.97 |
466.02 844.18 |
|
3 |
FTMMO |
3414.99 |
1618.06 |
451.94 526.34 852.10 |
X-ray Diffraction Analysis
X-ray diffraction analysis, also known as XRD analysis, is a non-destructive technique used to determine the arrangement of atoms or molecules within a crystalline material [29, 30].
The XRD pattern of calcined iron(III) oxide nanoparticles is presented in [Figure 3(a)]. The XRD results for the iron oxide nanoparticles exhibits strong peaks around 2θ = 24.13° (012), 33.24° (104), 35.70° (110), 40.54° (113), 49.55° (024), 54.17° (116), 57.44° (018), 62.58° (214) and 64.51° (300). All the diffraction peaks in the XRD pattern are well indexed to the planes of a face centered rhombohedral lattice of α-Fe2O3 nanoparticles (JCPDS file No. 33–0664) [31]. The complete transformation of iron hydroxides into hematite (iron oxide) nanoparticles is indicated by the absence of diffraction peaks corresponding to Fe(OH)2 and Fe(OH)3. The absence of any other peaks related to the other phases of iron oxides suggests that the prepared α-Fe2O3 nanoparticles were highly pure. The narrow sharp peaks indicates that the hematite products are highly crystalline, implying that the high purity of synthesized hematite particles is obtained by using this synthesis method [32]. The mean crystallite size for the as-synthesized α -Fe2O3 nanoparticles was calculated using applying Scherrer’s formula: D = Kλ/βcosθ, where, K is the shape factor (the typical value is 0.89), λ is the wavelength of incident beam, β is the broadening of the diffraction line measured in radians at half of its maximum source (FWHM) and θ is the Bragg’s angle and D is the diameter of the crystallite size. This calculation is yielded the average crystalline size of α-Fe2O3 and it was approximately 28.02 nm [33]. Results of XRD analysis clearly indicates that the formation of pure crystalline form α -Fe2O3 nanoparticles. Similarly the spectrum of the annealed ThO2 nanoparticles showed peaks at 2θ = 27.64°, 31.88°, 45.75° and 54.36° corresponding to the (111), (200), (220) and (311) planes of crystalline ThO2 respectively, in a cubic geometry (JCPDS file No. 4-0556) [34]. The XRD spectra of ThO2 annealed at 550°C showed a well-developed crystalline structure with reflections that could be assigned to crystalline cubic ThO2 [Fig. 3(b)]. The crystallite size of the ThO2 annealed at 550°C was estimated to be 31.81 nm. Comparably, the diffraction peaks of mixed oxides at angles 2θ = 27.94°, 32.04°, 45.75°, 54.86°, 57.75°, 66.12°, and 73.34° clearly shows that specific crystallographic planes in FTMMO are evident, including (111), (200), (220), (311), (018), (300), and (101) which is given in the [Fig. 3(c)]. Therefore, an average crystalline size of about 8.57 nm was calculated. The growth and arrangement of the crystals are influenced when Fe, O, and Th atoms unite within the lattice, which ultimately results in a decrease in the crystal's size [35]. The observed size reduction can be attributed to specific limitations and constraints placed on the crystal's ability to grow by the inclusion of Fe-O-Th in the crystal lattice. The crystallite size of oxides are tabulated in the Table 3.
Table.3 Crystallite size of 1) Iron(III) oxide, 2) Thorium(IV) oxide and 3) FTMMO
|
S.No |
Name of the samples |
Crystallite Size (nm) |
|---|---|---|
|
1 |
Iron(III) Oxide |
28.02 |
|
2 |
Thorium(IV) Oxide |
31.81 |
|
3 |
FTMMO |
8.57 |
Energy-Dispersive X-Ray Analysis (EDAX)
The analytical method known as Energy-Dispersive X-Ray Analysis (EDAX) makes use of the X-ray fluorescence (XRF) principle. It entails subjecting a sample to a high-energy X-ray bombardment, which causes the material's atoms to release distinctive X-rays at different energies. The Energy Dispersive X-ray Spectroscopy (EDS) was used to determine the elemental composition of metal oxides and mixed metal oxides [36]. Figure 4 displays the EDAX spectra of different prepared nanomaterials.
The energy dispersive spectrum (EDS) of α-Fe2O3 prepared by microwave-assisted co-precipitation method is shown in [Fig. 4(a)] which confirms the existence of Fe and O with weight percent and atomic percent. All the measurements were carried out at room temperature. The peak at 6.4 keV shows the presence of iron and the peak at 0.5 keV for oxygen clearly shows the elemental composition and purity of α-Fe2O3 nanoparticles and the results of EDS analysis clearly which indicates that the formation of pure crystalline α-Fe2O3 nanoparticles.[37] Iron (70.79%) and oxygen (29.21%) by weight percentage were the elements that made up the iron oxide elemental composition. The weight concentration of iron and oxygen, accounting for a total of 100.00%, further ensures the high purity of the iron oxide nanoparticles without any contamination. The energy dispersive spectroscopy (EDS) analysis of ThO2 confirming the presence of thorium (Th) and oxygen (O) in the material, as evidenced by their respective weight percentages. The elements comprising the ThO2 elemental composition were oxygen (26.45%) and thorium (73.55%) by weight percentage. The peak at 2.8 keV shows the presence of thorium and the peak at 0.5 keV for oxygen clearly shows the elemental composition and purity of ThO2 nanoparticles.[38] The analysis of the EDS spectrum revealed that the thorium oxide nanoparticles obtained are of high purity with the total weight composition is 100.00%. The Energy Dispersive Spectroscopy (EDS) analysis of FTMMO, which firmly verifies the presence of iron, thorium, and oxygen in both weight percent and atomic percent. The EDS analysis reveals that the distinct peaks corresponding to the element of iron, thorium and oxygen. The peak at 6.4 keV shows the presence of iron, the peak appeared at 3.0 keV corresponds to the presence of thorium and also the peak at 0.5 keV for oxygen. This clearly shows that the elemental composition of prepared FTMMO mixed metal oxides. By weight percentage, the FTMMO's elemental composition was composed of iron (31.74%), thorium (44.90%), and oxygen (23.36%) accounting for a total of 100.00%. The Elemental composition of iron oxide, thorium oxide and FTMMO were shown in Table 4. The elemental compositions of metal oxides were displayed in the form of pie chart in the Fig. 5.
Table.4. Elemental composition of (a) Iron(III) oxide (b) Thorium(IV) oxide and (c) FTMMO
|
a) Iron(III) oxide |
b) Thorium(IV) oxide |
c) FTMMO |
||||||
|---|---|---|---|---|---|---|---|---|
|
Element |
Weight % |
Atomic % |
Element |
Weight % |
Atomic % |
Element |
Weight % |
Atomic % |
|
O K |
29.21 |
35.98 |
O K |
26.45 |
84.71 |
O K |
23.36 |
51.97 |
|
Fe K |
70.79 |
64.02 |
Th M |
73.55 |
15.29 |
Fe K |
31.74 |
41.15 |
|
Th M |
44.90 |
6.88 |
||||||
|
Total |
100 |
100 |
Total |
100 |
100 |
Total |
100 |
100 |
FE-SEM analysis:
FE-SEM is a high-resolution imaging technique that utilizes a beam of focused electrons to interact with the sample surface [39]. This beam scans the surface in a raster pattern, while the emitted secondary electrons produce a detailed image of the sample's topography. The Field Emission-Scanning Electron Microscopy (FE-SEM) was used to examine the morphology and structure of the samples. The microscope allows for the study of clear, high to low magnification images down to the nanometer range. The FE-SEM images of iron oxide, thorium oxide, and FTMMO are shown in Fig. 6.
The FE-SEM images of the α-Fe2O3 nanoparticles synthesized using the microwave-assisted co-precipitation method are displayed in Fig. 6 (a-b). The prepared sample is apparent in this figure magnified by 200 µm, forming a structure that appears to be a granules with small spherical shaped particles and are well crystallize in nature [40]. The average particle size estimated from FE-SEM images of α-Fe2O3 is about 31 nm [Fig. 6(b)]. The α-Fe2O3 nanocrystals that formed were not clumped together but rather well separated. These analyses demonstrate that the annealing temperature caused the surface of the sample to become highly crystallinity. The FE-SEM images of the annealed ThO2 nanoparticles at 550°C was given in the Fig. 6(c-d). The structure of the ThO2 nanomaterial resembled a nanoreef when magnified by 50 µm. Furthermore, microscopic pictures showed a homogeneous structure and a uniform distribution of particles without any aberrant surface formations [41]. Based on FE-SEM images, the average particle size of ThO2 is approximately 45 nm [Fig. 6(d)]. The FTMMO, which had been prepared, displayed a nanofilm like structure under a magnification of 200 µm having average particle size of 8 nm [Fig. 6(f)]. In comparison to the single oxides, it is abundantly clear that the synthesized mixed metal oxide was smaller in size. This is because, in contrast to single oxides, FTMMO has a higher annealing temperature and incorporation of mixed oxides [42].
Atomic Force Microscope spectral analysis
AFM is a vital tool in nanotechnology for the design and characterization of nanoscale structures [43]. The Atomic Force Microscope employs a cantilever with a sharp tip to scan the surface of a sample at the atomic level. By measuring the forces between the tip and the sample, AFM generates high-resolution three-dimensional images of nanoscale structures. AFM provides a resolution that is superior to that of optical microscopy. It is a vital instrument for exploring phenomena at the nanoscale since it can resolve characteristics all the way down to the atomic size [44]. Using an atomic force microscope, the prepared nanomaterials' morphology was examined [45]. Every scan was carried out in ambient conditions, which are known to produce topography results that are satisfactory. With a resolution of 256x256 pixels and a scan rate ranging from 0.5 to 1 Hz, the images were captured in topography mode. Using the microscope's section analysis software, the heights of adsorbed NPs and agglomerates were measured [46]. The AFM spectral images of α-Fe2O3, ThO2, and mixed oxides of Fe and Th is shown in the Fig. 7. As the image illustrates, the AFM images of α-Fe2O3 reveals a well-separated group of conical nano columnar structure. The AFM images of ThO2 shows a cluster of conical nanostructures. A mountain like structure can be seen in the FTMMO AFM images. These structures are further examined by the 3-D view of AFM which is shown in Fig. 8.
From the 3-D image, a folded mountain like structure was observed for the prepared nanomaterials. The commonly used area roughness parameters are listed in Table 5. The average roughness (Sa) and the root mean square roughness (Sq) are measured, respectively, over the entire three-dimensional surface. In particular, the spatial variations and temporal changes that take place during the creation of a new surface are examined using root mean square roughness (Sq) when analyzing the surface feature at different scales. The surface topography must be described using the roughness parameters.
Table.5. Area roughness of Iron(III) oxide, Thorium(IV) oxide and FTMMO from AFM spectroscopy
|
Area Roughness |
|||
|---|---|---|---|
|
Area Parameter |
Iron(III) oxide |
Thorium(IV) oxide |
FTMMO |
|
Area |
39.37 pm2 |
39.84 pm2 |
39.37 pm2 |
|
Sa |
45.44 nm |
30.87 nm |
32.72 nm |
|
Sq |
64.69 nm |
38.23 nm |
39.61 nm |
|
Sy |
499 nm |
244.86 nm |
222.28 nm |
|
Sp |
226.25 nm |
126.49 nm |
109.01 nm |
|
Sv |
-272.74 nm |
-118.37 nm |
-113.27 nm |
|
Sm |
-18.62 fm |
-37.25 fm |
-18.63 fm |
Sensing analysis of Iron(III) oxide, ThO2 and mixed oxides of FTMMO
Electrochemical Applications
The method of measuring the current response to an applied voltage in the presence of gas is known as cyclic voltammetry gas sensing. Analyzing the redox processes at the electrode-gas interface can be done by applying a potential sweep to an electrode and measuring the current that results. The purpose of this study was to assess the sensing ability of metal oxides to detect NH3 and SO2 gas. In this work, voltammetric analyses were carried out by using buffer solution pH-13.00 with the help of glassy carbon electrodes. A CH-instrument Inc. was used for the CV measurements with a cell consisting three electrodes like a glassy carbon electrode (working electrode), platinum wire (counter electrode), and a saturated calomel electrode (reference electrode) [47]. The potential range between − 2.0 V and + 1.6 V was carried out at a scan rate of 20 mV/s.
Typical industrial operations and emissions includes the production of ammonia and sulfur dioxide gas. Even though these gases might not be apparent to the human eye, prolonged exposure to large quantities of them might have detrimental effects on health [48]. Metal oxide gas sensing works by adsorbing gas molecules onto the surface of a metal oxide sensor. When this sensor interacts with a specific gas, a chemical reaction takes place, causing a change in electrical conductivity [49]. This change in conductivity is carefully measured and analyzed to accurately determine the presence of the particular gas.
Recognition of ammonia (NH3)
The synthesized nanomaterials were subjected to cyclic voltammogramms with a scanning range of -2.0 V to 1.2 V. The Cyclic Voltammogram of ammonia on modified GCE containing metal oxides like iron(III) oxide, thorium(IV) oxide, and FTMMO were designated as (a), (b) and (c) respectively and shown in Fig. 9. During the cyclic voltammograms no evident response was observed on the bare glassy carbon electrode, designated as (I) and shown in cyclic voltammograms of (a), (b) and (c). However, the modified GCE containing metal oxides like iron(III) oxide, thorium(IV) oxide, and FTMMO showed a reduction peak due to their designated oxygen storage capacity, which was designated as (II), and shown in cyclic voltammograms of (a), (b) and (c) and the respected peak current values are shown in Table 6. The addition of 1 mM of ammonia solution to the system resulted in a peak current shift and the transformation of the broad peak into a distinct and narrow peak, indicating an increasing peak current value due to the adsorption of ammonia on the surface of the electrode. This change clearly demonstrated the sensing capability of Fe2O3, ThO2, and FTMMO towards ammonia, referred to as (III), and shown in cyclic voltammograms of (a), (b) and (c) and the corresponding peak current values are shown in Table 6. In comparison to the peak current values of iron oxide (E = 0.479 V and i = 5.228 e− 5A) and thorium oxide (E = 0.468 V and i = -4.961 e− 5A), FTMMO exhibits higher peak current values of E = 0.555 V and i = -1.772 e− 6A. This indicates to FTMMO's better ammonia sensing ability over that of iron oxide and thorium oxide. For the cyclic voltammograms, the overall potential scan rate was 20 mV/s.
Table 6. Cyclic voltammogram behavior of ammonia.[Ph=13.00, scan rate=20 mV/s]
|
S.No |
Types of Electrode |
Peak current of Modified GCE (II) |
Peak current of Modified GCE + Addition of Ammonia (III) |
||
|---|---|---|---|---|---|
|
-Epc (mV) |
-ipc (µA) |
-Epc (mV) |
-ipc (µA) |
||
|
a |
Iron(III) oxide Modified GCE |
0.999 |
-1.091 |
0.479 |
5.228 |
|
b |
Thorium(IV) oxide Modified GCE |
0.430 |
-5.632 |
0.468 |
-4.961 |
|
c |
FTMMO Modified GCE |
0.532 |
-6.775 |
0.555 |
-1.772 |
Recognition of Sulfur dioxide (SO2)
Cyclic voltammograms of prepared nanomaterials was scanned from − 2.0 V to 1.6 V. The potential scan rate for the cyclic voltammograms was 20 mV/s. The Cyclic Voltammogram of sulfur dioxide on modified GCE containing metal oxides like iron(III) oxide, thorium(IV) oxide, and FTMMO were designated as (a), (b) and (c) respectively and shown in Fig. 10. In the overall cyclic voltammograms, no peak response was observed for a bare glassy carbon electrode which was designated as (I) and shown in cyclic voltammograms of (a), (b) and (c). A lower response in peak current was observed when the GCE was modified with metal oxides like iron(III) oxide, thorium(IV) oxide, and FTMMO, which was denoted as (II), and shown in cyclic voltammograms of (a), (b) and (c) respectively and the depicted peak current values are shown in Table 7. After the introduction of 1 mM of SO2 solution to the cell, the observed peak current exhibited a noticeable shift and showed an increase in peak current value due to the adsorption of SO2 on the surface of the electrode. This increase in peak current signifies the successful sensing ability of Fe2O3, ThO2, and FTMMO towards SO2, which was denoted as (III) and shown in cyclic voltammograms of (a), (b) and (c) respectively and the displayed peak current values are shown in Table 7. Additionally, the oxidation peak current for thorium oxide was found at E = 1.087 V and i = 7.43e-5A, while the mixed metal oxide of FTMMO showed a peak current of E = 0.34 V and i = 5.396e-6A, indicating a higher SO2 adsorption in comparison to iron oxide. It is also evident that FTMMO's better SO2 sensing abilities are supported by its higher peak current values (E = 0.45 V and i = -1.425 e-5A) compared to iron oxide (E = 0.552 V and i = -3.341 e-5A) and thorium oxide (E = 1.087 V and i = -3.442 e-5A).
Table 7. Cyclic voltammogram behavior of SO2.[Ph=13.00, scan rate=20 mV/s]
|
S.No |
Types of Electrode |
Peak current of Modified GCE (II) |
Peak current of Modified GCE + Addition of SO2 (III) |
||
|---|---|---|---|---|---|
|
-Epc (mV) |
-ipc (µA) |
-Epc (mV) |
-ipc (µA) |
||
|
A |
Iron(III) oxide Modified GCE |
0.692 |
-4.535 |
0.552 |
-3.341 |
|
B |
Thorium(IV) oxide Modified GCE |
1.330 |
-6.315 |
1.087 |
-3.442 |
|
C |
FTMMO Modified GCE |
0.445 |
-7.961 |
0.450 |
-1.425 |
Biophysical interaction of ovalbumin
One of the main proteins in egg whites, ovalbumin, has shown to be a useful model system for researching interactions between proteins and surfaces. An area of focus for research is determining ovalbumin's affinity for metal oxide surfaces for binding. It is impossible to overestimate the importance of understanding molecular binding interactions in protein research [50]. Examining the ovalbumin binding interactions by using the UV-visible absorption spectral titrations is a fascinating area of study in this field [51].
UV-Visible absorption spectral responses of Ovalbumin
The UV-Visible absorption spectral responses of Ovalbumin have been extensively studied to understand its behavior and applications. In the UV-Visible absorption spectral titrations, a metal oxide was gradually added to a protein solution while the absorbance spectral changes was being studied. This method provides useful data regarding the interaction's stoichiometry, thermodynamics, and binding affinity. The binding constant (Ka) value is derived from the changes in the absorption spectrum of Ovalbumin at 209 nm, in which the absorbance decreases was due to the binding interaction between proteins and nanoparticles. The ovalbumin concentration (20 µM) was maintained constant while the nanoparticle concentration ranged from 0 to 30 µM during the spectral titrations. The UV-visible absorption spectra of ovalbumin with the addition of nanoparticles are shown in Fig. 11. The binding constant (Ka) values are calculated using the following Benesi-Hildebrand Eq. (1) and which are tabulated in Table (8).
Where A0 and A represent the absorbance of ovalbumin, in the absence and presence of prepared nanoparticles respectively. [G] denotes the concentration of prepared nanoparticles. εG is the molar extinction coefficient of the prepared nanoparticles. εv &εc are their respective molar extinction coefficient of the free Ovalbumin and Ovalbumin bounded nanoparticles respectively. A linear double reciprocal plot of 1/A-A0 vs 1/[G] can be used to calculate the binding constant (Ka).
Fluorescence spectral responses of Ovalbumin
A comprehension of Ovalbumin's structural and functional properties can be gained by examining its fluorescence spectral responses. A widely used technique in the field of molecular spectroscopy for examining the interactions between fluorescent molecules and quenchers is fluorescence spectral titrations quenching, or fluorescence quenching. This technique evaluates how the presence of a quencher reduces the fluorescence intensity of a fluorescent analyte. Many molecular interactions, including energy transfer, molecular rearrangements, ground state complex formation, excited state reactions, and collisional diffusion, lead to fluorescence quenching. Dynamic quenching or state quenching techniques can be used to cause quenching during these interactions. When an excited state fluorophore collides with a quencher molecule in a solution, the intensity of the fluorescence decreases, a phenomenon known as dynamic quenching. The fluorophore returns to its ground state through diffusion during an interaction with the quencher, forming a ground state complex with the quencher, and causing static quenching.
Fluorescence titration analysis was used to determine the nanoparticle's ability to bind with the ovalbumin. When excited at 280 nm, ovalbumin's fluorescence emission spectrum peak was appeared at 331 nm for Fe2O3, ThO2 and FTMMO. The emission intensity of Ovalbumin was quenched due to the interaction of nanoparticles with Ovalbumin. Using the Stern-Volmer equation, the quenching parameters were calculated using the following Eq. (2).
Where F0 and F denotes the fluorescence intensities of Ovalbumin in the absence and presence of prepared nanoparticles. Ksv is the Stern-Volmer constant, and τ0 represents Ovalbumin lifetime 10− 8s (ι) without any quencher. The intensity of the fluorescence decreases as the concentration of prepared nanoparticles increases, from 0 to 30 µM, when added to a fixed concentration of ovalbumin (20 µM). This decrease in intensity is due to the interaction between the nanoparticles and ovalbumin, as shown in Fig. 12. The modified Benesi-Hildebrand plot is also shown in the inset [Fig. 12(a,b,c)]. The Stern-Volmer plot was created and shown in Fig. 13 using the emission spectral data and the values for the Stern-Volmer constant (Ksv) and bimolecular quenching constant (kq) were calculated and recorded in Table 8. The apparent binding constant values (Kapp) are also calculated from the plot of log[(F0-F)/F vs log[Q]. The slope value n which gives the number of binding sites for all the prepared compounds are calculated using the following scatchard Eq. (3) and shown in Table 8.
The interaction between the nanoparticles Iron(III) oxide, Thorium(IV) oxide and FTMMO (Fe-Th) (as shown in the Figures) has been analyzed to determine the binding parameters. The findings show that ovalbumin's intrinsic fluorescence can be considerably suppressed by the metal oxide nanoparticles made in this investigation. Furthermore, 2.90 x 10¹⁰M-1S-1, the generally acknowledged maximum diffusion constant for biomolecules, is exceeded by the obtained quenching rate constant (kq) [52]. These results imply that the static quenching mechanism defines the binding process between ovalbumin and metal oxide nanoparticles.
Table.8. Binding parameters of nanomaterials with Ovalbumin from spectral data.
|
S.No |
Name of the samples |
Absorption (UV) |
Emission (Flouresence) |
||||||
|---|---|---|---|---|---|---|---|---|---|
|
λmax (nm) |
Ka (M− 1) |
λem (nm) |
Ksv (M− 1) |
kq(M− 1s− 1) |
Kb(M− 1) |
Kapp(M− 1) |
n |
||
|
1 |
Fe2O3 |
209 |
1.30x10⁴ |
331 |
5.39x10⁵ |
5.39x10¹³ |
1.26x10⁴ |
3.77x10⁴ |
1.07 |
|
2 |
ThO2 |
209 |
1.70x10⁴ |
331 |
4.18x10⁵ |
4.18x10¹³ |
1.00x10⁴ |
2.89x10³ |
0.90 |
|
3 |
FTMMO |
209 |
2.50x10⁵ |
331 |
7.44x10⁵ |
7.44x10¹³ |
3.95x10⁵ |
1.93x10⁵ |
1.13 |
Antibacterial activity of Iron(III) oxide, Thorium(IV) oxide and FTMMO
Iron(III) oxide, thorium(IV) oxide and FTMMO are remarkable compounds that have garnered significant attention in the world of antibacterial research. These nanoparticles exhibit unique properties that make them highly effective against a wide range of bacteria [53, 54]. These compounds exhibit promising properties, offering a new perspective on antibacterial treatments [55]. This research work used the disc diffusion method to investigate the intriguing antibacterial activity of iron(III) oxide, thorium(IV) oxide, and FTMMO against the bacterial strains E. Coli, Bacillus subtilis, Bacillus cereus, Pseudomonas aeruginosa, and Staphylococcus aureus. In this method, the test bacteria were introduced into peptone water and left to incubate at a temperature of 35ºC for a period of 3 to 4 hours. Subsequently, sterile petri plates containing Mueller Hinton agar were prepared and poured into them. A volume of 0.1 ml of bacterial culture was then placed on the surface of the agar plates, which were later spread evenly using an L-rod. After allowing the inoculated plates to dry for five minutes, a disk loaded with a concentration of 1000 µg/ml of the tested sample was carefully placed on top of the inoculated petri plates using sterile techniques. The plates were incubated at a temperature of 37ºC for a duration of 18 to 24 hours. Following incubation, the plate is examined for the presence of a zone of inhibition, which is then measured in millimeters. Remarkably, all three nanoparticles exhibit notable antibacterial activities, effectively hindering the growth of pathogens. The highest zone of inhibition, measuring 18 mm, was observed for FTMMO (Fe-Th) against the bacterium Staphylococcus aureus. The antibacterial activities of Fe2O3, ThO2 and FTMMO against the bacteria Bacillus subtilis are shown in Fig. 14. The antibacterial activity of zone of inhibition levels are shown in Table 9. The antibacterial activity zone of inhibition images for Fe2O3, ThO2 and FTMMO are shown in Fig. 15 and the zone of inhibition values are given in Table 9.
Table.9. Antibacterial activity Zone of inhibition levels for Fe2O3, ThO2 and FTMMO
|
Bacteria |
Inhibition zone in mm |
|||||
|---|---|---|---|---|---|---|
|
Ab Ampicillin |
Fe2O3 |
Ab Ampicillin |
ThO2 |
Ab Ampicillin |
FTMMO |
|
|
E.coli |
7.5 |
9 |
10 |
9 |
11 |
14 |
|
Staphylococcus aureus |
9 |
10 |
9 |
10 |
17 |
18 |
|
Bacillus subtilis |
14 |
7 |
9 |
12 |
6 |
14 |
|
Bacillus cereus |
7.5 |
8 |
10 |
7 |
8 |
14 |
|
Pseudomonas aeruginosa |
8 |
8.5 |
10 |
9 |
14 |
15 |
By utilizing the precursors of ferric chloride and thorium nitrate, the microwave-assisted co-precipitation method was used to synthesize iron(III) oxide, thorium(IV) oxide and mixed metal oxides of FTMMO with high purity. FT-IR, UV-VIS (DRS), XRD, FE-SEM, AFM and EDAX were among the analytical techniques used to characterize the synthesized nanoparticles. The surface morphology of the metal oxide nanoparticles was investigated using FE-SEM, which revealed a range of morphological structures. The XRD results confirmed the nanocrystallite composition of the synthesized product. The rhombohedral structure of α-Fe2O3 and the cubic structure of ThO2 were confirmed by the XRD pattern. The samples composition was disclosed by the EDAX results, which validated their high level of purity. The voltammetric studies in this research work were conducted at a scan rate of 20 mV/s at Ph 13.00 buffer solution using a glassy carbon electrode to explore the application of iron oxide, thorium oxide and iron thorium mixed metal oxides (FTMMO) in ammonia and SO2 sensing. The cyclic voltammetry studies reveal distinct and well-defined peaks for ammonia and SO2 on FTMMO mixed metal oxides, suggesting improved sensing capabilities. Ovalbumin employed the static quenching method to quench fluorescence intensities of ovalbumin by the synthesized nanoparticles. Employing the spectral data on absorption Kα, the binding constant, was estimated. The bimolecular quenching constant (kq) and Stern-Volmer constant (Ksv) were calculated and recorded using the emission spectral data. Additionally, the values of the apparent binding constant (Kapp) are measured. The quenching rate constant (kq) of prepared nanomaterials exceeds 2.90 x 10¹⁰M-1S-1, the generally accepted maximum diffusion constant for biomolecules. The antibacterial activity of all three nanoparticles is significant and effectively inhibits the growth of pathogens. The prepared compounds showed good antimicrobial activity against the following bacteria E.coli, Bacillus subtilis, Bacillus cereus, Pseudomonas aeruginosa, and Staphylococcus aureus. When FTMMO (Fe-Th) was used against Staphylococcus aureus, the most significant zone of inhibition, examining 18 mm, was observed. These compounds have become attractive substitutes for antibacterial agents based on the inhibition results, providing an effective method to stop the development of antibiotic resistance. The study establishes that the mixed metal oxides enhance the gas sensing properties, paving the way for newer and better gas sensor materials.
The metal oxides and mixed metal oxides were synthesized using the microwave-assisted co-precipitation technique. All the compounds used in the present research were of the analytical grade. The precursors, namely thorium nitrate (Th(NO3)4) and ferric chloride hexahydrate (FeCl3.6H2O), were obtained from Sigma Aldrich. Sodium hydroxide (NaOH), the precipitant, was acquired from HiMedia. Double-distilled water was used to prepare all the solutions.
Preparation of metal oxides and mixed metal oxides nanomaterials
Preparation of Iron(III) oxide (α-Fe2O3)
In order to synthesize iron(III) oxide nanoparticles, the following steps are carried out. For this preparation, a 0.1M solution of Ferric chloride hexahydrate (FeCl3.6H2O) and a 0.3M solution of sodium hydroxide (NaOH) were prepared separately using double distilled water. Then, 0.3M NaOH was added dropwise to the 0.1M ferric chloride solution at a stirring rate of 500 rpm using a magnetic stirrer. The addition was maintained until the ideal pH was reached. To ensure good homogeneity, stirring was kept up for around two hours after the addition was finished. The aqueous clear solutions were stirred until a brownish colloidal suspension was formed. After that, the solution was microwave-irradiated for 15 minutes at 150 W using a microwave oven. To enhance the qualities of the synthesized product, the irradiation solution was then sonicated for 30 minutes at a frequency of 52 kHz. After that filtration was used to collect the precipitate, which was then washed with ethanol and distilled water. It was then dried for 2 hours in a hot air oven at 110°C. This dried powder was then annealed for 3 hours in a muffle furnace at 500°C to acquire brown colour pure iron(III) oxide nanoparticles.
Preparation of Thorium(IV) oxide (ThO2)
The conventional method to synthesize thorium(IV) oxide (ThO2) nanoparticles. Initially, a 0.1M thorium nitrate solution was made with double distilled water. A separate solution of 0.3M sodium hydroxide (NaOH) was also prepared. After that, the 0.3M NaOH solution was slowly added to the 0.1M thorium nitrate solution while stirring at 500 rpm with a magnetic stirrer. The addition was stopped after the required pH was reached. After the addition was finished, the stirring was continued for about 2 hours to accomplish overall good uniformity. When thorium nitrate solution reacts with sodium hydroxide, a hydrolysis process occurs, resulting in the formation of products such as thorium hydroxide. A white colloidal dispersion forms as a result. The solution is then microwave-irradiated for 15 minutes at 150 W in a microwave oven. Following that, the irradiated solution is sonicated for 30 minutes at a frequency of 52 kHz to improve the properties of the resulting product. The resulting precipitate is collected through filtration, washed with ethanol followed by distilled water, and dried in a hot air oven at 110°C for 2 hours. The dried powder is subsequently annealed in the muffle furnace at 550°C for 2 hours to get the thorium(IV) oxide.
Preparation of Iron Thorium mixed metal oxide (FTMMO)
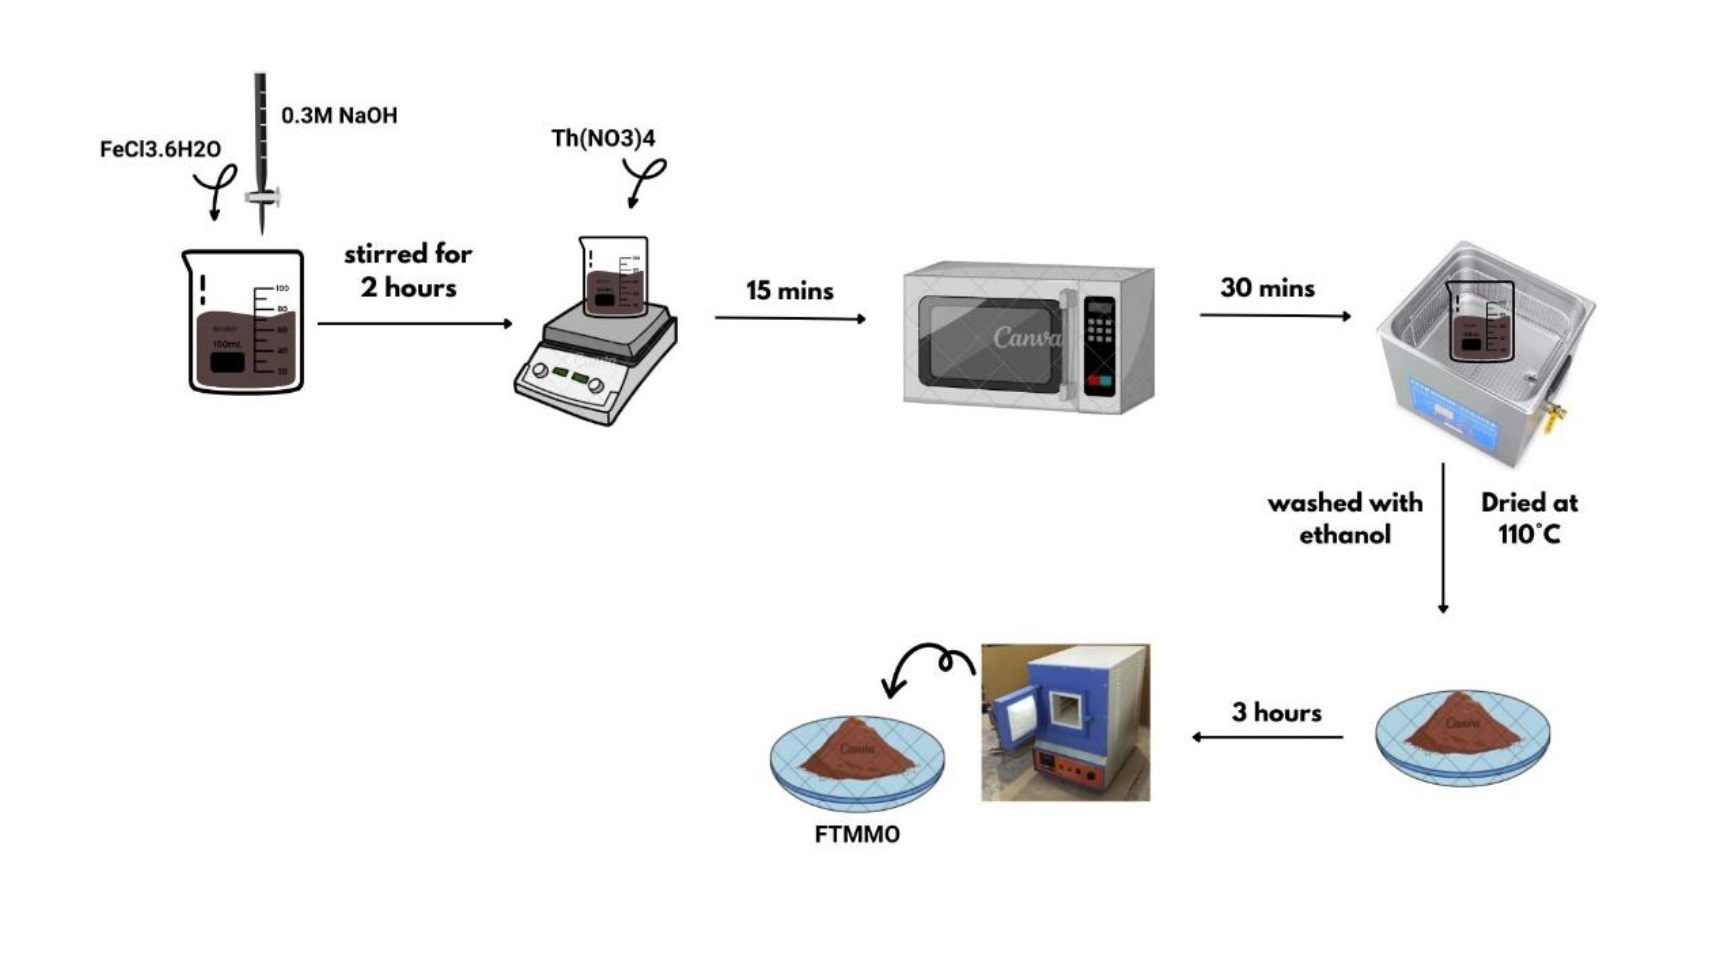
Ferric chloride hexahydrate(FeCl3.6H2O) and thorium nitrate (Th(NO3)4) were used as precursors in this preparation. Using double distilled water, separate aqueous solutions of 0.1M FeCl3.6H2O, 0.1M Th(NO3)4, and 0.3M NaOH were prepared. The 0.3M NaOH aqueous solution was added drop by drop to the 0.1M FeCl3.6H2O solution and thoroughly stirred with a magnetic stirrer. Then, 0.1M Th(NO3)4) solution was slowly added to this mixture and thoroughly stirred for about 2 hours. After that, the solution was microwaved for 15 minutes at 150 W in a microwave oven. The irradiated solution was then sonicated for 30 minutes at a frequency of 52 kHz to yield the optimum product. Filtration was used to collect the precipitate, which was subsequently purified with ethanol and distilled water. It was then dried for 2 hours in a hot air oven at 110°C. The dried powder then underwent calcining for 3 hours in a muffle furnace that operates at 600°C to produce iron thorium mixed metal oxide (FTMMO).
Acknowledgments
The authors thank the Principal, Management, Head, staff members of V. O. Chidambaram College, Tuticorin to encourage the completion of the research work.
Declaration of Competing Interest
The authors declare that they have no conflicts of interest regarding the publications of this paper.
Author Contribution
Gomuraj Santhanaraj wrote the main manuscript text, prepared figures and tables, and did all the work. Chinnapaiyan Vedhi reviewed the electrochemical application. Mathavan Alagarsamy reviewed the entire manuscript.
- Gouda M, Aljaafari A , Al-Fayz Y, Boraie W.E (2015) Journal of Nanomaterials 16(1):163-163
- Hudry D, Apostolidis C, Walter O, Gouder T, Courtois E, Kübel C, Meyer D (2013) Controlled synthesis of thorium and uranium oxide nanocrystals. Chemistry–A European Journal 19(17):5297-5305
- Karimi M.A, Iliyat M, Atashkadi M, Ranjbar M, Habibi‐Yangjeh A (2020) Microwave‐assisted synthesis of the Fe2O3/g‐C3N4 nanocomposites with enhanced photocatalytic activity for degradation of methylene blue. Journal of the Chinese Chemical Society. 67(11):2032-2041.
- Elias V, Sathicq A.G, Cuello N, Luque R, Elsharif A.M, Tolley, A, Romanelli, G.P, Eimer G (2021) Design of Fe-modified mesoporous nanostructures as efficient catalysts for microwave-assisted selective oxidations of sulfides. Applied Catalysis A: General 615:118027
- Su P.G, Li M.C (2021) Recognition of binary mixture of NO2 and NO gases using a chemiresistive sensors array combined with principal component analysis. Sensors and Actuators A: Physical 331:112980
- Eranna G, 2011 Metal oxide nanostructures as gas sensing devices. CRC press
- Zahmouli N, Hjiri M, El Mir L, Bonavita A, Donato N, Neri G, Leonardi S.G (2018) High performance acetone sensor based on γ-Fe2O3/Al–ZnO nanocomposites. Nanotechnology 30(5):055502
- Gusain D, Awolusi O.O, Bux F (2022) Synthesis and characterization of iron oxide/MIL-101 composite via microwave solvothermal treatment. Surface Science 716:121952
- Gabano E, Ravera M (2022) Microwave-Assisted Synthesis: Can Transition Metal Complexes Take Advantage of This “Green” Method?. Molecules 27(13):4249
- Saleem Q, Torabfam M, Fidan T, Kurt H, Yuce M, Clarke N, Bayazit M.K.A (2021) Functionalized graphitic carbon nitrides for environmental and sensing applications. ACS Sustainable Chemistry & Engineering9(30):9988-10015
- Mirzaei A, Hashemi B, Janghorban K (2016) α-Fe2O3 based nanomaterials as gas sensors. Journal of Materials Science: Materials in Electronics 27:3109-3144
- Hudry D, Griveau J.C, Apostolidis C, Walter O, Colineau E, Rasmussen G, Wang D, Chakravadhaluna V.S.K, Courtois E, Kübel C Meyer D (2014) Thorium/uranium mixed oxide nanocrystals: Synthesis, structural characterization and magnetic properties. Nano Research 7:119-131
- Batuk O.N, Szabó D.V, Denecke M.A, Vitova T, Kalmykov S.N (2013) Synthesis and characterization of thorium, uranium and cerium oxide nanoparticles. Radiochimica Acta 101(4):233-240
- Siebert L, Wolff N, Ababii N, Terasa M.I, Lupan O, Vahl A, Duppel V, Qiu H, Tienken M, Mirabelli M Sontea V (2020) Facile fabrication of semiconducting oxide nanostructures by direct ink writing of readily available metal microparticles and their application as low power acetone gas sensors. Nano Energy 70:104420
- Quispe L.T, Mamani L.L, Baldárrago-Alcántara A.A, Félix L.L, Goya G.F, Fuentes-García J.A, Pacheco-Salazar D.G, Coaquira, J.A (2022) Synthesis and characterization of α-Fe2O3 nanoparticles showing potential applications for sensing quaternary ammonium vapor at room temperature. Nanotechnology, 33(33):335704
- Teng Y, Zhang X.F, Xu T.T, Deng Z.P, Xu Y.M, Huo L.H, Gao S (2020) A spendable gas sensor with higher sensitivity and lowest detection limit towards H2S: porous α-Fe2O3 hierarchical tubule derived from poplar branch. Chemical Engineering Journal 392:123679
- Bigiani L, Zappa D, Maccato C, Gasparotto A, Sada C, Comini E, Barreca D (2019) Mn3O4 nanomaterials functionalized with Fe2O3 and ZnO: Fabrication, characterization, and Ammonia sensing properties. Advanced Materials Interfaces 6(24):1901239.
- Syaiful S (2018) IOP Conference Series: Materials Science and Engineering
- Muthukumaran P, Sumathi C, Wilson J, Sekar C, Leonardi S.G, Neri G (2014) Fe2O3/Carbon nanotube-based resistive sensors for the selective ammonia gas sensing. Sensor letters 12(1):17-23
- Laurent S, Boutry S, Muller R.N (2018) Metal oxide particles and their prospects for applications. In Iron oxide nanoparticles for biomedical application 3-42
- Zhang Q, Qian Z, Liu X, Li L, Duan X, Yu T, Liu X, Qiao Y (2022) Synthesis of Thorium Dioxide Nanocrystals via Molten Salt Thermal Decomposition for Nuclear Energy-Related Applications. ACS Applied Nano Materials 5(12):17977-17985
- Saoudi M, Hayes J.R, Lang J, Grosvenor A.P, Do T, Mouris J (2022) Oxidation behaviour of thorium-uranium mixed oxides in controlled oxidation experiments. Journal of Nuclear Materials 572:154047
- Reddy B.M, Bharali P, Saikia P, Thrimurthulu G, Yamada Y, Kobayashi T (2009) Thermal Stability and Dispersion Behavior of Nanostructured Ce x Zr1− x O2 Mixed Oxides over Anatase-TiO2: A Combined Study of CO Oxidation and Characterization by XRD, XPS, TPR, HREM, and UV− Vis DRS. Industrial & Engineering Chemistry Research 48(1):453-462
- Singh S.P, Singh A.K, Gupta J (2022) Synthesis of nickel-doped iron oxide nanoparticles by Co-precipitation method and investigation of its structural and opto-electronic properties. Materials Today: Proceedings 66:1890-1896
- Kashyap S.J, Sankannavar R, Madhu G.M (2022) Iron oxide (Fe2O3) synthesized via solution-combustion technique with varying fuel-to-oxidizer ratio: FT-IR, XRD, optical and dielectric characterization. Materials Chemistry and Physics 286:126118
- Ananthanarayanan D, Leon J.J.D, Wong J, Nicolay S, Aberle A.G, Ho J.W (2020) Mid-infrared characterization and modelling of transparent conductive oxides. Solar Energy 209:424-430
- Ridente E, Mamaikin M, Altwaijry N, Zimin D, Kling M.F, Pervak V, Weidman M, Krausz F, Karpowicz N (2022) Electro-optic characterization of synthesized infrared-visible light fields. Nature communications 13(1):1111
- Babitha K.K, Sreedevi A, Priyanka K.P, Sabu B, Varghese T (2015) Structural characterization and optical studies of CeO2 nanoparticles synthesized by chemical precipitation. Indian Journal of pure & applied physics 53(9):596-603
- Kiani D, (2023) X-Ray Diffraction (XRD). In Springer Handbook of Advanced Catalyst Characterization 519-539
- Ali A, Chiang Y.W, Santos R.M (2022) X-ray diffraction techniques for mineral characterization: A review for engineers of the fundamentals, applications, and research directions. Minerals 12(2):205
- Lassoued A, Dkhil B, Gadri A, Ammar S (2017) Control of the shape and size of iron oxide (α-Fe2O3) nanoparticles synthesized through the chemical precipitation method. Results in physics 7:3007-3015
- Kumar V, Ahlawat D.S, Islam S.A, Singh A (2021) Ce doping induced modifications in structural, electrical and magnetic behaviour of hematite nanoparticles. Materials Science and Engineering: B 272:115327
- Hwang S.W, Umar A, Dar G.N, Kim S.H, Badran R.I (2014) Synthesis and characterization of iron oxide nanoparticles for phenyl hydrazine sensor applications. Sensor Letters 12(1):97-101
- Huentupil Y, Cabello-Guzmán G, Chornik B, Arancibia R, Buono-Core G.E (2019) Photochemical deposition, characterization and optical properties of thin films of ThO2. Polyhedron 157:225-231
- Nguyen T.D, Do T.O (2011) Size-and shape-controlled synthesis of monodisperse metal oxide and mixed oxide nanocrystals. Nanocrystal 66:55-84
- Shirley B, Jarochowska E (2022) Chemical characterisation is rough: the impact of topography and measurement parameters on energy-dispersive X-ray spectroscopy in biominerals. Facies 68(2):7
- Shtewi F.A, Mohammed W, Abdulsalam A (2021) Green synthesis and characterization of iron oxide nanoparticles using MenthaPiperita leaves extract. International Science and Technology Journal 24:355-372.
- Ratnayake S, Lützenkirchen J, Finck N, Schild D, Heberling F, Gil-Díaz T, Dardenne K, Rothe J, Geckeis H (2023) Combined X-ray absorption and SEM–EDX spectroscopic analysis for the speciation of thorium in soil. Scientific Reports 13(1):5877
- Agarwal P.B, Paulchowdhury P, Mukherjee A, Lohani P, Thakur N.K (2022) Optimization of oxygen plasma based etching of single layered graphene through Raman and FESEM characterization. Materials Today: Proceedings 48:616-618
- Umar A, Abaker M, Faisal M, Hwang S.W, Baskoutas S, Al-Sayari S.A (2011) High-yield synthesis of well-crystalline α-Fe2O3 nanoparticles: structural, optical and photocatalytic properties. Journal of Nanoscience and Nanotechnology 11(4):3474-3480.
- Sahu S, Sahu U.K, Patel R.K (2019) Modified thorium oxide polyaniline core–shell nanocomposite and its application for the efficient removal of Cr (VI). Journal of Chemical & Engineering Data 64(3):1294-1304
- Varpe A.S, Deshpande M.D (2022) Effect of annealing temperature on optical, dielectric and NH3 gas sensing properties of ZnxFe3−xO4 (x= 0 and 0.5) nanoparticles synthesized by sol-gel auto-combustion method. Journal of Alloys and Compounds 892:162124
- Ho T.M, Abik F, Mikkonen K.S (2022) An overview of nanoemulsion characterization via atomic force microscopy. Critical Reviews in Food Science and Nutrition 62(18):4908-4928
- Mei L, Guan G (2022) Profilometry and atomic force microscopy for surface characterization. Nano TransMed 2(1):9130017
- Alsteens D, Gaub H.E, Newton R, Pfreundschuh M, Gerber C, Müller D.J (2017) Atomic force microscopy-based characterization and design of biointerfaces. Nature Reviews Materials 2(5):1-16
- Jiang X.C, Chen W.M, Chen C.Y, Xiong S.X, Yu A.B (2011) Role of temperature in the growth of silver nanoparticles through a synergetic reduction approach. Nanoscale Res Lett 6:1-9.
- Elgrishi N, Rountree K.J, McCarthy B.D, Rountree E.S, Eisenhart T.T, Dempsey J.L (2018) A practical beginner’s guide to cyclic voltammetry. Journal of chemical education 95(2):197-206
- Alizadeh T, Jahani R (2015) A new strategy for low temperature gas sensing by nano-sized metal oxides: Development a new nerve agent simulant sensor. Materials Chemistry and Physics 168:180-186.
- Patil V.B (2020) Metal Oxides Hetrostructure: An Efficient to NO2 Gas Detection. In Electrochemical Society Meeting Abstracts 28:2058-2058
- Gammal R.N, Elmansi H, El-Emam A.A, Belal F, Elzahhar P.A, Belal A.S, Hammouda M.E (2023) Green microwave quantum dots as luminescent probes for quantifying prucalopride: consistency of content and application to pharmacokinetic studies BMC chemistry 17(1):31
- Tsykhanovska I, Stabnikova O, Gubsky S (2022) Spectroscopic studies of interactions of iron oxide nanoparticles with Ovalbumin molecules. Materials Proceedings 9(1):2.
- S, Gurusamy, K, Krishnaveni, M, Sankarganesh, R.N, Asha, A, Mathavan, Journal of Molecular Liquids., 2022345, p.117045
- Velusamy P, Chia-Hung S, Shritama A, Kumar G.V, Jeyanthi V, Pandian K (2016) Synthesis of oleic acid coated iron oxide nanoparticles and its role in anti-biofilm activity against clinical isolates of bacterial pathogens. Journal of the Taiwan Institute of Chemical Engineers 59:450-456
- Bilcu M, Grumezescu A.M, Oprea A.E, Popescu R.C, Mogoșanu G.D, Hristu R, Stanciu G.A, Mihailescu D.F, Lazar V, Bezirtzoglou E, Chifiriuc M.C (2014) Efficiency of vanilla, patchouli and ylang ylang essential oils stabilized by iron oxide@ C14 nanostructures against bacterial adherence and biofilms formed by Staphylococcus aureus and Klebsiella pneumoniae clinical strains. Molecules 19(11):17943-17956
- Rahmah M.I, Saadoon N.M, Mohasen A.J, Kamel R.I, Fayad T.A, Ibrahim N.M (2021) Double hydrothermal ssynthesis of iron oxide/silver oxide nanocomposites with antibacterial activity. Journal of the Mechanical Behavior of Materials 30(1):207-212
Scheme 1 is available in the Supplementary Files section.
No competing interests reported.
- Scheme1.jpg
Scheme.1. Schematic diagram of iron thorium mixed metal oxide (FTMMO)