Microplastics are introduced into the environment through various means and pathways, and their origins can be difficult to identify as they often appear weathered and bear little resemblance to their original products. Nonetheless, analyzing their characteristics such as size, color, shape, and polymer type can provide clues to their source13. Microplastics come in diverse shapes and sizes when found in the environment14. Previous studies have detected various shapes of microplastics in the atmosphere, including fibers, foam, pieces, and film. In urban centers such as Dongguan, Shanghai, Yantai, and Paris, fibers were found to be the most predominant form of atmospheric microplastics (> 60%), while in Hamburg, fibers were also the most common form 15. Meanwhile, in street dust in Iran, fibers (33.5%) and granular microplastics (65.9%) were reported to be the most abundant forms 16,17.
Understanding the shape of microplastics can provide insights into their origins and pathways13,18. Our study focuses on anthropogenic microfibers, which are the most abundant type of microplastics found in many ecosystems19. They are commonly detected in air, sediment, and water samples20. According to Strady et al. (2020), anthropogenic microfibers include synthetic fibers of petrochemical origin (e.g. polyester, polyamide, polypropylene), cellulosic artificial fibers (e.g. viscose, rayon) and natural fibers (e.g. cotton, wool), primarily originating from synthetic clothing and washing21,22.
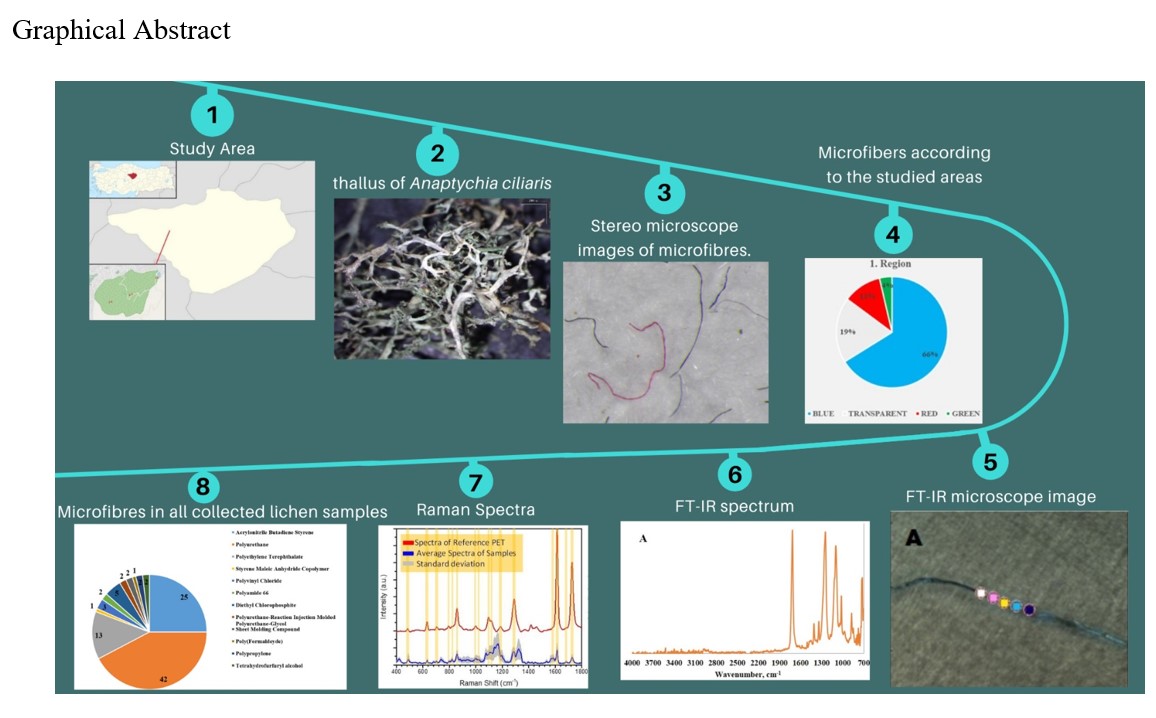
Microplastics are tiny plastic particles, measuring less than 5 mm, that are created when larger plastic items (such as bottles, bags, and clothing) break down due to biodegradation, UV radiation, and physical abrasion, or are produced at a microscopic scale4. Our research findings show that anthropogenic microfibers range in length from 0.15 to 4.2 mm (as shown in Fig. 1), which falls within the size range considered microplastic based on these measurements. When the fibers were compared according to their lengths, they were 4.2 mm in zone 1, 3.9 mm in zone 2 and 3 mm in zone 3 (as presented in Fig. 1).
Because Rose bengal is a biological stain that must be bonded to natural fibers, the unstained material is typically assumed to be synthetic. In our study, the Rose Bengal staining method was used to assist the identification procedure of plastic fibers. After staining, samples were analyzed for the presence of microfibres using a stereomicroscope (Fig. 2). Color of microplastics are often used as a means of identifying their origin13. In this regard, the colors of the microfibers that were identified were examined under a stereo microscope, and the color distributions in three different regions were displayed using graphics (Fig. 2,3). Previous research has indicated that microplastics can occur in a range of colors including transparent, crystalline, white, clear-white-cream, red, orange, pink, blue, dark blue, green, opaque, black, gray, brown, and yellow23. Based on our research, blue is the most prevalent color in all three regions followed by colorless, red and green in Region 1. In Region 2, red ranks second and colorless ranks third, while in Region 3, red and colorless are equally prevalent. Previous studies have also identified blue as the dominant color24. However, there is no conclusive information regarding the identification of the polymer type based on color.
To determine if an item is a microplastic, its shape and color are often used as a starting point25. However, to increase the accuracy of the identification results, spectroscopic analyses are necessary. Among these, FT-IR is becoming one of the most frequently used techniques due to its high reliability in the chemical characterization of microplastics from environmental samples 26,27. Another highly reliable technique for polymer identification of microplastics from different environmental matrices is Raman spectroscopy, which is also commonly employed 28.
In order to determine the polymer origin of the microplastics in the samples, we utilized a two-step approach. Firstly, the samples were analyzed using FT-IR spectrometers to elucidate the chemical content of the samples and we compared the obtained spectrums with FT-IR spectrometer comparative library databases and previous studies. Then, we used micro-Raman spectrometer to measure each individual sample and compared the results with reference polymers.
FT-IR microscope images and FT-IR spectrums were taken from 5 different points of the same microfibre sample. FT-IR microscope images of ABS, polyurethane, PET, styrene maleic anhydride copolymer, polyvinyl chloride and Polyamide 66 are shown in Fig. 4.
FT-IR spectrums of ABS, polyurethane, PET, styrene maleic anhydride copolymer, polyvinyl chloride, Polyamide 66 and polypropylene microfibres are shown in Fig. 5. In the FT-IR spectrum of PET, various characteristic vibration peaks of functional groups are identified, including 1717 cm− 1 for the C = O stretching of the carboxylic acid functional group, 1580 cm− 1 and 1506 cm− 1 for C = C stretching vibrations in the aromatic skeleton, and 1451 cm− 1, 1410 cm− 1, and 1340 cm− 1 for stretching of the C-O group deformation of the O-H group and bending and wagging vibrational modes for the ethylene glycol segment. Other peaks include 1250 cm− 1 for the terephthalate group vibration, 1099 cm− 1 and 1042 cm− 1 for the methylene group and vibrations of the ester C-O bond, 973 cm− 1, 876 cm− 1, and 849 cm− 1 for vibrations of aromatic rings tetra replaced, 795 cm− 1 for vibration of adjacent aromatic H in p-substituted aromatic bands, and 778 cm− 1 for the interaction of polar ester groups and benzene rings, respectively (Fig. 5A) 29.
For the FT-IR spectrum of polypropylene, C–CH3 stretching vibration peak is located at 838 cm− 1. –CH3 rocking vibration peaks is locatedin range of 972 cm− 1 and 1132 cm− 1. Symmetric bending and asymmetric stretching vibrations for –CH3 group is located at 1458 cm− 1 and 2854 cm− 1. Symmetric bending, and symetric/asymetric stretching vibration peaks for –CH2– are located at 1376, 2919 and 2921 cm− 1, respectively (Fig. 5B) 30.
In the FT-IR spectrum of polyurethane, the carbonyl band peak is typically observed at around 1737 cm–1 and 1653 cm–1, which can be attributed to the urethane and urea carbonyl groups. The NH bond stretching vibration of the urethane and urea groups is represented by the peak at 3340 cm–1. Other characteristic peaks include 2900 cm–1 due to the alkane -CH stretching vibration, 1161 cm–1 for the coupled C-N and C-O stretching vibrations, and 1057 cm–1 for the ester C-O-C symmetric stretching vibration (Fig. 5C) 31.
In the FT-IR spectrum of ABS, the aromatic and aliphatic C-H stretch modes are typically observed at around 3200–2800 cm− 1 range, the CN bond stretching vibration of acrylonitrile represented at 2254 cm− 1, the C = C stretching peak present, which can be attributed to the poly(butadiene) the aromatic ring in styrene is defined at 1633 cm− 1, 1493 cm− 1 and 1494 cm− 1, respectively. The C-H deformation for H copuled to alkenic carbons in poly(butadiene) are typically observed at 962 cm− 1 and 920 cm− 1 (Fig. 5D) 32.
For the FT-IR spectrum of Polyamide 66, characteristic vibration peaks are found at 3300 cm− 1 for N-H stretching vibration, 2933 cm− 1 for CH2 stretching vibration, 1639 cm− 1 for C = O stretching vibration in amide I, 1551 cm− 1 for NH bending vibration and 681 cm− 1 for N-H bending vibration (Fig. 5E) 33.
In the FT-IR spectrum of polyvinyl chloride, The symmetrical and asymmetrical stretching vibrations of the CH2 have two absorption peaks at 2938 cm− 1 and 2930 cm− 1. The absorption peaks around 1453 cm− 1 are due to to the C − H aliphatic bending bond. The peak at 1236 cm− 1 is due to the bending bond of C − H near Cl. The C − C stretching bond of the polyvinyl chloride backbone chain have peaks in the range 1000 − 1100 cm − 1 (Fig. 5F) 34.
In the FT-IR spectrum of styrene maleic anhydride copolymer (Fig. 8G), C-H stretching vibrations on the benzene ring and the saturated C-H bond have two peaks at 2900–3100 cm− 1. The symmetrical and asymmetrical stretching vibrations of the C = O bond in styrene maleic anhydride copolymer have two absorption peaks at 1745 cm− 1 and 1726 cm− 1 35.
The FT-IR analysis showed that microplastic residues were more abundant in samples collected near the city center than in distant locations. The identified MPs were analyzed using Raman spectroscopy to characterize them. Figure 6 shows the Raman spectra obtained from the pure PET standard sample and studied microplastic sample. The results obtained from Raman spectroscopy are consistent with FT-IR analysis, which revealed that PET microplastic particles have high densities. However, other microplastic particles could not be classified by Raman spectroscopy due to degradation caused by environmental factors. Polyurethane is commonly utilized in filling foams, thermal insulation foams, surface coatings, and printing cylinders, while acrylonitrile butadiene styrene finds wide application in electronics, automotive parts, and kitchenware. The Çamlık National Park, selected as the research site, is located near the city center, and the pond's surroundings serve as a picnic area where people gather for social activities such as visiting cafes, restaurants, and hotels. These observations provide hints about the possible sources of the microplastics detected in this region. Polyethylene terephthalate (PET, PET) is a commonly used polymer found in products such as soft drink and cooking oil bottles, which is how the name "PET bottle" originated 23,35. The diversity of microplastic particles sheds light on their possible origins and pathways into the environment. For instance, plastic debris, tire abrasion, and even road paint can be carried away by rainwater runoff. Microfibers from textile products can also be found in wastewater. Industrial spills and processes, as well as runoff and landfills, can also contribute to the presence of microplastics in the environment.
The literature reports that the most frequently found polymers in plastic waste are polypropylene (PP), polyethylene (PE), polyvinylchloride (PVC), polystyrene (PS), and polyethylene terephthalate (PET) (Andrady, 2011; Loppi 2021). The microplastic types we detected in the collected lichen samples are compatible with the literature 8,36.
Anthropogenic fibres were observed in all three regions where samples were collected, namely, group 1 closest to the city center, group 2 at a middle distance, and group 3 farthest away. A total of 95 anthropogenic fibres were identified, 49 from the first region, 31 from the second region, and 15 from the third region (Fig. 7–10). The percentage of microfibres analyzed in the studied samples is given in Fig. 10. Among of these microfibres, polyurethane, acrylonitrile butadiene styrene and polyethylene terephthalate were the most commonly identified types of microplastics, accounting for 42%, 25%, and 13%, respectively (Fig. 10).