Baseline characteristics
The mean age was 60.5±13.1 years, and 79.2% of the patients were men. Median duration of follow-up was 27 months (interquartile range, 10-41 months). One-year mortality was seen in 75 patients (7.1%). Table 1 shows the demographic and laboratory data measured at the time of presentation and intergroup comparison between the groups with or without 1-year mortality, defined henceforth as Mortality (+) or Mortality (-), respectively. Mortality (+) patients were significantly older and had lower blood pressure, higher pulse rate, lower body mass index, higher Killip class, and higher prevalence of anterior wall infarction. Regarding the laboratory findings, the Mortality (+) group showed significantly higher serum transaminases, lower albumin, higher glucose, lower estimated glomerular filtration rate, lower hemoglobin, higher white blood cell counts, and higher NLR. The HLI, dysglycemia, and anemia were significantly higher in the Mortality (+) group than in the Mortality (-) group (49.3 vs 20.3% for HLI, 44.0 vs. 12.8% for dysglycemia, 41.3 vs. 14.9% for anemia, respectively, all p <0.001). For predicting 1-year mortality, the cut-off value of NLR was determined to be 4.3, with a sensitivity and specificity of 66.7% and 65.2%, respectively (AUC, 0.681; 95% CI, 0.614-0.749, p<0.001). High NLR values (>4.3) were more frequent in the Mortality (+) group than those in the Mortality (-) group (68.0 vs 34.8%, respectively, p<0.001).
Table 1. Demographic and laboratory data
|
|
All
(n=1057)
|
Mortality (-)
(n=982)
|
Mortality (+)
(n=75)
|
p value
|
|
Demographic data
|
|
|
|
|
|
Age, years
|
60.5±13.1
|
59.7±12.9
|
70.8±11.0
|
<0.001
|
|
Men, n (%)
|
837 (79.2)
|
784 (79.8)
|
53 (70.7)
|
0.075
|
|
Body mass index, kg/m2
|
24.1±3.2
|
24.2±3.2
|
23.0±3.6
|
0.002
|
|
Diabetes mellitus, n (%)
|
279 (26.4)
|
250 (25.5)
|
29 (38.7)
|
0.020
|
|
Hypertension, n (%)
|
496 (46.9)
|
452 (46.0)
|
44 (58.7)
|
0.041
|
|
Systolic blood pressure, mmHg
|
125.1±27.3
|
126.3±26.7
|
109.0±30.8
|
<0.001
|
|
Diastolic blood pressure, mmHg
|
76.3±17.5
|
77.0±17.2
|
66.9±19.2
|
<0.001
|
|
Heart rate, beats/minute
|
77.5±20.1
|
76.7±19.5
|
87.3±25.0
|
0.001
|
|
Cardiogenic shock, n (%)
|
66 (6.2)
|
47 (4.8)
|
19 (25.3)
|
<0.001
|
|
Killip class II-IV, n (%)
|
209 (19.8)
|
168 (17.1)
|
41 (54.7)
|
<0.001
|
|
Anterior wall infarction, n (%)
|
564 (69.3)
|
512 (52.1)
|
52 (69.3)
|
0.004
|
|
Laboratory data
|
|
|
|
|
|
Albumin, g/dL
|
4.2±0.4
|
4.2±0.4
|
3.8±0.6
|
<0.001
|
|
Glucose, mg/dL
|
177.7±83.1
|
173.0±74.6
|
239.4±144.0
|
<0.001
|
|
Dysglycemia*, n (%)
|
159 (15.0)
|
126(12.8)
|
33 (44.0)
|
<0.001
|
|
Total bilirubin, mg/dL
|
0.7±0.4
|
0.7±0.4
|
0.7±0.5
|
0.245
|
|
AST, IU/L
|
33.0 (23.0-65.0)
|
32.0 (23.0-61.0)
|
72.0 (27.0-227.0)
|
<0.001
|
|
ALT, IU/L
|
26.0 (19.0-42.0)
|
26.0 (19.0-41.0)
|
36.0 (18.0-78.0)
|
0.034
|
|
Hypoxic liver injury†, n (%)
|
236 (22.3)
|
199 (20.3)
|
37 (49.3)
|
<0.001
|
|
ALP, IU/L
|
74.0 (61.0-91.1)
|
74.0 (61.0-90.0)
|
81.0 (65.0-98.0)
|
0.061
|
|
Creatinine, mg/dL
|
1.08±0.73
|
1.06±0.73
|
1.33±0.67
|
0.001
|
|
Estimated GFR, mL/min/1.73 m2
|
82.1±27.5
|
83.3±26.8
|
65.8±32.0
|
<0.001
|
|
Estimated GFR <60 mL/min/1.73 m2, n (%)
|
184 (17.4)
|
152 (15.5)
|
32 (42.7)
|
<0.001
|
|
Hemoglobin, mg/dL
|
14.2±1.9
|
14.3±1.9
|
13.1±2.4
|
<0.001
|
|
Anemia, n (%)
|
177 (16.7)
|
146 (14.9)
|
31 (41.3)
|
<0.001
|
|
WBC, X103/µL
|
12.0±5.2
|
11.8±5.2
|
13.9±4.7
|
0.001
|
|
NLR
|
3.1 (1.6-5.7)
|
3.0 (1.5-5.4)
|
5.4 (3.0-8.9)
|
<0.001
|
|
NLR >4.3, n (%)
|
393 (37.2)
|
342 (34.8)
|
51 (68.0)
|
<0.001
|
|
Total cholesterol, mg/dL
|
189.3±43.7
|
190.6±43.1
|
172.5±47.8
|
0.001
|
|
LDL-cholesterol, mg/dL
|
117.0±36.8
|
117.8±36.7
|
106.6±37.0
|
0.043
|
|
HDL-cholesterol, mg/dL
|
42.5±11.0
|
42.6±10.9
|
41.0±11.7
|
0.305
|
|
Triglyceride
|
129.0 (86.0-196.0)
|
131.0 (87.0-197.0)
|
111.0 (76.5-180.5)
|
0.100
|
|
Initial CK-MB, ng/mL
|
5.3 (2.1-26.5)
|
4.9 (2.1-22.5)
|
26.0 (3.6-96.1)
|
<0.001
|
|
Peak CK-MB, ng/mL
|
177.4 (78.2-300.0)
|
170.9 (77.8-300.0)
|
271.0 (86.0-332.2)
|
0.016
|
AST, aspartate transaminase; ALT, alanine transaminase; ALP, alkaline phosphatase; GFR, glomerular filtration rate; WBC, white blood cell; NLR, neutrophil to lymphocyte ratio; CK-MB, creatine kinase-myocardial band isoenzyme
*Dysglycemia was defined as serum glucose <90 or >250 mg/dL.
†Hypoxic liver injury was defined as an elevation of serum transaminases levels more than twice the upper limit of normal.
Angiographic, procedural, and echocardiographic data is summarized in Table 2. Although baseline TIMI flow grade was similar between the two groups, the final TIMI flow grades and procedural success rates were significantly lower in the Mortality (+) group. The Mortality (+) group also had longer door-to-balloon time and symptom-to-balloon time. Further, the left ventricular ejection fraction was significantly lower in the Mortality (+) group than that in the Mortality (-) group (35.7 vs. 48.0%, respectively, p<0.001).
Table 2. Angiographic, procedural and echocardiographic data
|
|
All
(n=1057)
|
Mortality (-)
(n=982)
|
Mortality (+)
(n=75)
|
p value
|
|
Angiographic and procedural data
|
|
|
|
|
|
Infarct related artery, n (%)
|
|
|
|
NA
|
|
Left main
|
8 (0.8)
|
2 (0.2)
|
6 (8.0)
|
|
|
Left anterior descending
|
556 (52.6)
|
510 (51.9)
|
46 (61.3)
|
|
|
Left circumflex
|
95 (9.0)
|
90 (9.2)
|
5 (6.7)
|
|
|
Right coronary
|
398 (37.7)
|
380 (38.7)
|
18 (24.0)
|
|
|
Extent of coronary artery disease, n (%)
|
|
|
|
0.257
|
|
1-vessel
|
404 (38.2)
|
382 (38.9)
|
22 (29.3)
|
|
|
2-vessel
|
364 (34.4)
|
334 (34.0)
|
30 (40.0)
|
|
|
3-vessel
|
289 (27.3)
|
266 (27.1)
|
23 (30.7)
|
|
|
Baseline TIMI flow grade, n (%)
|
|
|
|
0.840
|
|
0-2
|
950 (90.0)
|
884 (90.1)
|
66 (89.2)
|
|
|
3
|
105 (10.0)
|
97 (9.9)
|
8 (10.8)
|
|
|
Final TIMI flow grade, n (%)
|
|
|
|
<0.001
|
|
0-2
|
163 (15.5)
|
134 (13.7)
|
29 (39.2)
|
|
|
3
|
892 (84.5)
|
847 (86.3)
|
45 (60.8)
|
|
|
Stent number, n
|
1.1±0.3
|
1.1±0.3
|
1.2±0.5
|
0.036
|
|
Stent diameter, mm
|
3.09±0.38
|
3.10±0.38
|
2.95±0.40
|
0.002
|
|
Stent length, mm
|
27.1±10.5
|
26.8±10.3
|
31.0±13.3
|
0.012
|
|
Door-to-balloon time, min
|
72.0 (58.0-87.0)
|
71.0 (58.0-87.0)
|
80.0 (64.5-89.0)
|
0.012
|
|
Symptom-to-balloon time, min
|
210.0 (135.0-407.5)
|
206.0 (133.0-381.3)
|
296.0 (180.0-570.0)
|
0.001
|
|
Procedural success, n (%)
|
892 (84.5)
|
847 (86.3)
|
45 (60.8)
|
<0.001
|
|
Echocardiographic data
|
|
|
|
|
|
LVEF, %
|
47.3±12.0
|
48.0±11.5
|
35.7±14.9
|
<0.001
|
|
LVEDD, mm
|
51.4±5.0
|
51.4±5.0
|
51.2±4.8
|
0.897
|
|
E/E’
|
11.9±5.2
|
11.8±5.2
|
12.8±4.7
|
0.564
|
NA, not available; TIMI, Thrombolysis in Myocardial Infarction; LVEF, left ventricular ejection fraction; LVEDD, left ventricular end-diastolic dimension
Predictors of 1-year mortality
In the multivariate Cox regression analysis, age, systolic blood pressure <100 mmHg, Killp class II-IV, left ventricular ejection fraction <40%, and anterior wall infarction were significant and were independent predictors for 1-year mortality (Table 3). Among the TIMI risk score variables, history of diabetes mellitus, hypertension, or angina, heart rate, body weight, and ischemia time were not significant risk factors in the multivariate analysis. However, HLI, dysglycemia, anemia, and high NLR were all independently associated with increased risk of 1-year mortality.
Table 3. Predictors for 1-year all-cause death
|
|
Univariate analysis
|
Multivariate analysis
|
|
Variables
|
HR
|
95% CI
|
p value
|
HR
|
95% CI
|
p value
|
|
Age (per 10-year-old increase)
|
1.960
|
1.621-2.370
|
<0.001
|
1.416
|
1.097-1.828
|
0.008
|
|
Male
|
0.610
|
0.371-1.003
|
0.051
|
1.783
|
0.802-3.962
|
0.156
|
|
Body weight <67 kg
|
1.807
|
1.123-2.907
|
0.015
|
1.555
|
0.735-3.291
|
0.249
|
|
Diabetes mellitus
|
1.824
|
1.146-2.903
|
0.011
|
1.062
|
0.496-2.272
|
0.878
|
|
Hypertension
|
1.655
|
1.045-2.621
|
0.032
|
0.970
|
0.489-1.923
|
0.930
|
|
Systolic BP <100 mmHg
|
4.459
|
2.770-7.178
|
<0.001
|
2.568
|
1.357-4.860
|
0.004
|
|
Heart rate >100 beats/minute
|
3.022
|
1.796-5.085
|
<0.001
|
1.239
|
0.548-2.802
|
0.606
|
|
Killip class II-IV
|
5.445
|
3.455-8.581
|
<0.001
|
2.426
|
1.367-4.303
|
0.002
|
|
LVEF <40%
|
5.080
|
2.981-8.658
|
<0.001
|
1.889
|
1.008-3.541
|
0.047
|
|
Anterior wall infarction
|
2.061
|
1.261-3.366
|
0.004
|
2.084
|
1.056-4.114
|
0.034
|
|
Multivessel disease
|
1.526
|
0.928-2.509
|
0.095
|
1.047
|
0.511-2.144
|
0.900
|
|
Post-TIMI flow <3
|
3.782
|
2.371-6.032
|
<0.001
|
1.843
|
1.006-3.379
|
0.048
|
|
Hypoxic liver injury*
|
3.631
|
2.308-5.710
|
<0.001
|
2.019
|
1.104-3.695
|
0.023
|
|
Dysglycemia†
|
5.008
|
3.173-7.904
|
<0.001
|
2.535
|
1.324-4.855
|
0.005
|
|
Anemia
|
3.702
|
2.338-5.863
|
<0.001
|
2.071
|
1.093-3.923
|
0.026
|
|
NLR >4.3
|
3.796
|
2.336-6.166
|
<0.001
|
3.651
|
1.927-6.918
|
<0.001
|
|
Estimated GFR <60 mL/min/1.73 m2
|
3.879
|
2.454-6.131
|
<0.001
|
0.791
|
0.364-1.720
|
0.554
|
|
Peak CK-MB (log)
|
1.637
|
0.951-2.821
|
0.075
|
1.228
|
0.618-2.441
|
0.558
|
|
Symptom to balloon time >4 hours
|
2.094
|
1.316-3.333
|
0.002
|
1.477
|
0.731-2.988
|
0.277
|
HR, hazard ratio; CI, confidence interval; BP, blood pressure; LVEF, left ventricular ejection fraction; NLR, neutrophil to lymphocyte ratio; GFR, glomerular filtration rate; CK-MB, creatine kinase-myocardial band isoenzyme; ALP, alkaline phosphatase
*Hypoxic liver injury was defined as an elevation of serum transaminase level more than twice the upper limit of normal.
†Dysglycemia was defined as serum glucose <90 or >250 mg/dL.
Prognostic value of HLI, dysglycemia, NLR, and anemia over the TIMI risk score
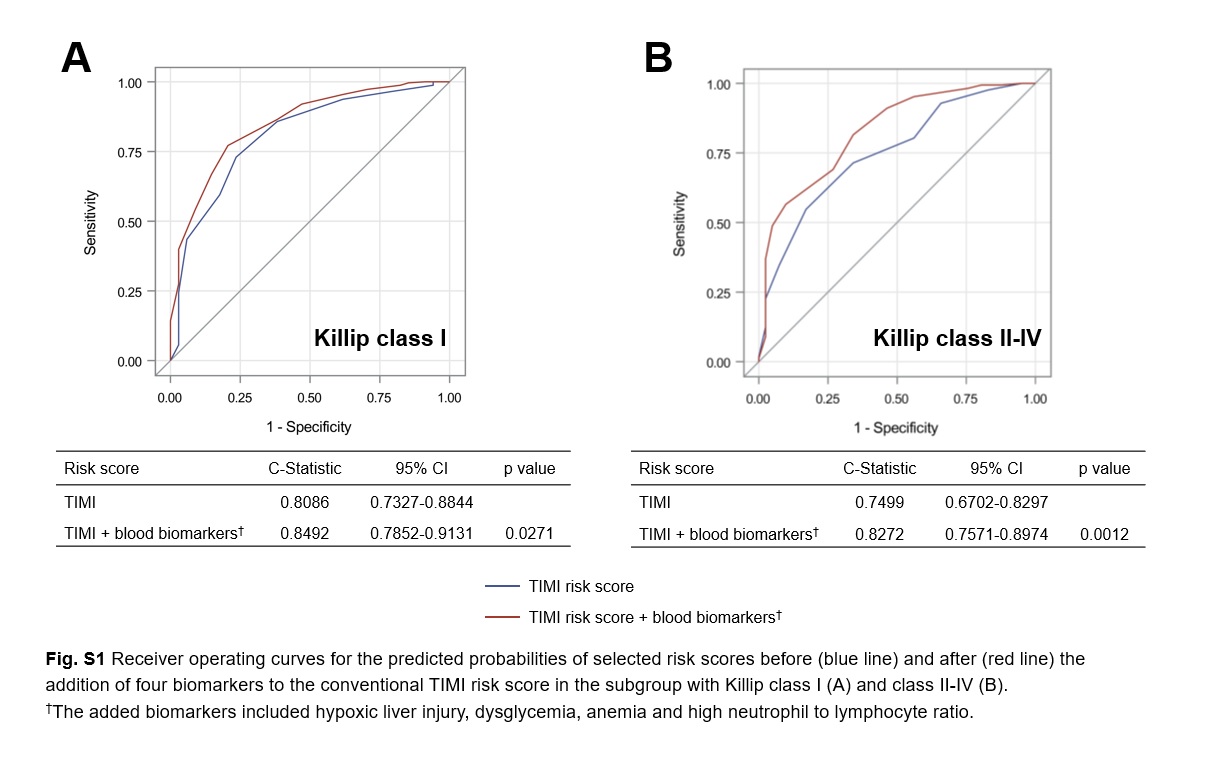
The overall discriminatory ability in predicting the 1-year mortality was reasonable for TIMI risk score (c-statistic, 0.841; 95% CI, 0.796-0.886). The addition of HLI, dysglycemia, NLR, and anemia to the TIMI risk score significantly improved the c-statistic (from 0.841 to 0.876, p<0.001; Fig. 1). The incremental improvement of the c-statistics was confirmed in each subgroup with Killip class I and class II-IV (Additional file 1: Figure S1). Table 4 shows reclassification for patients who died and those who did not, across 3 strata risks for 1-year mortality. When incorporating blood biomarkers, the risk reclassification was more accurate in 265 (27.0%) and less accurate in 66 (6.7%) patients, among a total of 982 patients of the Mortality (-) group (net improvement, 20.3%). However, addition of blood biomarkers to the TIMI risk score did not improve the reclassification of the Mortality (+) group (net improvement, 0.0%). Overall the NRI and IDI for predicting 1-year mortality using blood biomarkers plus TIMI risk score were 0.203 (95% CI, 0.130-0.275; p<0.001) and 0.089 (95% CI, 0.060-0.119; p<0.001), respectively.
Table 4. Reclassification among patient who died and those who did not die at 1-year after ST-segment elevation myocardial infarction using the routinely measured blood biomarkers over the TIMI risk score
|
|
Model using blood biomarkers† plus TIMI risk score
|
|
1-year mortality
|
Low risk
(<1%)
|
Moderate risk
(1-5%)
|
High risk
(>5%)
|
Total
|
|
Model using TIMI risk score
|
|
|
|
|
|
No Events
|
|
|
|
|
|
Low risk (<1%)
|
176 (88.44)
|
23 (11.56)
|
0 (0)
|
199
|
|
Moderate risk (1-5%)
|
164 (37.88)
|
226 (52.19)
|
43 (9.93)
|
4331
|
|
High risk (>5%)
|
0 (0)
|
101 (28.86)
|
249 (71.14)
|
350
|
|
Total
|
340
|
350
|
292
|
982
|
|
Events
|
|
|
|
|
|
Low risk (<1%)
|
1 (100.0)
|
0 (0)
|
0 (0)
|
1
|
|
Moderate risk (1-5%)
|
1 (12.50)
|
4 (50.0)
|
3 (37.50)
|
8
|
|
High risk (>5%)
|
0 (0)
|
2 (3.03)
|
64 (96.97)
|
66
|
|
Total
|
2
|
6
|
67
|
75
|
|
NRI = 0.203 (95% CI 0.130-0.275)
IDI = 0.089 (95% CI 0.060-0.119)
|
|
|
|
|
NRI, net reclassification improvement; IDI, integrated discrimination improvement
†The blood biomarkers included hypoxic liver injury, dysglycemia, anemia, and high neutrophil to lymphocyte ratio.