3.1 EC
TDS and EC give information about the presence of concentration of salt in water. In the present study EC varies in the range of 42 to 1754µS/cm and mean value is 376.15µS/cm. The maximum values of EC are consistently supported by various studies in the literature. Moreover, investigations into groundwater in Angul district, Odisha, reveal a significant spectrum of electrical conductance, ranging between 94 and 2195 µScm− 1 (Keesari et al, 2019). Over 90.3% of the sampled groundwater, the EC measurement fell below 750 µScm− 1, categorizing them as "B" according to acceptability standards (BIS, 2012).
The upper threshold for EC in drinking water is set at 1400 µS cm− 1 (Singh et al, 2008). Two samples from the dataset surpassing this benchmark. However, none of the groundwater samples surpassed the recommended EC limit for agricultural purposes set by the Bureau of Indian Standards (BIS, 2012) which is categorized as group D. This value is set at 2250 µS cm− 1 (Zeid et al, 2018). Typically, elevated levels of electrolyte concentration in water tend to elevate its electrical conductivity. Within the study locations, salinity primarily stems from the dissolution of halite deposits, a process further exacerbated by prolonged irrigation practices.
Research conducted by Gomez (2020) examined groundwater quality within Argentina and found a wide range of EC values, spanning from 228–6770 µS cm− 1.Shiva Shakti Sponge Iron Ltd., Sukruli, NICCO Industries Ltd., Swayam Sampurna Producer Company Limited, Karanjia Farmers Producer Company Limited, and Bhanjabhumi Farmers Producer Company Limited are entities operating within or associated with the industrial and agricultural sectors in this region. The elevated level of EC may be attributed to industrial activities. Industries discharge significant volumes of wastewater back into the rivers. This wastewater often contains suspended solids, elevated levels of TDS, ash particles, phosphorus compounds, fluorides, ammonia, urea, and various acidic substances.
The chloride concentration exhibited a range of variation from 14.05 to 596.4 mg/l, aligning well with findings documented in existing literature. For instance, studies by Wang reported chloride levels ranging from 15.57 to 523.11 mg/l (Wang et al., 2019), while research conducted by Hossain and Patra documented chloride concentrations spanning from 1.6–317.9 mg/l (Hossain and Patra 2020). Approximately, 97.02% of water samples collected from the study area consisted of less than 250mg/l as the maximum permissible limit set by BIS standards. The pattern observed in chloride distribution closely mirrors that of electrical conductivity, indicating a probable geogenic origin attributed to chloride-rich mineral interactions with groundwater. Elevated chloride levels in select groundwater samples may result from various anthropogenic activities. These include the extensive application of pesticides and herbicides in agricultural practices, septic tank seepage, landfill leachate infiltration, and discharge from industrial operations. These pollutants percolate through the soil and ultimately contaminate the groundwater, contributing to increased chloride concentrations.
3.2 Fluoride
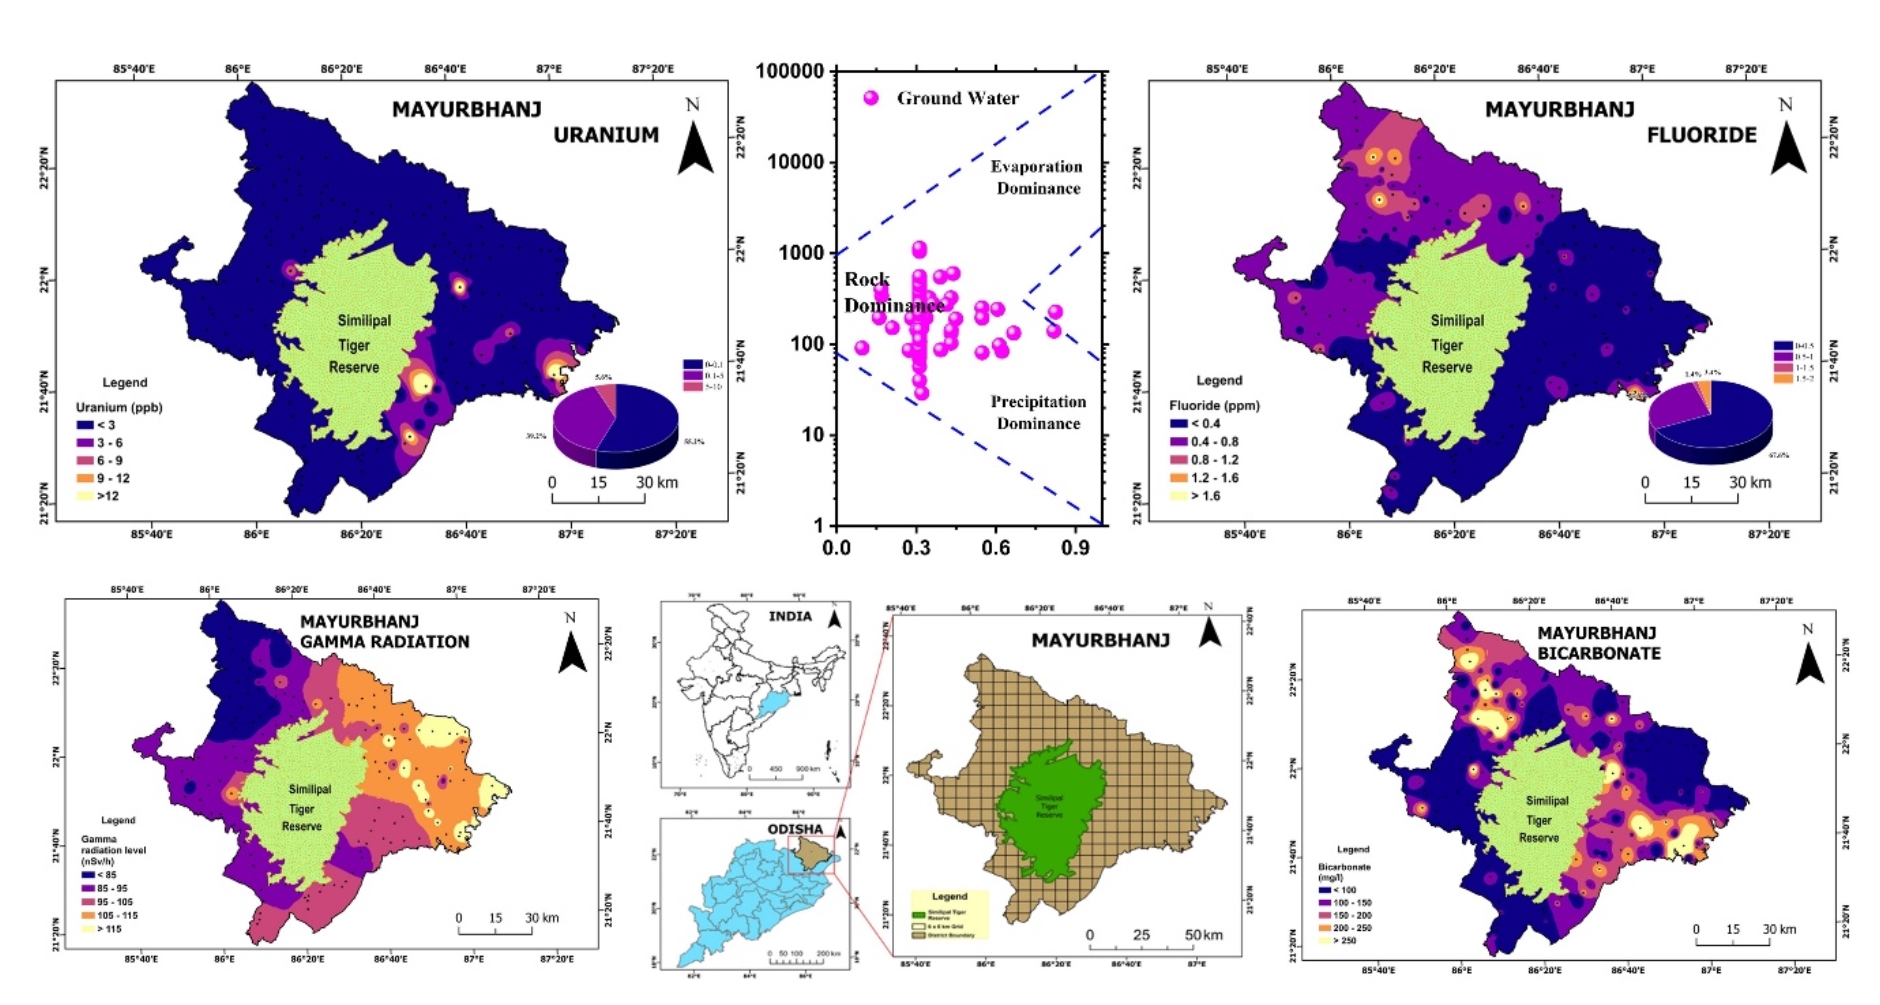
Typically, in drinking water, fluoride concentrations below 0.5 mg/l are associated with an increased risk of dental caries, while levels exceeding 1.5 mg/l may lead to dental and skeletal fluorosis (Craig et al., 2015). In the current work, it is observed that 3.4% of the water sample collected has fluoride concentration above 1.0 mg/l exceeding the BIS standard permissible limit and 65% of the samples were observed to have fluoride concentration below 0.5 mg/l which is a deficient amount. The fluoride concentration median value of 0.35 mg/l in the study area suggests that the water quality regarding fluoride levels is within a range that is generally considered safe for consumption. This concentration falls below the threshold associated with dental fluorosis and skeletal issues. However, it's essential to continue monitoring fluoride levels to ensure they remain within acceptable limits. This concentration falls below the threshold associated with dental fluorosis and skeletal issues. The elevated fluoride concentration observed in the study area may stem from various factors, including the application of nitrogenous fertilizers along with pesticides, as well as the dissolution of sedimentary rocks under alkaline pH conditions. Similar trends regarding the leaching of nitrogenous fertilizers leading to increased fluoride levels in groundwater have been documented by various researchers. Moreover, these findings align with numerous reports indicating that fluoride contamination in Mayurbhanj district is primarily attributed to geological processes such as rock and mineral weathering. Figures 2a, 2b, and 2c depict the spatial distribution of fluoride within the district, along with a pie chart and histogram showcasing the frequency distribution of fluoride levels.
3.3 Nitrate, phosphate and sulphate
One of redox responsive predominant water quality parameters is nitrate. The minimum to maximum range of nitrate concentration in the study area is 0.1 to 21.2 mg/l. All the samples of the study area contain nitrate concentration below 45 mg/l which is the maximum permissible limit as per BIS standards. Similar results of nitrate concentration 2.80 to 12.18mg/l were observed in Beijing city as reported by Huan (Huan et al., 2020), Kohn documented nitrate concentration as 12.5 to 17.4 mg/l in agriculture intensive area of Alberta (Kohn et al, 2016), Canada and recent global studies have documented nitrate concentrations ranging from 2 to 28 mg/L in the vicinity of the Roundhill landfill in South Africa (Nyika et al., 2019). Exceeding 45 mg/L of nitrate in drinking water can lead to blue baby syndrome or methemoglobinemia in infants, while higher concentrations may contribute to serious health issues like multiple sclerosis and thyroid problems.
The sulphate concentration in the study area was found in the range of 2.56 to 217 mg/l. Except two samples, all the water samples collected from the study area were below the standard limit as per WHO i.e. 200 mg/l (WHO, 2011). The elevated levels of sulphate may be linked to the breakdown of minerals containing sulphates. Comparable levels of sulphate concentration have been documented in various studies, ranging from 1.2 to 207 mg/l, 50 to 132 mg/l (Sahoo et al., 2016) and 25.5 to 256 mg/l (Wang et al., 2019. The concentration of phosphate in the study area is observed in the range of 1.12 to 7.35 mg/l (Kesari et al, 2019. Most of the samples show very slight deviation from the maximum permissible limit set by WHO and BIS. In certain groundwater samples, the elevated concentration of sulphate may be linked to various factors such as industrial activities, including mining and manufacturing processes, which can release sulphate-containing compounds into the groundwater. Additionally, natural geological processes such as the weathering of rocks and minerals rich in sulphates could contribute to elevated sulphate levels. Agricultural practices, particularly the use of certain fertilizers containing sulphates, and the decomposition of organic matter in soil may also play a role in increasing sulphate concentrations in groundwater. Furthermore, urban runoff and wastewater discharge from domestic sources and industries can introduce sulphates into groundwater systems, thereby contributing to elevated sulphate levels.
3.4 Hardness
In the collected water samples the total hardness was observed within the range of 60 to 890 mg/l. The concentration of magnesium and calcium was found within the range of 10 to 700 mg/l and 20 to 600 mg/l respectively. As per WHO the permissible limit of hardness in water is 100 mg/l and according to BIS, it is 200 mg/l (WHO, 2011). Approximately 33% of water sample were found to exceed 200 mg/l of total hardness in the study area.
In some parts of the study area, elevated levels of multivalent cations in the water may be attributed to the geological composition of sedimentary rocks prevalent in the region. These sedimentary rocks, which are abundant in various parts of the district, contain minerals rich in multivalent cations such as calcium, magnesium, and iron. Weathering and erosion of these rocks release these cations into the surrounding soil and water bodies, thereby increasing the concentration of multivalent cations in the water. Additionally, natural geological processes, including the dissolution of minerals and groundwater interactions with rock formations can further contribute to the presence of multivalent cations in the water sources.
Generally, the hardness of water tends to rise as a result of various factors such as leaching from soil and rock formations. Additionally, human activities like surface runoff and seepage can contribute to increased hardness levels by introducing minerals into water sources. Moreover, seasonal variations, particularly during summer may lead to elevated hardness levels in certain groundwater samples. This could be attributed to factors such as increased evaporation and reduced water volume, resulting in higher concentrations of dissolved minerals. For instance, decreased water volume can lead to higher mineral concentrations due to the reduced dilution effect. Furthermore, chemical processes within the aquifer systems, such as ion exchange and dissolution of mineral deposits, can also influence water hardness. Similar findings regarding hardness profiles, ranging from 43 to 672 mg/l (Naik et al,2022), were reported by previous studies in the Angul and Talcher zones of Odisha.
3.5 Alkalinity
Alkalinity in the water samples was observed in the range of 10 to 1077.39 mg/l. Bicarbonate alkalinity predominates over the carbonate alkalinity in the study area. Elevated bicarbonate concentrations in the water have been observed to promote the dissolution and weathering processes of minerals such as various metamorphic and sedimentary rocks.
When the bicarbonate concentration surpasses 400 mg/l, it tends to expedite the weathering and dissolution processes of both metamorphic and sedimentary rocks. Comparable groundwater alkalinity profiles have been documented in various literature sources from different regions of India. For instance, 205–543 mg/l (Sahoo et al., 2016), 153–475 mg/l (Saxena and Saxena et al, 2015) and 22.67 to 408 mg/l (Kumar et al, 2015). The pH median value in the study area was found to be 7.03 which suggests the water samples are not alkaline in nature and contain lesser quantity of carbonate. Figure. 3 depicts the spatial distribution of bicarbonate within the district.
The pH profile observed in the study area aligns with findings reported in other literature sources. For example, Kumar et al. (2015) recorded pH values ranging from 6.60 to 7.10, while Sahoo et al. (2016) reported pH levels between 7 and 7.3. Additionally, Saxena and Saxena (2015) documented pH ranges spanning from 7.0 to 8.1.
3.6 Gamma radiation
The terrestrial gamma radiation within the range of 8 to 130 nSv/h has been observed. This background radiation may originate from the decay of radioactive nuclei present in the geological formations of the area. Consequently, a more comprehensive and thorough investigation is imperative to elucidate the underlying factors contributing to these observed fluctuations. The spatial distribution of gamma radiation is shown in the Fig. 4.
3.7 Uranium
The uranium concentration in water samples in the study area was found in the range of < 0.2 to 35.4 ppb. Approximately 46.4% of water samples fall below the detection limit i.e. less than 0.2 ppb. The maximum permissible limit for Uranium in drinking water is 0.03 ppb as per WHO (WHO,2011); 60 ppb as per AERB and BIS (Sahoo et al, 2020, Prasad et al, 2022). The locations from where the collected water has higher uranium concentration as per WHO but less as per AERB and BIS guidelines are Bharadasahi (16.78 ppb), Adaghutu (35.4 ppb), Ambagadia (26.07 ppb), Dhanapur (21.03 ppb). Typically, in groundwater, uranium concentration tends to rise in the direction of water flow which was reflected from the uranium concentration in various regions in the district. The Budhabalanga River, known as the old Balanga, originates from the Similipal hills and cascades down the famous Barehipani waterfall, India's second-highest waterfall which is present in the Similipal National Park. It flows north to the village of Karanjiapal, then northeast along a railway track to Jhankapahadi, where it turns south and joins the Katra nala after being joined by tributaries like Palpala and Chipat. Finally, it passes through Baripada before reaching Balasore district and emptying into the Bay of Bengal. The presence of uranium in this study area can be attributed to geological factors. It has geological formations that contain uranium-bearing minerals. Uranium is naturally occurring and is often found in certain types of rocks and sediment. The high concentration in few samples can also be due to presence of high calcium hardness in the range of (20 to 600 mg/l) which interferes the uranium dissolving properties and decreases the uranium movement in groundwater. The study area has also high bicarbonate alkalinity (1314 mg/l). This phenomenon can be elucidated by the notable correlation between elevated concentrations of bicarbonate alkalinity and the facilitation of mineral dissolution, consequently augmenting the uranium content within groundwater reservoirs. It is noteworthy that all discerned occurrences remained comfortably within the stringent drinking water thresholds as per the Atomic Energy Regulatory Board (AERB, DAE 2004), the preeminent national nuclear regulatory authority. Figures 5a, 5b, and 5c depict the spatial distribution of fluoride within the district, along with a pie chart and histogram showcasing the frequency distribution of fluoride levels respectively.
3.8 Descriptive statistical analysis of data
From the evaluation of descriptive statistics of the water sample in the study area it is known that EC, TDS, calcium, magnesium, bicarbonate, total alkalinity and total hardness has the highest mean concentration. The skewness values of the majority of water samples fall within the acceptable range. Standard deviations of ± 2 from the mean, indicate a relatively symmetrical distribution for the measured parameters except for uranium which is higher than that standard value which reveals that the data are skewed slightly (Islam et al., 2018). The higher deviation is observed for TDS, EC, calcium and bicarbonate. Here it is found that the positive skewness is observed by TDS, EC, ORP, salinity, fluoride, chloride, nitrate, sulphate, uranium and magnesium hardness. From the kurtosis value it can be revealed that there are no Mesokurtic variables (values equal to three 0. Platykurtic variables (values less than 3) are TDS, EC, ORP, fluoride, phosphate, chloride, total hardness, calcium hardness, magnesium hardness, total alkalinity, carbonate and bicarbonate. Leptokurtic variables (values higher than 3) are uranium, sulphate, salinity, fluoride, and nitrate. Table 2 shows descriptive statistics for 145 samples.
Table 2
Descriptive statistics of the Mayurbhanj district for 145 samples
| Variable | Minimum | Maximum | Mean | Median | Std. deviation | Variance | Skewness | Kurtosis | BIS/WHO |
| pH | 5.4000 | 7.7000 | 7.1938 | 7.2700 | 0.4414 | 0.1948 | -2.11 | 5.69 | 7-8.5 |
| TDS (ppm) | 30 | 663.0 | 261.3 | 236.0 | 135.0 | 18212.5 | 0.71 | 0.24 | 1000 |
| EC (µS/cm) | 42 | 1754 | 402.9 | 354.0 | 228.6 | 52244.4 | 0.85 | 0.69 | 500 |
| ORP (mV) | -114.70 | 113.00 | -29.74 | -38.70 | 47.44 | 2250.93 | 1.13 | 1.59 | - |
| Salinity (ppm) | 21 | 877 | 2013 | 177 | 114 | 26,122 | 0.42 | 0.34 | - |
| DO (ppm) | 4.5 | 8.6 | 1.1059 | 1.0200 | 0.2477 | 0.0614 | 1.36 | 4.24 | - |
| F− (ppm) | 0.0400 | 1.7700 | 0.5964 | 0.4600 | 0.4359 | 0.1900 | 0.94 | -0.03 | 1.5 |
| Cl− (ppm) | 17.75 | 266.25 | 74.83 | 60.35 | 53.20 | 2830.13 | 1.83 | 3.28 | 250 |
| NO3− (mg/l) | 0.200 | 13.600 | 3.254 | 2.700 | 2.382 | 5.673 | 2.09 | 6.21 | 45 |
| SO42− (mg/L | 20.50 | 89.42 | 30.72 | 24.56 | 13.41 | 179.74 | 2.47 | 7.34 | 200 |
| PO43− (mg/l) | 1.1290 | 1.3920 | 1.2786 | 1.2920 | 0.0752 | 0.00566 | -0.47 | -0.72 | - |
| U (ppb) | 0 | 7.298 | 0.660 | 0.270 | 1.239 | 1.534 | 3.44 | 12.88 | 30 |
| Total hardness (mg/l) | 90.0 | 710.0 | 292.4 | 280.0 | 127.7 | 16301.3 | 0.92 | 0.72 | 100 |
| Calcium hardness (mg/l) | 50.00 | 510.00 | 182.10 | 150.00 | 102.35 | 10475.85 | 1.32 | 1.69 | 75 |
| Magnesium hardness (mg/l) | 10.00 | 370.00 | 115.94 | 100.00 | 83.58 | 6986.25 | 1.11 | 1.08 | 30 |
| Total alkalinity (mg/l) | 20 | 480.98 | 133.69 | 109.02 | 97.23 | 9454.48 | 0.90 | 0.25 | 200 |
| Carbonate (mg/l) | 25 | 288.58 | 81.69 | 65.41 | 60.05 | 3606.57 | 0.90 | 0.26 | - |
| Bicarbonate (mg/l) | 25 | 586.79 | 163.09 | 133.00 | 118.63 | 14072.21 | 0.90 | 0.26 | |
3.9 Health risk assessment
The HQ (health quotient) value due to fluoride concentration was calculated to be in the range of 0.43 to 0.49 for children and 0.23 to 0.26 for adults. The result shows that the collected water samples overall have minimum health risk as the HQ value are lower than 1 (Ahada and Suthar 2019). Further, HQ value due to nitrate concentration was found in the range of 0.002 to 0.6 for children and 0.001 to 0.33 for adults. The HQ value of nitrate also suggests no significant health risk associated with water sample due to nitrate. Though there are fewer health risk but HQ values are slightly higher for children in comparison to adults showing that children are more vulnerable to health risk due to pollutions and contaminations in comparison to adults.
3.10 Principal component analysis and variance of water quality parameters
Bartlett's and Kaiser-Meyer-Olkin, indicated that the collected water samples were suitable for individual parameter analysis, with a value of 0.64 exceeding the standard threshold of 0.5 (Naik et al, 2022b). The scree plot shown in Fig. 7 shows five principal components have eigen value more than 1. It reveals that five principal components account for 73.43% of the total variance of the data set. PC1 accounts for 33.48% of water quality variance with eigen value of 7.05, PC2 accounts for 12.7% of variance with eigenvalue of 2.04, PC3 accounts for 10.8% of variance with eigen value 1.73, PC4 accounts for 9.05% with eigen value of 1.44 and PC5 accounts for 7.24% with eigen value of 1.1. The loading biplot provided below illustrates the relationship between the first two principal components, which contribute significantly to the overall variance of water quality. Vectors are utilized to represent various hydrological parameters, demonstrating their correlation and contribution to the principal components. This visualization aids in understanding the complex interplay between different water quality indicators and their impact on the principal components. The direction and length of each vector in the loading biplot indicate both the magnitude and direction of the contribution of each variable to the two principal components. Longer vectors represent variables with higher contributions to the principal components, while the direction of the vector reflects the correlation between the variable and the principal components. Thus, the loading biplot provides a visual representation of the relative importance of each variable in explaining the variance observed in the data along the principal components. In the loading biplot shown in Fig. 6 for the study area, the first principal component in the horizontal axes has positive coefficients for carbonate, chloride, bicarbonate, total alkalinity, calcium hardness, magnesium hardness, TDS, EC, fluoride. The total variance for significant component having Eigen value more than 1 is shown in Table 3.
Table 3
Total variance for significant component having Eigen value more than 1
| Component | Rotation sums of squared loadings |
| | Total eigen value | % of Variance | Cumulative % |
| 1 | 5.357 | 33.48 | 33.48 |
| 2 | 2.046 | 12.787 | 46.267 |
| 3 | 1.739 | 10.867 | 57.134 |
| 4 | 1.449 | 9.055 | 66.189 |
| 5 | 1.159 | 7.241 | 73.43 |
3.11 Factor extraction using PCA
Principal components with eigen values higher than 1 were subjected to extraction. The number of PC having eigen value higher than 1 are shortlisted as five (Patnaik et al, 2024). The water quality parameters loading on principal components varimax rotation is applied and rotated factors were obtained. The higher loading of the particular parameter in each factors suggests essential contribution of that factor to the quality of groundwater. The provided factor loading matrix represents the correlations between different variables (water quality parameters) and the underlying factors extracted through rotated factor analysis. In first factor, bicarbonate, total alkalinity, carbonate, total hardness and chloride are showing high loading. Higher loading of chloride suggests discharge of waste water on the land surface (Tripathi and Singal, 2019). TDS, EC, U have strong positive loadings suggesting that these parameters are closely associated with Factor 2. In the second factor nitrate has negative loading throws light on the adverse effects of the use of inorganic pesticides and fertilizers. Factor 2 appears to be primarily influenced by the hydrogeochemical variable EC suggesting its association with the mineralization process of geological components of soil. Additionally, this factor demonstrates correlations with wastewater and rainfall stemming from domestic purposes. These relationships suggest that Factor 2 likely reflects the combined influence of natural geological processes, such as mineral dissolution, as well as anthropogenic activities, such as domestic wastewater discharge and rainfall runoff, on the overall water quality in the study area. pH, Phosphate, ORP has strong positive loadings suggest that these parameters are primarily influenced by Factor 3. In factor 4 Water Temperature (WT), DO have strong positive loadings, suggest that these parameters are closely associated with Factor 4. Nitrate, fluoride have strong positive loadings suggest that these parameters are primarily influenced by Factor 5. PCA loading for all the significant factors are shown in Fig. 8.
Table 4
Rotated factor analysis of Mayurbhanj district
| | 1 | 2 | 3 | 4 | 5 |
| Bicarbonate | 0.971 | 0.136 | -0.004 | 0.095 | 0.013 |
| TA | 0.971 | 0.136 | -0.004 | 0.095 | 0.013 |
| Carbonate | 0.966 | 0.13 | 0.007 | 0.106 | 0.004 |
| Chloride | 0.745 | 0.383 | -0.016 | -0.01 | 0.214 |
| TH | 0.567 | 0.464 | 0.326 | 0.165 | 0.109 |
| TDS | 0.239 | 0.935 | -0.031 | 0.081 | 0.086 |
| EC | 0.299 | 0.919 | -0.027 | 0.081 | 0.092 |
| Uranium | 0.002 | 0.899 | -0.19 | -0.075 | -0.069 |
| Sulphate | 0.468 | 0.591 | 0.135 | 0.104 | 0.092 |
| pH | 0.123 | -0.045 | 0.819 | 0.04 | 0.025 |
| Phosphate | 0.144 | 0.005 | 0.8 | 0.401 | -0.052 |
| ORP | -0.168 | -0.065 | 0.625 | -0.102 | -0.131 |
| WT | 0.148 | -0.011 | 0.031 | 0.818 | -0.002 |
| DO | -0.078 | -0.135 | -0.096 | -0.779 | 0.084 |
| Nitrate | 0.004 | -0.039 | -0.104 | 0.042 | 0.902 |
| Fluoride | 0.18 | 0.249 | -0.034 | -0.311 | 0.517 |
3.12 Correlation study
The Pearson correlation matrix given in Table 5 provides insights into the relationships between different water quality parameters measured in the study (Singh and Patra 2024). From the table it can be seen that TDS has positive correlation with EC (0.81), chloride (0.52), nitrate (0.44), sulphate (0.44), total hardness (0.44), total alkalinity (0.52), carbonate (0.53) and bicarbonate (0.53). The positive correlation suggests that as TDS levels increase, the concentrations of these ions also tend to increase. This could be due to common sources such as geological formations, agricultural runoff, industrial discharges, or natural weathering processes. Additionally, changes in environmental conditions such as precipitation, temperature, and land use may also collectively influence the concentrations of these parameters (Zhang et al, 2024). Total hardness is positively corelated with chloride with r value of 0.38. Total alkalinity is strongly correlated with carbonate (0.98) and bicarbonate (0.99). In other words, it can be said that total alkalinity has complete functional dependency on carbonate and bicarbonate.
Table 5
| | | pH | TDS | EC | ORP | WT | DO | Fluoride | Chloride | Nitrate | Sulphate | Phosphate | Uranium | TH | TA | Carbonate | Bicarbonate |
| Correlation | pH | 1 | | | | | | | | | | | | | | | |
| | TDS | 0.029 | 1 | | | | | | | | | | | | | | |
| | EC | 0.074 | 0.812 | 1 | | | | | | | | | | | | | |
| | ORP | -0.445 | -0.409 | -0.487 | 1 | | | | | | | | | | | | |
| | WT | -0.019 | 0.095 | 0.108 | -0.282 | 1 | | | | | | | | | | | |
| | DO | 0.182 | 0.117 | 0.138 | -0.242 | -0.067 | 1 | | | | | | | | | | |
| | Fluoride | 0.187 | 0.113 | 0.238 | -0.232 | -0.241 | 0.021 | 1 | | | | | | | | | |
| | Chloride | 0.118 | 0.525 | 0.705 | -0.343 | 0.157 | 0.013 | 0.169 | 1 | | | | | | | | |
| | Nitrate | -0.15 | 0.445 | 0.38 | -0.227 | 0.135 | 0.055 | -0.013 | 0.18 | 1 | | | | | | | |
| | Sulphate | 0.126 | 0.459 | 0.479 | -0.24 | 0.075 | 0.046 | 0.077 | 0.694 | 0.13 | 1 | | | | | | |
| | Phosphate | -0.067 | -0.008 | 0.009 | 0.034 | -0.16 | -0.054 | 0.12 | 0.212 | -0.108 | 0.024 | 1 | | | | | |
| | Uranium | 0.209 | -0.102 | 0.233 | -0.092 | -0.137 | 0.08 | 0.196 | 0.246 | 0.072 | 0.077 | -0.107 | 1 | | | | |
| | TH | 0.053 | 0.438 | 0.525 | -0.146 | -0.066 | 0.052 | 0.068 | 0.377 | 0.158 | 0.348 | 0.065 | 0.076 | 1 | | | |
| | TA | 0.118 | 0.524 | 0.705 | -0.342 | 0.157 | 0.013 | 0.17 | 1 | 0.18 | 0.695 | 0.212 | 0.246 | 0.377 | 1 | | |
| | Carbonate | 0.129 | 0.528 | 0.702 | -0.36 | 0.168 | 0.03 | 0.152 | 0.977 | 0.153 | 0.688 | 0.188 | 0.237 | 0.372 | 0.977 | 1 | |
| | Bicarbonate | 0.115 | 0.536 | 0.715 | -0.355 | 0.155 | 0.013 | 0.158 | 0.998 | 0.188 | 0.69 | 0.206 | 0.248 | 0.374 | 0.998 | 0.978 | 1 |
Bold ones are r > 0.4, showing the significance level
3.13 Geochemistry
Gibbs diagram in Fig. 9 shows dominance of rocks suggesting the major influence on water chemistry is the interaction between water and the surrounding rocks or geological formations. This interaction can involve processes such as mineral dissolution, weathering, and ion exchange, where ions are released or absorbed from minerals into the water. The Singhbhum granitic zone in the study area exhibits a geological composition consisting of granite and quartzite formations, alongside metamorphic rocks. This region is abundant in various minerals, including iron-ore (hematite), vanadiferous and titaniferous magnetic minerals, China clay, galena (lead ore), and kyanite (Yadav and Das 2021). From the Gibbs diagram showing rock dominance implies that water chemistry is primarily influenced by interactions with geological materials, and understanding these interactions is crucial for interpreting groundwater quality and behaviour (B Patil et al, 2020, Sharma et al, 2024).