The study aimed to create environmentally friendly plastic alternatives to petroleum-based ones by utilizing tapioca and banana peels. Bioplastic films were developed using a solvent casting technique with varying amounts of cellulose. Testing revealed that the banana peel- derived bioplastics displayed superior tensile strength (1,465.74 MPa), Young's modulus (14.35 MPa), and elongation at break (0.03%) compared to tapioca-based ones. Films containing banana peel had higher fiber and amylose content, while those with 9g of cellulose showed the lowest water absorption (73.08%). Water yielded the best results in the swelling test. Solubility tests revealed the film's insolubility in acetic acid, partial solubility in ammonia, and complete solubility in sulfuric acid. The study suggests that bioplastics made from banana peel and tapioca, enhanced with cellulose, exhibit robust resistance to various testing parameters, making them suitable for applications, notably in food packaging.
Research Article
The Effect of Cellulose Loadings on the Properties of Tapioca/Banana Peels Starch Bioplastics
https://doi.org/10.21203/rs.3.rs-4210538/v1
This work is licensed under a CC BY 4.0 License
Version 1
posted
You are reading this latest preprint version
Plastics are a class of materials derived from fossil resources that are used in almost every industry. Its high consumption is causing environmental problems, such as prolonged permanence in landfills, greenhouse gas emissions during its burning and irreversible damage to marine ecosystems (Alcivar-Gavilanes et.al, 2022). Despite this issue, plastic has become a necessity for humans due to its numerous applications. Originally, the word “plastic” meant flexible and easy to shape (Azieyanti et.al, 2020). Many studies have been carried out over the century on how to produce manufactured polymers, occasionally using natural substance usage such as cellulose, but mostly relying on the carbon atoms provided by petroleum and other fossil fuels. Modern civilization uses synthetic organic polymers derived from natural gas or oil in almost every area of everyday life. Aside from their lengthy decomposition times, petroleum based plastics also produce hazardous compounds during their degradation. The adverse environmental degradation created by various plastics produced from petroleum products is a major concern for the world nations. The developed and developing nations have adopted various strategies on the production and usage of highly hazardous conventional plastics. The problems caused by synthetic plastics have motivated the use of other materials. By 2030, Malaysia plans to have zero waste. Recycling and composting all of our garbage is an important part of the zero-waste movement. Bioplastic is an ingenious answer to this problem.
Tapioca is a starch derived from cassava root, a South American tuber. The cassava root is a staple food in a number of African, Asian, and South American countries and is quite simple to cultivate. Cassava is the common term for the plant's roots, whereas tapioca is the name starch and other processed goods. Tapioca is nearly pure starch, hence it consists almost completely of carbohydrates.
Banana is one of the most widely consumed fruits in the world, accounting for 40% of global fruit trade. Banana peels are sometimes used as feedstock for cattle, goats, monkeys and several other species, typically on small farms and banana growing regions. The nutritional value of banana peels depends on the stage of maturity and the cultivar. On average, banana peels contain 6–9% dry matter of protein and 20–30% fiber. Banana peels can be utilized in a variety of ways, one of which is to transform them into a more valuable product, bioplastics, which are widely used in the food industry. Recently, banana peel bioplastic has got much attention among researchers due to its advantages such as being biodegradable, low cost, environmentally friendly and renewable compared to the plastics from synthetics polymer (Kanoujiya and Khanna, 2019). Banana peels contain high sources of starch which is 18.5%, which is good to use as a natural polymer to produce banana peels bioplastic film (Sultan,2017).
Starch-based bioplastics, such as those derived from maize, potato, and cassava starch, also offer a variety of advantages in addition to being biodegradable and easy to create. Starch is a natural polymer or polysaccharide, meaning that it is a long chain comprising one type of molecule. Starch consists of glucose molecules. It can occur in two forms which are amylose and amylopectin. There are several disadvantages that make its application unfeasible. The main drawbacks are that starch has low mechanical properties and is highly permeable to water vapour. With that, polymer blending is needed in order to improve the properties of starch. According to Chillo et al., (2018), with increasing chitosan concentrations in starch composite films, the tensile strength increases, but the effect on elongation at break results is negligible. Bio-based plants from renewable resources such as those derived from chitosan or starches were easily degraded and thus environmentally safe.
Cellulose is the major structure or component of plants and it is glucose polymer bounded in the − 1, 4 linkage configuration. This − 1, 4 linkage allows the cellulose polymer to crystallize in a linear configuration, with a high degree of intermolecular hydrogen bonding, giving it significant shear and tensile strength. Cellulose can be purified for use as a food ingredient, due to its chemical composition. Cellulose is probably the least soluble of all fiber components, being insoluble not only in cold or hot water, but also in hot dilute acids and alkalis (Riantory et.al, 2013). In this study, an attempt has been made to investigate the effect of cellulose loadings on the properties of tapioca/banana peels starch bioplastics.
Tapioca and banana peel is the most promising renewable resources. Cassava plant tubers are the source of tapioca flour. Cassava starch was chosen because it is readily available, inexpensive, and environmentally friendly. Amylose (15%) and amylopectin (85%) account for the vast majority of cassava starch. Good quality starch should have a pH between 4.7 and 5.3, a moisture level between 10 and 13.5%. Banana is one of the popular fruits which can be found in Malaysia. This will lead to an abundance of bananas that are easy to acquire in this country due to the high consumption and industrial processing of the edible parts of bananas. These other features assume that waste such as peels are generated in large quantities. Vast quantities of banana peels lead to major dumping problems and a tremendous waste of resources (Mohamed et al., 2020). Bioplastics can save on fossil resources and green house gas (GHG) emissions, while agricultural biomass production may cause adverse environmental effects, such as soil erosion, soil and surface water eutrophication or habitat fragmentation (Parthasarathy & Narayanan, 2014).
In this research, tapioca and banana peels will be turned into a starch based bioplastic works with cellulose to produce bioplastic instead of synthetic plastics in everyday life. Using tapioca powder and banana peels helps to reduce environmental burden and to improve the reuse efficiency of the material (Tsang et.,al,2019)
2.1 Materials
Banana peel waste was obtained from local market Arau, Perlis. Cellulose (microcrystalline), Hydrochloric acid (HCL), sodium hydroxide (NaOH), sodium metabisulphite (Na2S2O5) an d Gl y c e r o l were secured from the ME SCIENTIFIQUE SDN BHD in Selangor, Malaysia.
2.2 Preparation of banana peel starch
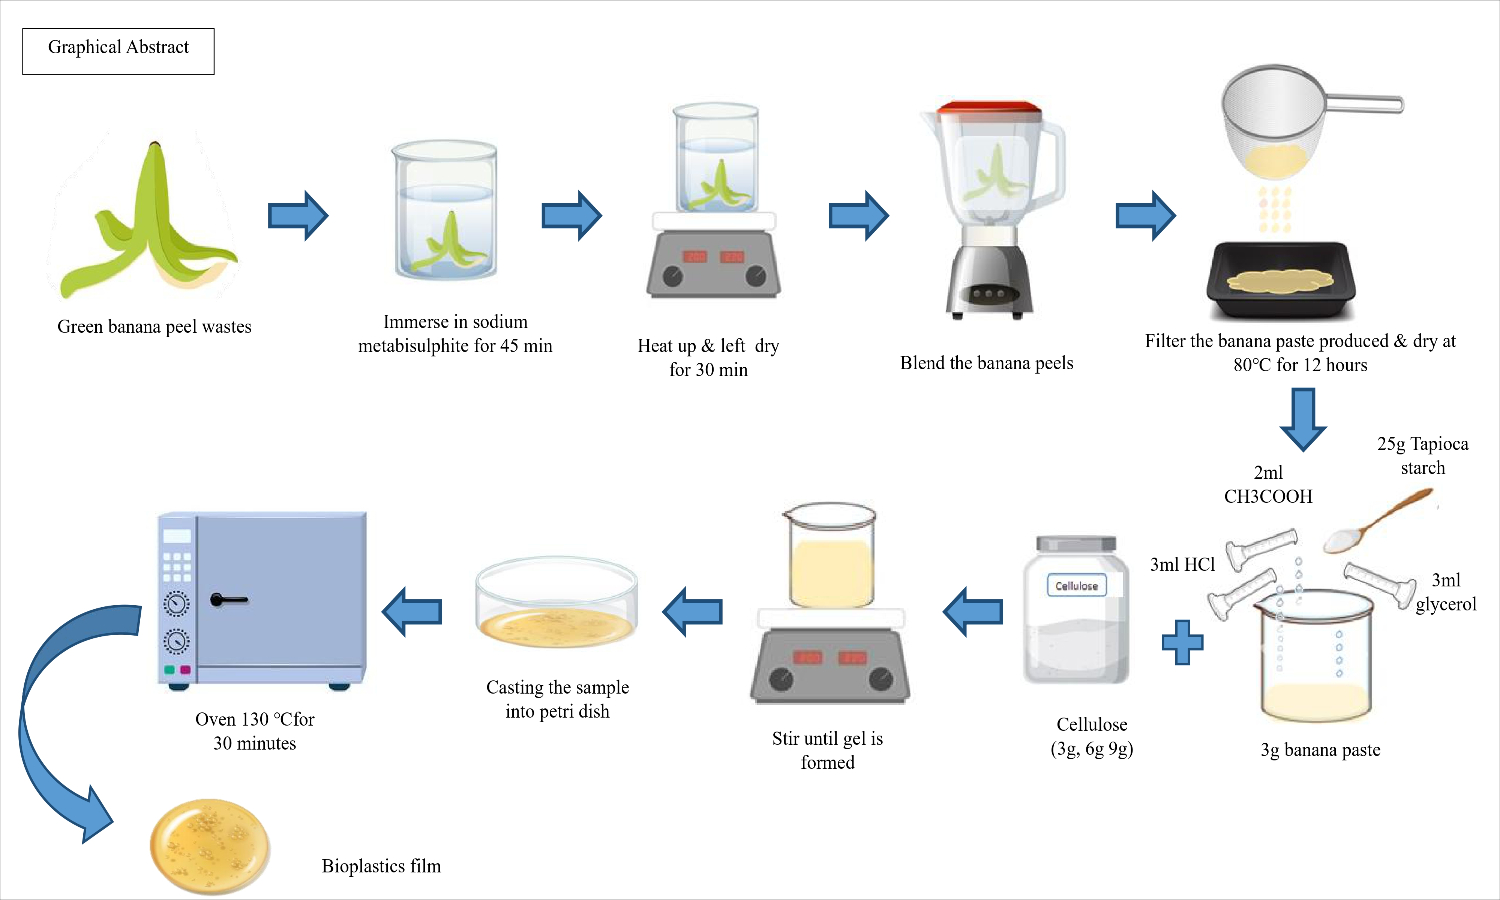
The flesh of the banana was separated from the peel and it was washed with tap water for purpose of cleaning or disinfecting. The cleaned banana peels were shredded into tiny pieces approximately 20mm. After that, the peels were soaked in a solution of 0.2 M Na2S2O5 for 45 minutes. The function of Na2S2O5 to act as a disinfectant, antioxidant, and preservative agent. The banana peels were rinsed. Next, the peels were let to be heated for 30 minutes on the hot plate until all banana peel were fully immersed in the distilled water. The water was drained and the peels were left to dry for 30 minutes at room temperature. Then banana peel was grinded until paste of banana was obtained. The paste was filtered and put it in the oven at 80℃ for 12 hours.
2.3 Preparation of bioplastics film with addition of cellulose
Glycerol is employed as a plasticizer in producing bioplastics from banana starch to enhance the film-forming capability and reduce the brittleness of the plastic. For the first control formulation, 25 g of tapioca powder was placed in a beaker, it was boiled with 100 ml of distilled water for 20 minutes under agitation using a magnetic stirrer. Then, 3 ml of (0.1N) HCL, 3 ml of glycerol, 2 ml of acetic acid and cellulose (3g, 6g and 9g) were added in the mixture. Then, the mixture was boiled until gel was formed. The gel was poured in the petri dish, spread evenly and dried in oven at 150℃, for 1 hour. The same step was repeated for other samples. Table 1 summarized the formulation of bioplastics fabricated from banana peel. The bioplastic coating was scraped off of the petri dish once the plate has cooled for some time. The connection between the mass of solution and the area of the plate was used to control the thickness and a roller was pressed down into the mixture to ensure that it was equally distributed throughout the mold. The sample’s thickness was measured using a dial thickness gauge with an accuracy of 0.01 mm (Jirukkakul, 2016).
|
Formulation |
Tapioca powder (g) |
Banana peel (g) |
Glycerol (ml) |
Acetic acid (ml) |
Acid hydrochloric (ml) |
|---|---|---|---|---|---|
|
Cellulose (g) |
|||||
|
Control |
25 |
3 |
3 |
2 |
3 |
|
3 |
25 |
3 |
3 |
2 |
3 |
|
6 |
25 |
3 |
3 |
2 |
3 |
|
9 |
25 |
3 |
3 |
2 |
3 |
2.4 Characterization and Testing of Bioplastic Film
2.4.1 Fourier Transform Infrared Spectroscopy
Perkin Elmer Spectrophotometer was used to do FTIR analysis of samples in the range of 4000 nm to 400 nm. This research used the use of FTIR spectroscopy was conducted to assess the interaction between banana peel starch bioplastics and the cellulose. A critical first step in understanding the link between banana peel bioplastic's tensile and thermal properties is identifying where and how the bonding occur.
2.4.2 Mechanical Testing
Tensile strength test was conducted using an Instron Universal Testing Machine ASTM based on D882 standard. A strain rate of 2 mm/min at room temperature was usedto estimate the tensile strength (TS), Young’s modulus (YM) and elongation at break (EAB) using stress-strain curves. Bioplastics were tested mechanically using the ASTM-D882 standard procedure. The gauge length was set at 4mm. Five samples having the dimension of 10 mm x 70 mm was tested for each compounds. The test speed was 20mm/min.
2.4.3 Thermogravimetric analysis (TGA)
Thermogravimetric analysis (TGA) was employed to access the thermal stability of the bioplastics. This involved measuring the alterations in mass that linked to the process of thermal degradation. ASTM E1131 or ISO 11358 were utilized as references (Thermogravimetric Analysis (TGA) ASTM E1131, ISO 11358, n.d.). The weight loss of the samples as a function of temperature will be evaluated using a thermogravimetric analyser, namely the Mettler Toledo TGA/DSC 1 (STARe system), operating in a nitrogen environment with a flow rate of 20 mL/min. In order to generate separate spectra, a quantity of 10mg of desiccated sample will be subjected to a gradual temperature increase of 10°C per minute, within a nitrogen environment, starting at room temperature and reaching a final temperature of 800°C. The thermogram quantifies the reduction in weight relative to changes in temperature. The mass of the sample will be continuously monitored at regular intervals of temperature and time. The measurement of weight loss in the sample will be conducted in relation to changes in temperature. The methodology employed in this study was elucidated in a prior investigation conducted by Owolabi et al. (2017).
2.4.4 Water Absorption
ASTM D570-98 was used to assess the water absorption. Dried samples were weighed and then put in a room temperature distilled water. After 24 hours, the samples were moved, water on their surface was wiped off using tissue paper and the samples were weighed once again. Results were obtained from the average of 5 replicates.
Equation 1:

where Wi is initial weight (g) before immersion in water and Wf is finalweight (g) after immersion in water.
2.4.5 Swelling Test
The bioplastics films were cut into 1cm x 1cm dimension and the sample was placed in the boiling test tube to identify the properties changed. The solvents that have been used were distilled water, chloroform and methanol. The test was carried out for 2 hours and the results were recorded as follows:
Equation 2:

2.4.6 Solubility Test
Solubility test helps to determine how much solute is or can be dissolved in a solvent at equilibrium. The sample was cut with the dimension of 1cm x 1cm and the samples were immersed in different solvents such as acetic acid, chloroform and sulphuric acid. The test was carried out for 72 hours under ambient temperature.
3.1 FTIR Analysis
Functional groups and any potential chemical alterations upon addition of cellulose was observed using the FTIR analysis. It allows for the quick, accurate, and effective identification of functional groups (Shafqat et al.,2021). The FTIR spectra of bioplastics starch film with various cellulose loadings is illustrated in Fig. 1. Tables 2 and 3 recovered the summarized the absorption peak of the FTIR analysis for all film.
|
Functional Group with Wavenumber |
||||
|---|---|---|---|---|
|
Sample |
O-H (3400- 3200 cm-1) |
C-H (3000- 2841 cm-1) |
C = C (1680- 1600 cm-1) |
C-O (1300- 1000 cm-1) |
|
1. Control Tapioca |
3269 |
2888 |
1625 |
1244, 1068 |
|
2. Control Banana |
3264 |
2918 |
1620 |
1264, 1059 |
|
Wavenumber of 3g Cellulose |
Wavenumber of 6g Cellulose |
Wavenumber of 9g Cellulose |
Wavelength range (cm-1) |
Functional group |
|---|---|---|---|---|
|
(cm-1) |
(cm-1) |
(cm-1) |
||
|
3332 |
3340 |
3340 |
3700 − 2800 |
OH |
|
2914 |
2890 |
2892 |
2920 − 2800 |
CH |
|
1503 |
1512 |
1493 |
1520 − 1400 |
CH₂, C-H, |
|
1244 |
1249 |
1220 |
1300 − 1200 |
C-O C-O-C |
|
746 |
766 |
732 |
790 − 690 |
C-C and C- H from aromatic hydrogen compounds |
From Tables 2 and 3 shown the characteristics of peak of the starch from all bioplastics film. The presence of the OHgroup was indicated by a broad peak at around 3400 − 3200 cm-1 and a distinguished peak at 3000 − 2841 cm-1attributed to CH2 stretching vibrations (Suciyati et al.,2021). Peak observed at 1680 − 1600 cm-1 correspond to the C = O stretching of amide group in the starch. The bands shown between 1300 − 1000 cm-1 were the results of C-O stretching in the glycosidic backbone of the starches (Suciyati et al.,2021). In comparison to tapioca starch, banana peel has the highest intensity at wavenumber 2918 cm-1, indicating the stretching's of C-H bond because bananas have higher starch content at those peaks. Tapioca powder has high C = C spectra which was 1625 cm-1, that can beattributed to the stretching vibration of alkene (Olagundoye and Moray, 2022).
Furthermore, the broad band range between 3700 − 2800 cm-1, which was due to the OH stretching vibration, gives considerable information concerning the hydrogen bands, which can be correlated with the scissionof the intra- and inter-molecular hydrogen bond (Md Salim et al., 2021). Peaks that were shifted and enlarged suggest that the OH group in cellulose has a weak hydroxyl bond, which makes it possible to transform 9g of cellulose into a biocomposite material. The changes of peak at 3340 cm-1 was due to the increase of the group value by the hydrogen interaction when starch and cellulose were combined in bioplastics. The range peaks of 2920−2800 cm-1 was attributed to the CH stretching vibration. According to Md Salim et al., (2021), found that the presence of amorphous cellulose samples can be further confirmed by the shift of the band from 2920 cm-1, which corresponded to the CH stretching vibration.
Besides that, range of wavenumber 1400–1520 cm-1 shows the widening of the peak in cellulose due to the functional groups bending CH2, C-H and C-O which attributed to the aromatic skeletal ring (Suciyati et al.,2021). The spectrum associated with functional group impurity has also detected in the range of intensity of wavenumber 1050–1110 cm-1 with lipid, protein, and nucleid content (Suciyati et al.,2021). The intensity of IR absorption at the peak of 790 − 690 cm-1 indicated the stretching of C-C and stretching C- H from aromatic hydrogen compounds. The peak of 746 cm-1, 766 cm-1, 732 cm-1, was an amorphic structure in 3g cellulose, 6g cellulose and 9g cellulose.
3.2 Tensile Properties
The tensile strength, Young's Modulus, and elongation at break for bioplastics presented Figs. 2, 3 and 4 respectively. Based on Fig. 2, the tensile strength of the tapioca films showed an increment compared to tapioca/ banana from 4.49 MPa to 14.35 MPa. This is because film that contain banana peel have high fiber and high amylose content compared to tapioca itself. The addition of cellulose into the tapioca/ banana film had significantly decreased the tensile strength. Interesting to note that, the highest tensile strength for the modified film was with the addition of 6g of cellulose loading which was 5.6 MPa. This could be attributed to a good dispersion and strong interaction formed between the hydrogen bond of the starch matrix and the cellulose loadings. This condition can be attributed to the distribution of the developed stress within the filler under tensile load by the matrix and the filler reinforcement carried the tensile load which was more effective to withstand the matrix breakage (Nagaraj et al., 2020, Olagundoye & Morayo, 2022). Cellulose (9g) produced the lowest tensile strength with 1.46 MPa which was responsible for weak intermolecular interaction leading to a heterogeneous film structure and forming agglomeration. This can be attributed to weak tensile strength that indicate the insufficient bonding between the filler and banana peel at a higher filler percentage. It resulted voids and weaker strength during tensile testing (Nagaraj et al., 2020).
In the case of Young’s modulus between types of tapioca, tapioca/ banana showed the highest Young’s modulus value at 1465.74 MPa.This is because both of these sources are high in amylose content which suggests that both of these sources are used to make a bioplastic. Those made from banana peel are much stronger than those made from tapioca starch alone. Moreover, when the tapioca/ banana modified with cellulose,Young’s modulus had significantly reduced to the lowest value of 205.41 MPa. It could be attributed to the degree of dispersion and percentage of cellulose loadings in the starch matrix (Olagundoye & Morayo, 2022). The higher value of young modulus indicated vulnerability to brittleness. Similarly, interfacial adhesion between the filler and matrix might ease the transmission of loads between the filler and matrix. In addition, the increase in filler content had increased the number of interfacial regions between the filler and matrix, resulting in a greater load-bearing capability. In the case of random filler reinforcement, the increase in strength and modulus is proportional to the weight gram of filler loadings (T et al., 2019). Low young modulus in a sample containing 9g of cellulose could be attributed to poor cellulose dispersion within the starch matrix. This may be ascribed to some agglomeration of the cellulose particles when the weight was further increased. Also, the increased in the Young’s modulus may also be due to the presence of microfibrils compounds in the cellulose loadings (T et al., 2019). However, as the weight of the filler increased, it can be seen that there are some irregular distributions with some filler aggregates within the banana peel and tapioca powder matrix.
Figure 4 depicts the percentage of elongation at break for all samples. As the mixture of banana peel and tapioca starch increased in tensile strength and modulus, the elongation at break had gradually decreased. This data suggests that the decreased in elongation at break was caused by the increase in fibre content. The percentage of elongation of the control tapioca was only 0.02%, which was less than the tapioca/ banana. The elongation at break of control tapioca powder was less than that of the mixture of tapioca starch and banana peel because the control tapioca lacked the components that act as a thickening agent in the banana peel. The ratio of amylose to amylopectin in a starch also affects thickening, viscosity, solubility, and shear resistance. 6g cellulose has the highest percent of elongation at break with 0.0254% while the lowest elongation at break was at 9g of cellulose loadings with the value of 0.0103%. The percent of elongation at break reduced with the increased in the filler content. This indicates that the filler acted as a rigid component in the composites (T et al., 2019). According to Olagundoye & Morayo, (2022), a decrease in the value is possible due to molecular interaction between the O-H group of the starch and the hydroxyl and carboxylic (COOH) groups of the cellulose, which led to high tensile strength and low elongation at break for the films.
3.3 Thermogravimetric analysis (TGA)
The TGA and derivative thermogravimetric (DTG) profiles of banana peel and tapioca powder with different addition of cellulose contents starch based bioplastics films are shown in Fig. 5a,b, respectively. Both thermal studies were conducted concurrently within a temperature range of 30 to 800℃. Both films depict five instances of weight loss. The initial decrease in weight seen within the temperature range of approximately 30°C to 100°C was found to be linked to the process of free water evaporation (Azevedo et al., 2020). The second weight loss observed within the temperature range of approximately 100°C to 200°C was shown to be associated with the process of moisture evaporation from the bioplastic films (Syafri et al., 2018). Where the moisture evaporation encompasses the broader concept of any liquid transitioning into a vapor state, including substances beyond water. The weight loss range between about 200°C and 300°C observed in the study can be attributed to the thermal disintegration of starch in the bioplastic films and the degradation of glycerol, which has a boiling point of 290°C (Azevedo et al., 2020). Starch is composed of amylose particles that have the ability to undergo volatilization, resulting in the release of carbon, hydrogen, and oxygen (Wahyuningtyas et al., 2017). Between about 300°C and 500°C, the thermal decomposition process resulted in the release of substances of lower molecular weight, including plasticizer (glycerol) and additive (cellulose), with the destruction of starch. At temperatures over 500°C, the process of pyrolysis occurred, leading to the formation of inorganic substances within the residual samples (Krishnamurthy & Pavithra, 2019).
The TGA results for all of the bioplastics starch films are presented in Fig. 5a. It shown that as cellulose's composition changes, weight loss will also change from high to low. The thermal stability of the film made from a combination of banana peel and tapioca powder is also declining. This is so that after the cellulose is mix, it will be simpler to decay and lose weight because the lignin and hemicellulose structure were removed (Othman et al., 2011).
From the DTG curves shown in Fig. 5b, the results suggested that the control film and the modified film with cellulose starch based bioplastics might be subjected to the applications below 316 ℃ and 290℃, respectively, without any degradation loss in their characteristics. Most of the applications associated with this kind of bioplastics such as packaging and containers, are usally operated from the room temperature to slightly higher than 100 ℃. These operating temperature are well below the thermal stability of the bioplastics film (Tan et al., 2022). From the Table 4 below, cellulose 9g have the most stable in high thermal condition compared to other films.
|
Sample |
Degradation Temperature (℃) |
Residual weight (%) at 700 ℃ |
|
|---|---|---|---|
|
T20 |
T50 |
||
|
Control |
99.4554 |
100.504 |
16.7671 |
|
Control B + T |
99.4203 |
100.474 |
17.1386 |
|
Cellulose 3g |
99.3229 |
100.666 |
11.7369 |
|
Cellulose 6g |
96.7743 |
97.5788 |
14.335 |
|
Cellulose 9g |
99.0394 |
100.16 |
18.5547 |
3.4 Water Absorption
The purpose of the water absorption test was to identify the sample's capacity for water absorption in a given circumstance. One of the weak points of starch-based bioplastics is its poor resistance to water and moisture. Therefore, filler addition does not only aim to enhance mechanical properties but also to improve the water resistance of starch- based materials. The effects of cellulose loadings on the properties of banana peel starch bioplastics was illustrated in Fig. 6. To maintain structural integrity, composite materials must have less water absorption when used in humid environments. All samples show an increment of weight reading in the first 3 days until 9 days but when it comes to 12 daysand 15 days the sample appears to decline in the weight reading.
Bioplastic film of control tapioca has the highest value of water absorption compared to the film of tapioca/ banana. This is because different content of tapioca and banana starch were used, which this it indicates changes of percent of amylose and amylopectin content from both material. Tapioca/ banana film had the lowest value of water absorption which was due to the competition occurring in the two components of high starch and fiber content. This reduces the water absorption when fiber content increases due to the comparatively poor absorption of fibers.
An increased in cellulose fibers content resulted in a decreased in water absorption. The highest percent of water absorption shown by 3g of cellulose while 9g of cellulose has the lowest weight loss. The decrease can be attributed to the formation of hydrogen bonding between the cellulose and the hydroxyl functional group of the starch matrix. The resulting hydrogen-bonded network of cellulose with the starch in the composite could have prevented the formation of voids where water molecules can pass through.
3.5 Swelling Behaviour
Figure 7 shows the result of the swelling test ofstarch bioplastics with different cellulose loadings. There is not much change in the integrity of bioplastic film when it was soaked in chloroform and methanol solvents. However, there was a slight increase in the weight of bioplastic film when it was soaked in water has made it a reliable material than other materials (Jayachandra et al.,2016).
It was observed that, distilled water has the highest potential of swelling. All samples from control tapioca powder to 9g of cellulose loading displayed excellent swelling behavior in distilled water. However, the samples immersed in methanol and chloroform only shows slightdifferences. The major qualities used to determine if a bioplastic material is
sustainable are engorgement and solubility. If the bioplastic material has a low or zero engorgement property, it can be called an excellent material with stability which is a distinguishing quality. However, if the bioplastic material swells or engorges excessively, it will be regarded as a low-quality material. Less swell formation in the prepared bioplastic material when soaked in chloroform and methanol containing medium, but swells slightly higher in water since most additives are prepared using organic solvents, and it will easily aid in the stabilization of product synthesis and development.
Cellulose 3g has highest swelling properties in distilled water while 9g cellulose was the least swell towards water. Cellulose is hydrophilic and readily absorbs water in the amorphous regions. It is believed that water could be absorbed by cellulose materials. However, because of the significantly higher crystallinity of individual cellulosemicrofibrils and higher fiber or resin hydrogen bonding, water absorption of cellulose-reinforced starch composite could be lower compared to pure starch resin (Fu & Netravali, 2020).
3.6 Solubility Behaviour
Solubility test helps to determine how much solute is or can be dissolved in a solvent at equilibrium. Solubility is also another important characteristic feature, where it is essential to have bioplastic material which is less soluble in water than any other organic solvents. Insoluble property of the bioplastic material in water medium is promising for the synthesis of economically viable product development and because of the unbroken nature of these biopolymers has made it a sustainable product.
|
Sample No. |
Solvents used |
Solubility test |
||||
|---|---|---|---|---|---|---|
|
Insoluble |
Partially |
Fully soluble |
||||
|
soluble |
||||||
|
1. |
Acetic acid |
+ |
- |
- |
||
|
2. |
Ammonia |
- |
+ |
- |
||
|
3. |
Sulphuric acid |
- |
- |
+ |
||
A modified bioplastic film made of cellulose from banana peel and tapioca powder was successfully prepared. The FTIR analysis revealed that the spectra for the control formulation of bioplastic banana peel and tapioca powder are comparable, however there are variances in the functional groups present, namely OH, aliphatic saturated hydrocarbon chain (CH), anhydride group (CO), and C-C and C-H from aromatic hydrogen compounds.
The tensile testing suggest that bioplastics formed from control banana have the highest tensile strength, Young's modulus, and elongation at break, whereas 9g cellulose was the formulation with the lowest tensile strength. The water absorption, swelling, and solubility test were conducted to examine the water resistance capabilities or characteristics of bioplastics film. 3g cellulose showed the highest weight loss value, whilst 9g cellulose has the lowest water absorption value. In terms of swelling behaviour, the distillation of water produced the best results for the swelling test.
When bioplastic materials were immersed in chloroform and methanol, the integrity of the bioplastics is not significantly altered.The bioplastics film produced from b a n a n a p e e l and tapioca powder modified with cellulose is suitable for use in packaging, particularly food packaging, due to its high resilience to all testing condition.
- A. (2018). Bio-based Materials for Food Packaging (1st ed. 2018 ed.). Springer.
- Abdulkadir, H. K., Shukor, S. A. A., Hamzah, R., Noriman, N. Z., Dahham, O. S., Dahham, S. S., & Faris, N. A. (2020). Preparation coated of urea beads from banana peel bioplastic and epoxidized natural rubber 50. 2ND INTERNATIONAL CONFERENCE ON MATERIALS ENGINEERING & SCIENCE (IConMEAS 2019). https://doi.org/10.1063/5.0000418
- Abe, M. M., Martins, J. R., Sanvezzo, P. B., Macedo, J. V., Branciforti, M. C., Halley, P., Botaro, V. R., & Brienzo, M. (2021). Advantages and Disadvantages of Bioplastics Production from Starch and Lignocellulosic Components. Polymers, 13(15), 2484. https://doi.org/10.3390/polym13152484
- Alcivar-Gavilanes, M.G., Carrillo-Anchundia, K.L. and Riera, M.A. (2022). Development of a bioplastic from banana peel. Ingeniería e Investigación, 42(3), e92768. https://doi.org/10.15446/ing.investig.92768
- Amin, M. R., Chowdhury, M. A., & Kowser, M. A. (2019). Characterization and performance analysis of composite bioplastics synthesized using titanium dioxide nanoparticles with corn starch. Heliyon, 5(8), e02009. https://doi.org/10.1016/j.heliyon 2019.e02009
- Aridi, A. S., Ling, C. N., Ishak, N. A., Nor Nadiah, M. Y., Ahmed, M. F. M., & Yusof, Y. A. (2020). Structural FTIR analysis of cellulose functional groups isolated from Leucaena leucocephala pods usingdifferent bleaching agents. AgriRxiv, 2020. https://doi.org/10.31220/agrirxiv.2020.00026
- Atichokudomchai, N., & Varavinit, S. (2019). Characterization and utilization of acid- modified cross-linked Tapioca starch in pharmaceutical tablets. Carbohydrate Polymers, 53(3), 263–270. https://doi.org/10.1016/s0144-8617(03)00070-5
- Azevedo, L., Rovani, S., Santos, J. J., Dias, D. B., De Souza Nascimento, S., De Oliveira, F. F., Silva, L., & Fungaro, D. A. (2020). Biodegradable Films Derived from Corn and Potato Starch and Study of the Effect of Silicate Extracted from Sugarcane Waste Ash. ACS Applied Polymer Materials, 2(6), 2160–2169. https://doi.org/10.1021/acsapm.0c00124
- Azieyanti, N. A., Amirul, A., Othman, S. Z., & Misran, H. (2020). Mechanical and Morphology Studies of Bioplastic-Based Banana Peels. Journal of Physics:Conference Series, 1529(3),032091. https://doi.org/10.1088/1742-6596/1529/3/032091
- Borela, V. T., & Apolinar, D. A. D. (2020). Banana Peel Cellulose Nanofibers (CNFs) as Retrofitting Material to Soy-Protein in Manufacturing Biodegradable Food Packaging. Journal of Scientific Research in Medical and Biological Sciences,1(1), 10–29. https://doi.org/10.47631/jsrmbs.v1i1.22
- Cerqueira, M. A., Vicente, A. A., & Pastrana, L. M. (2018). Nanotechnology in Food Packaging: Opportunities and Challenges. Nanomaterials for Food Packaging, 1–11. https://doi.org/10.1016/b978-0-323-51271-8.00001-2
- Clark, H. J., Aguado, J., & Serrano, D. (2022). Feedstock Recycling of Plastic Wastes. Royal Society of Chemistry.
- Fu, D., & Netravali, A. N. (2020). Green composites based on avocado seed starch and nano‐ and micro‐scale cellulose. Polymer Composites, 41(11), 4631–4648. https://doi.org/10.1002/pc.25739
- Gadhave, R. V., Das, A., Mahanwar, P. A., & Gadekar, P. T. (2018). Starch Based Bio- Plastics: The Future of Sustainable Packaging. Open Journal of Polymer Chemistry, 08(02), 21–33.https://doi.org/10.4236/ojpchem.2018.82003
- Greene, J. P. (2014). Sustainable Plastics: Environmental Assessments of Biobased, Biodegradable, and Recycled Plastics (1st ed.). Wiley.
- Hospodarova, V., Singovszka, E., & Stevulova, N. (2018). Characterization of Cellulosic Fibers by FTIR Spectroscopy for Their Further Implementation to Building Materials. American Journal of Analytical Chemistry, 09(06), 303–310. https://doi.org/10.4236/ajac.2018.96023
- Huzaisham, N. A., & Marsi, N. (2020). Utilization of Banana (Musa Paradisiaca) Peel As Bioplastic for Planting Bag Application. Social Science Research Network. https://papers.ssrn.com/sol3/Delivery.cfm/SSRN_ID3598064_co de4086546.pdf?abstractid=3598064&mirid=1
- Ismail, N. A., Mohd Tahir, S., Norihan, Y., Abdul Wahid, M. F., Khairuddin, N. E., Hashim, I., Rosli, N., & Abdullah, M. A. (2016). Synthesis and Characterization of Biodegradable Starch-Based Bioplastics. Materials Science Forum, 846,673–678. https://doi.org/10.4028/www.scientific.net/msf.846.673
- Jayabalan, J. B., Kandasamy, S., Palanisamy, M., Manickam, N. K., & Royan, E. N. J. G. (2020). Synthesis of bio-polymers from Prosopis juliflora. AIP Conference Proceedings. https://doi.org/10.1063/5.0011060
- Kalpana, S., Priyadarshini, S., Maria Leena, M., Moses, J., & Anandharamakrishnan, C. (2019). Intelligent packaging: Trends and applications in food systems. Trends in Food Science & Technology, 93, 145–157. https://doi.org/10.1016/j.tifs.2019.09.008
- Krishnamurthy, A., & Pavithra, A. (2019). Synthesis and characterization of eco-friendly bioplastic from low-cost plant resources. SN Applied Sciences, 1(11). https://doi.org/10.1007/s42452-019-1460-x
- M, A., Vijayalaksmi, M., Vigneshwari, N., Gokul, M., Govindaraj, V., Nithila, E. E., Bebin, M., Prasath, T., Kiran V, G., & Varsha A, K. (2022). Synthesis and Characterization of Banana Peel Starch-Based Bioplastic for Making Intra Venous Tubes. SSRN Electronic Journal.https://doi.org/10.2139/ssrn.4059125
- Mahardika, M., Abral, H., Kasim, A., Arief, S., Hafizulhaq, F., & Asrofi, M. (2019). Properties of cellulose nanofiber/bengkoang starch bionanocomposites: Effect of fiber loading. LWT, 116, 108554. https://doi.org/10.1016/j.lwt.2019.108554
- Marichelvam, Jawaid, & Asim. (2019). Corn and Rice Starch-Based Bio-Plastics as Alternative Packaging Materials. Fibers, 7(4), 32.https://doi.org/10.3390/fib7040032
- Md Salim, R., Asik, J., & Sarjadi, M. S. (2021). Chemical functional groups of extractives, cellulose and lignin extracted from native Leucaena leucocephala bark. Wood Science and Technology, 55(2), 295–313. https://doi.org/10.1007/s00226-020-01258-2
- Mohd Zaini, H., Roslan, J., Saallah, S., Munsu, E., Sulaiman, N. S., & Pindi, W. (2022). Banana peels as a bioactive ingredient and its potential application in the food industry. Journal of Functional Foods, 92, 105054. https://doi.org/10.1016/j.jff.2022.105054
- Nagaraj, N., Balasubramaniam, S., Venkataraman, V., Manickam, R., Nagarajan, R., & Sikiru Oluwarotimi, I. (2020). Effect of cellulosic filler loading on mechanical and thermal properties of date palm seed/vinyl ester composites. International Journal of Biological Macromolecules, 147, 53–66. https://doi.org/10.1016/j.ijbiomac.2019.11.247
- Nisticò, R. (2020). Polyethylene terephthalate (PET) in the packaging industry. Polymer Testing, 90,106707.https://doi.org/10.1016/j.polymertesting.2020.106707
- Olagundoye, A. A., & Morayo, A. O. (2022). Characterization of Potato Peel Starch- based Bioplastic Reinforced with Banana Pseudostem Cellulose for Packaging Applications. CERN European Organization for Nuclear Research - Zenodo. https://doi.org/10.5281/zenodo.6571367
- Othman, N., Azahari, N. and Ismail, H., 2011. Thermal Properties of Polyvinyl Alcohol (PVOH)/Corn Starch Blend Film. Malaysia polymer journal, 6(6), pp.147-154
- Pilla, S. (2011). Handbook of Bioplastics and Biocomposites Engineering Applications (1st ed.). Wiley-Scrivener.
- Prasad, P., & Kochhar, A. (2014). Active Packaging in Food Industry: A Review. IOSR Journal of Environmental Science, Toxicology and Food Technology, 8(5), 01–07. https://doi.org/10.9790/2402-08530107
- Ribba, L., Garcia, N. L., D’Accorso, N., & Goyanes, S. (2017). Disadvantages of Starch- Based Materials, Feasible Alternatives in Order to Overcome These Limitations. Starch- Based Materials in Food Packaging, 37–76. https://doi.org/10.1016/b978-0-12-809439- 6.00003-0
- Rusdi, S., Destian, R. A., Rahman, F., & Chafidz, A. (2020). Preparation and Characterization of Bio-Degradable Plastic from Banana <i>Kepok</i> Peel Waste. Materials Science Forum, 981, 132–137. https://doi.org/10.4028/www.scientific.net/msf.981.132
- Shafqat, A., Al-Zaqri, N., Tahir, A., & Alsalme, A. (2021). Synthesis and characterization of starch based bioplatics using varying plant-based ingredients, plasticizers and natural fillers. Saudi Journal of Biological Sciences, 28(3), 1739–1749. https://doi.org/10.1016/j.sjbs.2020.12.015
- Simmonds, G., & Spence, C. (2017). Thinking inside the box: How seeing products on, or through, the packaging influences consumer perceptions and purchase behaviour. Food Quality and Preference, 62, 340–351. https://doi.org/10.1016/j.foodqual.2016.11.010
- Singh, P., Wani, A. A., & Langowski, H. (2017). Food Packaging Materials: Testing & Quality Assurance (1st ed.). CRC Press.
- Suciyati, S. W., Manurung, P., Sembiring, S., & Situmeang, R. (2021). Comparative study of Cladophora sp. cellulose by using FTIR and XRD. Journal of Physics: Conference Series, 1751(1), 012075. https://doi.org/10.1088/1742-6596/1751/1/012075
- Syafri, E., Kasim, A., Abral, H., Sudirman, S., Sulungbudi, G. T., Rangappa, S. M., & Sari, N. H. (2018). Synthesis and characterization of cellulose nanofibers (CNF) ramie reinforced cassava starch hybrid composites. International Journal of Biological Macromolecules, 120, 578–586. https://doi.org/10.1016/j.ijbiomac.2018.08.134
- T, S. M. K., N, R., A, A., Siengchin, S., A, V. R., & Ayrilmis, N. (2019). Development and Analysis of Completely Biodegradable Cellulose/Banana Peel Powder Composite Films. Journal of Natural Fibers, 18(1), 151–160. https://doi.org/10.1080/15440478.2019.1612811
- Tajeddin, B. (2014). Cellulose-Based Polymers for Packaging Applications. Lignocellulosic Polymer Composites,477–498.https://doi.org/10.1002/9781118773949.ch21
- Tan, S. X., Ong, H. C., Andriyana, A., Lim, S., Pang, Y. L., Kusumo, F., & Ngoh, G. C. (2022). Characterization and parametric study on mechanical properties enhancement in biodegradable Chitosan-Reinforced Starch-Based bioplastic film. Polymers, 14(2), 278. https://doi.org/10.3390/polym14020278
- Thomas, S. K., Parameswaranpillai, J., Krishnasamy, S., Begum, P. S., Nandi, D., Siengchin, S., George, J. J., Hameed, N., Salim, N., & Sienkiewicz, N. (2021). A comprehensive review on cellulose, chitin, and starch as fillers in natural rubber biocomposites. Carbohydrate Polymer Technologies and Applications, 2, 100095. https://doi.org/10.1016/j.carpta.2021.100095
- Wang, J., Wang, L., Gardner, D. J., Shaler, S. M., & Cai, Z. (2021). Towards a cellulose- based society: opportunities and challenges. Cellulose, 28(8), 4511–4543. https://doi.org/10.1007/s10570-021-03771-4
- Wang, X., Tang, Y., Zhu, X., Zhou, Y., & Hong, X. (2020). Preparation and characterization of polylactic acid/polyaniline/nanocrystalline cellulose nanocomposite films. International Journal of Biological Macromolecules, 146, 1069–1075. https://doi.org/10.1016/j.ijbiomac.2019.09.233
- Wei, R., & Zimmermann, W. (2017). Microbial enzymes for the recycling of recalcitrant petroleum‐based plastics: how far are we? Microbial Biotechnology, 10(6), 1308–1322. https://doi.org/10.1111/1751-7915.12710
- Yacob, N., Yusof, M. R., Mohamed, A. Z., & Badri, K. H. (2019). Effect of cellulose fiber loading on the properties of starch-based films. THE 2018 UKM FST POSTGRADUATE COLLOQUIUM: Proceedings of the Universiti Kebangsaan Malaysia, Faculty of Science and Technology 2018 Postgraduate Colloquium. https://doi.org/10.1063/1.5111257
- Yadav, A., Kumar, N., Upadhyay, A., Pratibha, & Anurag, R. K. (2021). Edible Packaging from Fruit Processing Waste: A Comprehensive Review. Food Reviews International, 1–32.https://doi.org/10.1080/87559129.2021.1940198
- Yang, J., Ching, Y. C., Chuah, C. H., Hai, N. D., Singh, R., & Nor, A. R. M. (2021). Preparation and characterization of starch-based bioplastic composites with treated oil palm empty fruit bunch fibers and citric acid. Cellulose, 28(7), 4191–4210. https://doi.org/10.1007/s10570-021-03816-8
The authors declare no competing interests.
- GRAPHICALABSTRACT.png
Graphical Abstract