Study design and sample
State elementary schools in the city of Sao Paulo, Brazil were randomly contacted to select healthy students aged 8 to 10 years, for this analytical cross-sectional study.
The sample size was calculated based on results obtained in an earlier pilot study conducted with six children that used HRmax as outcome variable. Thus, a sample of 235 children was obtained under the assumption that in the test comparing pairs of means (Student’s t-test) for dependent samples, the standard deviation “σ” for HRmax would be 21.16 bpm, with a difference in HRmax between the SRT and VS of 6.33 bpm. We considered a power of 90% and an error of 0.05%.
Protocol
The city of Sao Paulo, Brazil is divided into five regions: east, west, north, south and central. We randomly contacted 5 schools, one from each of these regions, two of which declined to participate. A total of 312 children from the three remaining institutions were invited, 294 of whom completed the questionnaires on medical history and physical activity. Seventeen children were excluded for failing to attend on the day of medical screening, one child refused to be examined, and 34 required further investigations for exhibiting clinical and 12-lead resting electrocardiogram changes. These children were referred to the outpatient clinic for congenital heart defects of the Federal University of Sao Paulo. Of the 242 eligible children, seven who did not appear for testing were considered losses and the remaining 235 were included in the final sample.
The parents first answered a questionnaire on the child’s clinical condition and any family history of heart disease. Next, each child was assessed by a cardiologist, who recorded the child’s medical history and conducted a physical examination. Blood pressure was measured and an electrocardiogram was obtained with the child at rest, in order to rule out cardiovascular disease.
Evaluations
Body mass index
Body mass index (BMI), calculated by dividing body weight (in kilograms) by height squared (in meters) and expressed as Z score28,29, was obtained to assess nutritional status(Table 1). Body weight was measured with the child barefoot, wearing pants and a shirt. Digital scales (G-life®, Magna, China) were used, with a maximum load of 150 kg and resolution of 100 grams. Height was measured using a wall-mounted measuring tape, with the children barefoot, feet parallel and together, standing upright with their arms extended to the sides of their body and head positioned such that the lower part of the eye socket was at the same level as the earhole.
Shuttle run test
In the SRT, also known as the 20-meter running test, participants run 20 meters. The test starts at a standard speed of 8.0 km/h, increasing 0.5 km/h every minute. The participant was advised of the test pace and a beeping sound signaled progression to the next level. The step rate was maintained by a standardized recorded beep played on a Toshiba TR8172MU CD player placed 10 meters away. The children were instructed to complete as many stages as possible. The test was stopped when the child was no longer able to reach within three meters of the 20-meter line at the time of the radio signal30. The shuttle run test was conducted on a flat surface at the multi-sport courts of the schools.
The 20-meter course was marked with two cones and the children performed the tests individually to avoid their competing with other subjects. The raters accompanied all the tests as a safety measure and to encourage the children to complete the course within the time limits established for each stage. The children were verbally encouraged during each stage using standard phrases such as “you’re doing really well” and “keep going” in a clear loud voice to guarantee total comprehension. The completed stages were converted into meters25, 30.
Virtual System
The VS test was conducted in the school video rooms using the Nintendo Wii® Free Run video game (Nintendo Company Ltd., Kyoto, Japan, model RVLSWC/RVLSWFSP), part of the Wii Fit Plus set of games. Free Run consists of producing a virtual running field. The Free Run game takes place on an island in the presence of virtual participants, known as avatars. The children run the race at a steady self-determined pace for 20 minutes, with no obstacles or change in intensity.
A predefined path sets the distance in the game, and since an avatar that represents the player in the virtual environment provides the route, the distance in the real world has no relation to the one presented in the game. The player’s movements are shown on three accelerometers in the Wii motion plus® control. The static race provides body movements in the horizontal and vertical plane and the higher the exercise intensity, the greater the distance covered. To ensure reliable results, the researchers monitored the children throughout the test according to the manufacturer’s instructions, guiding the placement of the control near the body.
Test run time was determined in the virtual system for a maximum of twenty minutes, pre-established by the investigator for the free racing game. Distance was converted from miles to meters and speed was calculated based on time and distance.
Similarly to the shuttle run, the raters accompanied the tests to ensure the children completed the course until the end of the game and to provide verbal encouragement.
To eliminate any possible motivational influence from the VS, the order of the tests was randomized and the child was asked to choose an envelope, to determine which test (VS or SRT) would be performed first. The envelopes were opaque, sealed and numbered sequentially. The children performed the tests one week apart and were instructed not to engage in any physical exercise or sports in the 24 hours preceding each test.
Heart rate
We used a heart rate monitor (Polar, model RS800CX®) to measure HR. The children were monitored at rest for one minute and then throughout the tests. The variables used for statistical analysis were HR at rest and HRmax. A Polar RS800CX® heart rate monitor was set up using Polar ProTrainer 5® software to collect 1-second samples of heartbeats and R-R intervals, in line with the manufacturer’s recommendations for maximum accuracy.
The HRmax data used were the values on the heart monitor display at the end of the exercise. Data stored on the heart monitor were transferred to the software at the end of the data collection sessions and the memory cleared to make room for further data collection.
Data recorded on Polar ProTrainer 5® software served only for visual verification of the R-R curve. The chart indicated that heart rate increased during the tests and remained around HRmax at the end of the exercise. This initial check was used to ensure that a 1-second sample time was not affected by noise from the device.
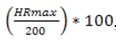
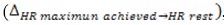
Resting HR was assessed with the children sitting in a comfortable position with their back and lower limbs supported for 60 seconds, after a 5-minute rest. HRmax, defined as the maximum value attained during the SRT and the VS tests, was 200 bpm or higher31. HRmax was also expressed as percentage of the maximum predicted using the equation [Due to technical limitations, this equation is only available as a download in the supplemental files section.], which showed that mean HR was 83 and 72% of predicted HRmax in the VS and SRT tests, respectively. The change in basal heart rate was also calculated [Due to technical limitations, this equation is only available as a download in the supplemental files section.], considering heart rest - HRmax achieved in the VS, expressed as a percentage:
[Due to technical limitations, this equation is only available as a download in the supplemental files section.]
Motivation
To evaluate the influence of motivation on the execution of the SRT and VS, at the end of the tests the children were asked to rate their motivation on a scale from zero to 10, zero being “not cool” and 10 “awesome”. Perceived exertion at the end of the tests was assessed using the modified Borg scale.
Statistical analysis
The Kolmogorov-Smirnov test was applied to determine how well heart rate (resting and maximum), the scale of perceived exertion, and motivation adhered to normal distribution. Descriptive statistics were expressed as means and standard deviations for the numerical variables, and as absolute and relative frequencies for their categorical counterparts. The chi-squared test was used to evaluate the intensity achieved in both tests. The paired Student’s t and Wilcoxon tests were applied to compare the SRT and VS for cardiac output and motivational factors, respectively. The independent Student’s t-test was applied to compare the perceived exertion obtained with the SRT and VS. Multiple logistic regression was performed to analyze cardiac output by observing whether the child had reached HRmax (≥ 200 bpm), using sex, age, nutritional status, motivation and speed in the VS as predictors. Bland-Altman analysis, which examines the agreement between two methods that measure the same parameter, was applied. It evaluated the difference of means (BIAS) between SRT and VS, to show the agreement between them. The Bland-Altman plot has three lines. The center line is the difference of means, while the upper and lower lines are the limits of agreement, which are calculated as ± 1.96 x SD of the difference of means between both methods. The influence of starting the tests with the shuttle run or the virtual system was analyzed using the nonpaired student’s t-test. A 95% confidence interval and significance level of p<0.05 were used for all analyzes. Statistical information was obtained with SPSS statistical software, version 20.0 (SPSS, Chicago, IL, USA).