In this prospective investigation, the cohort comprising of eighty-six patients of high-grade glial tumors with confirmed histopathology and molecularly defined astrocytic component, was considered for analysis. Pre-surgery patient variables including age, sex, tumor location and tumor volume were recorded. The demographic and clinical features of the cohort are represented in online Resource 4. Further patients were classified into grade3 (n = 36) and grade4 (n = 50) by histopathology. After histopathological confirmation, HGG patients were molecularly stratified as per WHO classification 2021. Positivity for GFAP and p53 were noted as IDH mutant (IDH-m) astrocytomas grade3 while positivity of GFAP, negative expression for p53 were marked as IDH-wild type (IDH-w) astrocytomas grade4 GB based on IHC expression pattern (Online Resource 5). After histopathological and molecular classification, the cohort had 36 IDH-m astrocytic patients and 50 IDH-w GB patients with astrocytic component. The median age for grades3 and 4 HGG patients was 38.5 years and 49.5 years while OS was calculated as 23 months and 13 months respectively, indicating that grade 4 patients had poorer survival than grade 3 tumors, a result in line with the report of Jilla et al.[25].
Screening by DIA
Screening for the presence of circulating biomarkers in blood was done by DIA using serum samples. The development of a purple-blue-coloured, insoluble substrate product at the sample loading spot on the NC was considered as a positive result in the assay (Fig. 1A). The signal was scanned using Image J software, the data were tabulated as integrative density (IntDen) of the signal, and the concentration was calculated from the standard series. The median values with their highest and lowest range are tabulated in Table 1. It was observed that the colour signal intensity for each marker was corresponding to the pathological grading of the tumor. The signal intensity in control samples was almost negligible whereas it was significantly higher in grade 4 patient-samples compared to grade 3. After statistical analysis, results indicated that the quantified circulating concentrations of markers in HGG patients could significantly differentiate between grade3 and 4.
Quantification of circulating levels of biomarkers by ELISA
Median values with ranges of all biomarkers in controls, grade-3, and 4 were tabulated in Table 1. Levels of all biomarkers emerged as substantially higher (p < 0.0001) in histological grade 4 compared to grade 3 at baseline when the Mann-Whitney test was applied. ELISA results also indicated that these markers can significantly differentiate between grade 3 astrocytoma IDH-m and grade 4 astrocytomas IDH-w based on their circulating levels.
Table 1
Systemic levels of molecular markers in high grade glioma (grade 3 and 4) and controls using two techniques Dot Immuno assay and Enzyme linked sorbent assay.
|
S. No.
|
Molecular markers
|
DIA
(IntDen. x103)
|
ELISA
(ng/ml)
|
|
Controls
|
Grade 3 (IDH-m)
|
Grade 4
(IDH-w)
|
Controls
|
Grade 3
(IDH-m)
|
Grade 4
(IDH-w)
|
|
1
|
iNOS
|
2.7
(1.8–3.4)
|
4.0
(5.7–6.6)
|
6.4
(3.8–8.6)
|
0.007
(0.001-0.2)
|
4.440
(0.34–16.2)
|
22.1
(9.83–85.28)
|
|
2
|
HSP70
|
3.47
(1.3–5.4)
|
7.39
(4.12–9.32)
|
12.7
(5.67–21.8)
|
19.48
(7.23–29.12)
|
24.06
(8.9–38.3)
|
38.126
(17.9–89.7)
|
|
3
|
IL6
|
1.7
(1.0-2.8)
|
1.9
(1.3–2.5)
|
6.3
(5.7–6.9)
|
18.09
(6.8–41.4)
|
116.258
(48.2-679.1)
|
276.39
(116.7-942.9)
|
|
4
|
VEGF
|
5.2
(4.7-6.0)
|
6.2
(6.0–1.0)
|
9.4
(6.5–1.6)
|
10.22
(0.09–19.2)
|
25.98
(10.23–96.4)
|
53.141
(20.9-449.2)
|
|
5
|
ET1
|
6.2
(5.7–6.4)
|
7.0
(6.7–7.5)
|
9.6
(6.6–7.8)
|
0.1805
(0.012-0.5)
|
1.969
(0.642-4.9)
|
7.387
(4.56–36.3)
|
|
6
|
MMP14
|
5.04
(0.4–39.5)
|
9.72
(1.19–55.78)
|
19.14
(3.97–57.89)
|
3.668
(0.89–6.89)
|
13.4
(6.24–31.2)
|
29.81
(12.6-78.26)
|
|
7
|
ICAM1
|
1.7
(1.0-8.7)
|
1.8
(1.2–2.2)
|
5.6
(5.0-7.1)
|
0.4935
(0.04–1.7)
|
6.728
(1.09-17.0)
|
20.447
(10.12–29.7)
|
The above table depicts the median values of all circulatory biomarkers with their ranges in controls, grade 3 and grade 4. The median values of grade 4 for all markers was higher compared to grade 3 and controls a evaluated by both techniques, indicating that systemic markers increase with increasing grades.
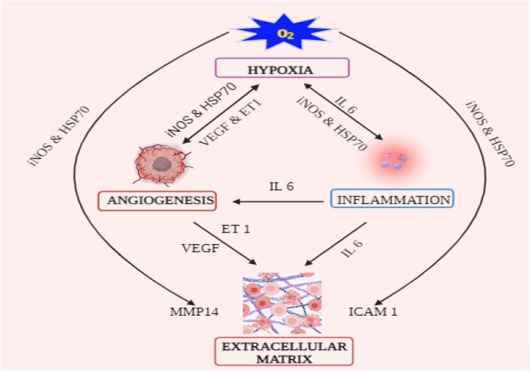
The association of systemic levels gave a positive correlation with the grades; the best value was for HSP70 and MMP14 (r = 0.5660 & 0.5607, p < 0.0001). Spearman correlation coefficient results showed a strong significant inverse correlation with OS, the best value was for ET1 (r=-0.7361, p < 0.0001) among all biomarkers (values are represented in Table 2), indicating a poor prognosis with increasing circulatory levels of all seven markers in treatment naive HGG patients. Analysis was also performed to check the association of systemic hypoxia (iNOS, HSP70) with rest of the molecular markers i.e. VEGF, ET1, IL6, MMP14 and ICAM1.Hypoxia was strongly positively associated with angiogenic markers VEFF and ET1 (r = 0.7861 & 0.7289, p < 0.0001) and moderately associated with rest of the markers, suggesting that the expression of the secreted TME components was linked to systemic hypoxia. Therefore, these markers should be evaluated to assess the actual status of tumor microenvironment components contributing to tumor development and to define the prognosis.
Table 2
Spearman coefficient correlation of circulatory markers in terms of histological grades and overall survival
|
S.No.
|
Circulatory markers
|
Spearman r
|
95% CI
|
p-value
|
| |
Correlation with histological grades 3 & 4
|
|
1.
|
iNOS
|
0.5308
|
0.3842 to 0.7051
|
< 0.0001****
|
|
2.
|
HSP70
|
0.5660
|
0.3489 to 0.7896
|
< 0.0001****
|
|
3.
|
IL6
|
0.5318
|
0.6062 to 0.8259
|
< 0.0001****
|
|
4.
|
VEGF
|
0.5498
|
0.4636 to 0.7506
|
< 0.0001****
|
|
5.
|
ET1
|
0.5313
|
0.5493 to 0.7968
|
< 0.0001****
|
|
6.
|
MMP14
|
0.5607
|
0.3945 to 0.6978
|
< 0.0001****
|
|
7.
|
ICAM1
|
0.4454
|
0.5424 to 0.7932
|
< 0.0001****
|
| |
Correlation with OS
|
|
8.
|
iNOS
|
-0.6522
|
-0.5790 to -0.1863
|
0.0003**
|
|
9.
|
HSP70
|
-0.5281
|
-0.5162 to -0.7259
|
< 0.0001****
|
|
10.
|
IL6
|
-0.7004
|
-0.7014 to -0.3780
|
< 0.0001****
|
|
11.
|
VEGF
|
-0.7260
|
-0.6101 to -0.2324
|
< 0.0001**
|
|
12.
|
ET1
|
-0.7361
|
-0.6009 to -0.2187
|
0.0001***
|
|
13.
|
MMP14
|
-0.6156
|
-0.5989 to -0.2578
|
< 0.0001**
|
|
14.
|
ICAM1
|
-0.6872
|
-0.6267 to -0.2576
|
< 0.0001**
|
| **** Extremely significant; **** highly significant, ** significant |
A moderate but statistically significant positive correlation of, iNOS, HSP70, IL-6, VEGF, ET1, MMP14 and ICAM1 was obtained with respect to histological grades, a significant inverse correlation with respect to overall survival, indicated that higher the levels of biomarkers predicted a poor prognosis.
Log Rank analysis
The cut-off thresholds based on AUC for the seven systemic biomarkers at more than 90% specificity and AUC > 0.7, when comparing controls versus HGG patients and between grades are listed in Table 3. AUROC analysis established the cut-off points for the best equilibrium of sensitivity and specificity with likelihood ratio to predict survival.
Table 3
AUROC analyses of quantified levels of biomarkers between control and high grade glioma; also between grade 3 and 4 to best predict survival.
|
S. No
|
markers
|
category
|
AUC
|
Std. Error
|
95%CI
|
Cut-off
|
Sensitivity
(%)
|
Specificity
(%)
|
p-value
|
|
1
|
iNOS
|
Con & HGG
|
0.82
|
0.03
|
0.75 to 0.89
|
> 0.142
|
100
|
96.67
|
< 0.0001
|
|
G 3 & 4
|
0.81
|
0.04
|
0.72 to 0.90
|
> 6.38
|
66.67
|
75
|
< 0.0001
|
|
2
|
HSP70
|
Con & HGG
|
0.87
|
0.02
|
0.81 to 0.93
|
> 12.34
|
80
|
91
|
< 0.0001
|
|
G 3 & 4
|
0.83
|
0.04
|
0.74 to 0.91
|
> 34.24
|
70
|
86.11
|
< 0.0001
|
|
3
|
IL6
|
Con & HGG
|
0.81
|
0.03
|
0.73 to 0.88
|
> 37.13
|
70
|
80.43
|
< 0.0001
|
|
G 3 & 4
|
0.81
|
0.04
|
0.72 to 0.89
|
> 220.6
|
66.67
|
96.88
|
< 0.0001
|
|
4
|
VEGF
|
Con & HGG
|
0.85
|
0.03
|
0.78 to 0.92
|
> 22.07
|
81.40
|
78.26
|
< 0.0001
|
|
G 3 & 4
|
0.82
|
0.04
|
0.73 to 0.90
|
> 38.33
|
62.22
|
81.25
|
< 0.0001
|
|
5
|
ET1
|
Con & HGG
|
0.97
|
0.01
|
0.95 to 1.00
|
> 1.078
|
93.02
|
95.65
|
< 0.0001
|
|
G 3 & 4
|
0.81
|
0.04
|
0.71 to 0.99
|
> 2.702
|
80
|
81.25
|
< 0.0001
|
|
6
|
MMP14
|
Con & HGG
|
0.97
|
0.01
|
0.94 to 0.99
|
> 1.739
|
93.02
|
97.78
|
< 0.0001
|
|
G 3 & 4
|
0.76
|
0.05
|
0.66 to 0.86
|
> 0.02
|
87
|
93
|
< 0.0001
|
|
7
|
ICAM1
|
Con & HGG
|
0.93
|
0.02
|
0.89 to 0.97
|
> 6.934
|
80.23
|
95.65
|
< 0.0001
|
|
G 3 & 4
|
0.82
|
0.04
|
0.74 to 0.91
|
> 17.33
|
80
|
78.13
|
< 0.0001
|
AUROC analysis was performed for all seven chosen markers of tumor microenvironment between control and high grade glioma and between grade 3 and grade 4. The AUC values indicated that the biomarkers have predictive ability to discriminate high grade glioma from control on the basis of their increased levels of expression. These can also differentiate grade 4 HGG patients from grade 3 with set sensitivity and specificity.
Accordingly, concentrations of iNOS, HSP70, IL-6, VEGF, ET1, MMP14 and ICAM1 were set at 155.9ng/ml, 6.38ng/ml, 38.33ng /ml, 2.702ng/ml and 17.33ng/ml respectively. Patients with values greater than these cut-offs were observed to have a shorter survival duration. As is evident from the analysis, OS was better in patients with grade3 astrocytoma than in grade4 (Fig. 2a-2g). The best markers for prognosis as per analysis were ET1, ICAM1, and IL6 based on their hazards ratio.
CombiROC Analysis
The sensitivity of iNOS, HSP70, IL-6, VEGF, ET1, MMP14 and ICAM1 as individual markers was 77.7%, 66.67%, 78%, 62.2%, 80%, and 80% respectively, which increased to 100% in combination with 100% specificity and an AUC of 1.0 as seen in combination XXII (Fig. 2(h-i)).
Prognostication and confounding factors
To identify the possible prognostic factors, the association of iNOS, HSP70, IL-6, VEGF, ET1, MMP14, ICAM1 and other confounding variables namely age, site, EOR, therapy and tumor volume with OS was assessed using Cox-regression models (Online Resource 6). Univariate followed by multivariate regression model was applied, higher circulating levels of all chosen biomarkers were found to independently define prognosis. All the markers were also independent of the above confounding factors (p > 0.05).
DIA as a screening tool
This is the first report of using DIA as a screening tool in the clinical setup to define the precise histo-grade and predict prognosis. Spearmen coefficient correlation was performed to compare the AUCs generated by both the techniques DIA and ELISA for circulating levels of biomarkers and the values were comparable for all the markers with an average AUC of 0.9 (Fig. 1C & 1D). The outcome indicates that the DIA technique can be used as a screening tool to non-invasively evaluate differential expression of the seven marker panel in glioma patients for monitoring disease progression. The circulating concentrations of the markers in controls and grade 2 are also presented in Online Resource 7.
Validation of expression of markers by ICC
Corresponding to the expression of biomarkers iNOS, HSP70, IL6, VEGF, ET1, MMP14 and ICAM1 in ELISA, their circulating expression on PBMCs was observed as nuclear, cytoplasmic or membranous (Fig. 1B). Quantification of expression was done using ImageJ software in grade 3 and 4 glioma samples in comparison to controls. The fluorescence signal for each marker is presented as median value with range is tabulated (Fig. 1D).
When Spearman coefficient correlation test was applied for all seven biomarkers evaluated by both techniques ICC and ELISA, a positive association was obtained (Fig. 1D). Concomitant values for AUROC in both techniques showed that the markers can be evaluated by any one of them with similar sensitivity with an average AUC of 0.89. Thus, the expression of the marker panel was validated non-invasively by using liquid biopsy.
Comparative analysis of IF-IHC based in situ expression and ELISA
The median values of level of expression for all seven biomarkers were higher in grade 4 compared to grade 3 and controls in both tissue and blood samples. The quantified tissue expression of all seven biomarkers (online resource 8) representing the 4 components of tumor microenvironment was positively significantly and concomitant with the circulatory levels (p < 0.0001), thus indicating that in addition to tissue; systemic levels of these biomarkers can be used as a relatively reliable parameter with high sensitivity, for predicting patient outcome.