The Institutional Review Board of our hospital approved this retrospective single-center study (No. ***blinded***) and waived the requirement for informed consent.
Patients
Between May 2017 and August 2023, 125 consecutive patients who underwent breast MRI at our hospital and satisfied the following inclusion criteria were included: 1) negative initial mammography and ultrasound findings; 2) BI-RADS category 4 or 5 evaluated on MRI; 3) complete clinical and MRI data; 4) complete pathological information or lesions without pathological results but with more than 12 months of follow-up; and 5) no previous treatment for breast lesions prior to the MRI examination. Exclusion criteria were: 1) poor image quality impacts lesion margin delineation and segmentation (n = 5); 2) lesions not detected on DWI or only on one slice of DWI image (n = 25); 3) nonmass enhancing lesions (n = 5). When multiple lesions were present in the ipsilateral breast, the largest lesion with pathological results or follow-up assessment was selected for analysis. Ultimately, 90 lesions (mean size, 7.40 ± 0.22 mm) in 90 patients (mean age, 50.79 ± 10.86 years) were included in this study. These 90 patients were randomly divided into a training cohort (n = 62) and a validation cohort (n = 28). A flow chart of patient selection is presented in Fig. 1.
Forty of the 62 women included in the training cohort overlapped with the patient sample from a single-center study evaluating the performance of quantitative ADC metrics based on large 2D-ROI measurements in distinguishing MRI-only suspicious lesions(18). Beyond that, in the present study, we wished to ascertain whether ADC-based histogram parameters are of added value for the classification of MRI-only suspicious lesions.
MRI examination protocol
All MRI examinations were performed on two 3.0-T MRI systems (Discovery 750, GE HealthCare, Anaheim, CA, USA; Prisma, Siemens HealthCare, Erlangen, Germany) using a dedicated eight-channel phased-array breast coil. Patients were placed in the prone position during their MRI examinations in our hospital. The breast MRI protocol in this study included DWI with ADC maps, fat-suppressed T2-weighted fast spin echo imaging, and standard-of-care dynamic contrast-enhanced imaging (DCE) images.
DCE images were used to provide a reference for ROI delineation of DWI images with gadolinium-based contrast agent administered intravenously at a rate of 2.5 mL/s via an auto-injector and acquired at seven consecutive time points before and after contrast agent administration. DWI sequence was obtained using a single-shot echo-planar imaging sequence before contrast injection. Detailed DWI acquisition information is presented in Table 1.
Table 1
| Parameters | GE Discovery 750 | Siemens Prisma |
| Sequence | Single-shot spin-echo-echo-planar imaging | Single-shot spin-echo-echo-planar imaging |
| TR (ms) | 7000 | 7140 |
| TE (ms) | 60 | 46 |
| FOV (mm2) | 340×340 | 350×350 |
| Acquisition matrix | 160×96 | 184×100 |
| Voxel size (mm3) | 2.1× 3.5× 3.0 | 1.9×3.5× 3.0 |
| Slice thickness (mm) | 3.0 | 3.0 |
| No. of sections | 48 | 48 |
| Fat suppression | Frequency selection saturation | Water excitation |
| b values (s/mm2) | 50, 1000 | 50, 1500 |
| Averages | 2 (b = 50), 7 (b = 1000) | 2 (b = 50), 7 (b = 1500) |
| Diffusion mode | 3-Scan Trace | 3-Scan Trace |
| Note- DWI, Diffusion-weighted imaging; TR, Repetition time; TE, Echo time; FOV, Field of view. |
Clinicopathological data collection
The clinical data, including age and menopause status, were recorded for each enrolled patient based on information collected from the electronic healthcare system.
Pathological information was collected from the pathology report for each enrolled patient. For benign lesions for which the radiologist did not request a biopsy, the diagnosis was based on the patient’s clinical history and previous MRI with at least 12 months of follow-up after the first diagnosis. All MRI-only lesions were divided into benign and malignant groups based on the pathological findings and follow-up assessments.
MRI analyses
Conventional MRI interpretation
Two radiologists (R1 and R2, with 4 and 10 years of experience in breast MRI diagnosis, respectively) independently interpreted all cases referring to the 2013 version of the BI-RADS MRI lexicon without any knowledge about the patient’s clinicopathologic information and the initial MRI report. In case of disagreement, these two radiologists reviewed the results together with a third radiologist with 15 years of experience in breast MRI diagnosis to reach a consensus.
The evaluation criteria for morphological features of these masses were as follows: margin (circumscribed/not circumscribed), shape (round or oval/irregular), and internal enhancement characteristics (homogeneous/heterogeneous or rim enhancement).
The kinetic patterns of the masses were assessed by generating and analyzing a time–intensity curve (TIC). The two radiologists used FuncTool software (AW4.6, GE) to delineate the ROI (area between 2 and 4 mm2) of the most suspicious part in the lesion on DCE images to generate TIC. In this study, TICs were classified into two categories: persistent/plateau and washout.
In addition, the two radiologists measured and recorded the longest diameter in the largest cross-section of the mass on the early-phase images of the DCE. Ultimately, lesion size was defined in this study as the average of measurements made by the two radiologists.
ADC analysis
Lesion segmentation A radiologist (R1) manually delineated ROIs slice by slice along the lesion boundary on DWI with a b-value of 1,000 or 1,500 s/mm2 using ITK-SNAP (version 4.0.0; www.itksnap.org) to cover the entire lesion as much as possible. The early-phase images of the DCE were used to guide lesion delineation. To assess the interclass correlation coefficient (ICC), 40 randomly selected MRI-only lesions were reanalyzed by the other radiologist (R2). Clinicopathologic data were blinded to both the radiologists.
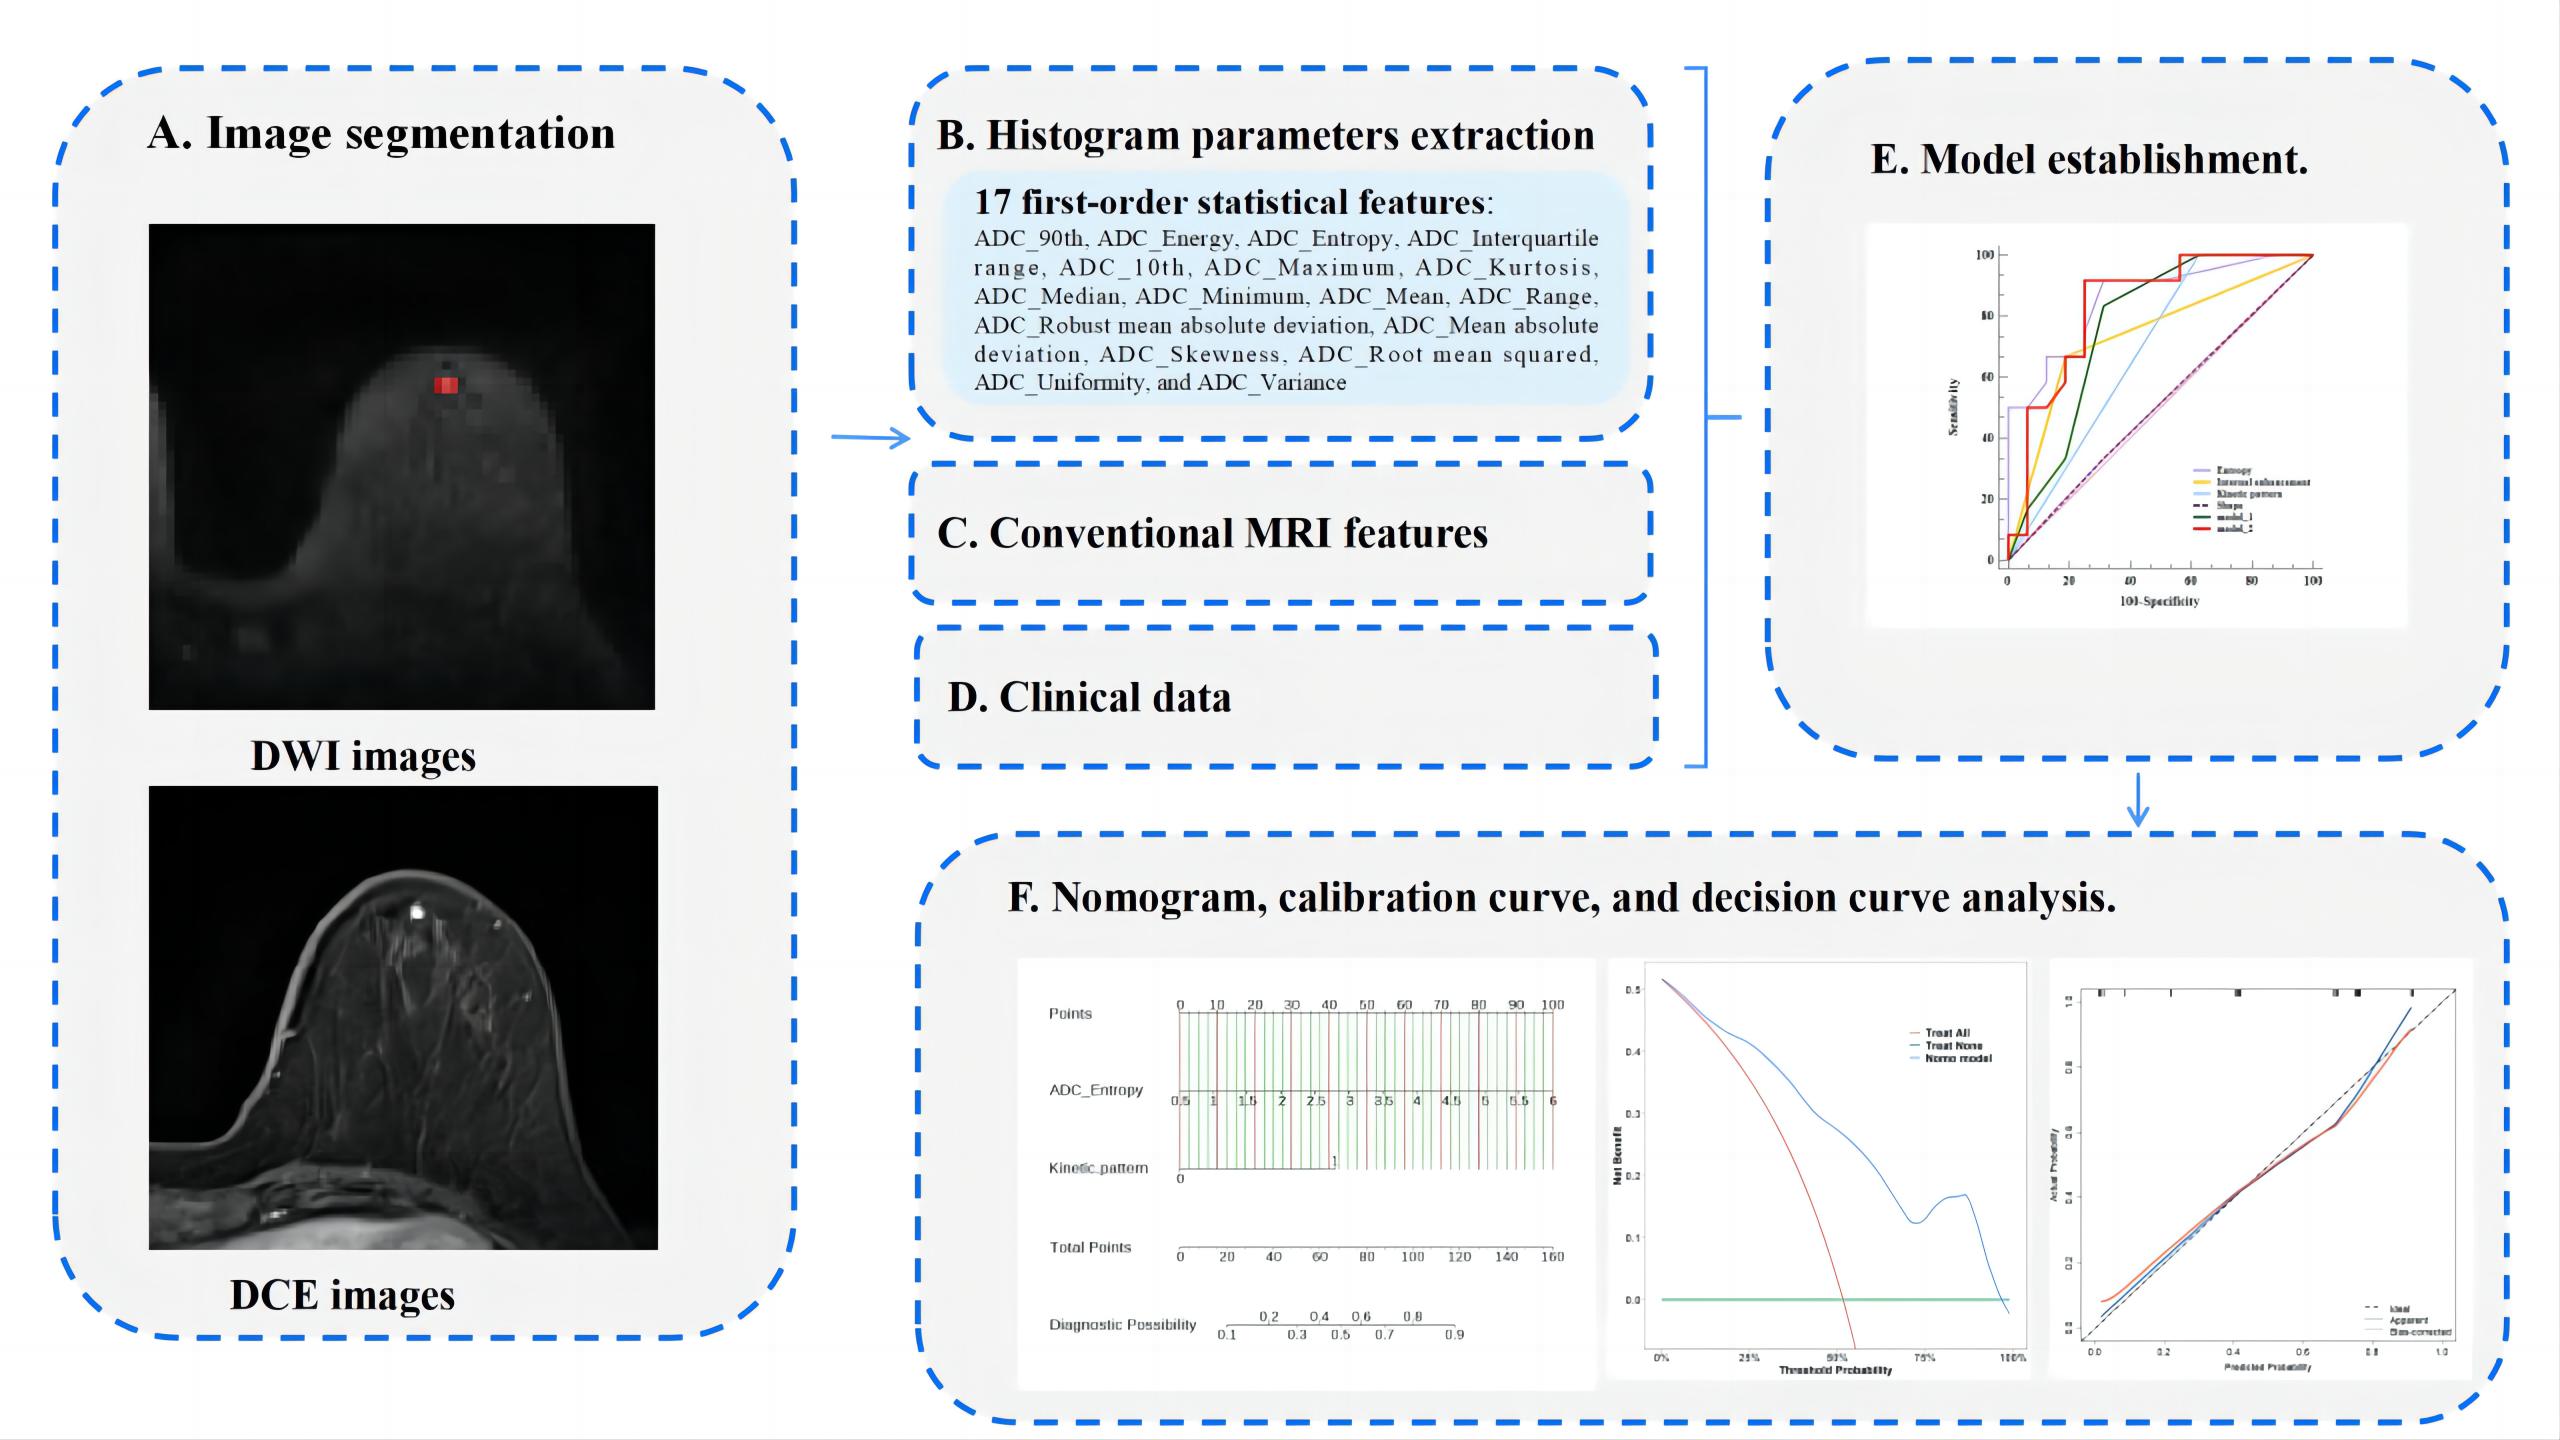
Histogram analysis Histogram analysis was performed using the Radiomics module of the Intelligent Space for Medicina Scientia (ISMS, version 2.6, Philips Healthcare) platform. This module is based on the open-source Python package PyRadiomics (version 3.0.1). The DWI and ADC maps were resampled to the same resolution (1 * 1 * 1 mm) before histogram parameter extraction, and the number of histogram bins was set to 10. A total of 17 first-order statistical features were extracted from ROIs, including ADC 90th percentile, energy, entropy, interquartile range, 10th percentile, maximum, kurtosis, median, minimum, mean, range, robust mean absolute deviation, mean absolute deviation, skewness, root mean squared, uniformity, and variance.
Supplementary Fig. 1 depicts the workflow of histogram parameter extraction and nomogram construction for MRI-only suspicious lesions.
Statistical analysis
All statistical analyses were performed using the statistical package R (version 4.2.3; https://www.r-project.org), SPSS software (version 26; IBM, Chicago, USA), and MedCalc software (version 15.6.1; Ostend, Belgium). All statistical hypothesis tests were two-sided, and P-values < 0.05 were regarded as statistically significant.
The normality of continuous variables was assessed using the Kolmogorov–Smirnov test. Continuous variables conforming to a normal distribution were presented as mean ± standard deviation, whereas data not normally distributed were presented as median. For univariate analysis, Student’s t-test, Mann–Whitney U-test, or chi-square test were used as appropriate to compare clinicoradiologic characteristics and histogram parameters between benign and malignant groups of MRI-only suspicious lesions. Variables with a P-value < 0.05 in univariate analysis were included in multivariate analysis using backward logistic regression to identify independent predictors for distinguishing between the two groups. A prediction model was built based on combined significant predictors, and the corresponding prediction nomogram was built. The area under the receiver operating characteristic (ROC) curve (AUC), accuracy, sensitivity, and specificity were used to evaluate the ability of the independent predictors and the prediction model, and their AUCs were compared using DeLong’s test. Calibration curves were drawn by bootstrapping (1000 bootstrap resamplings) to assess differences between predicted and actual results of the nomogram, and calibration was evaluated using the Hosmer–Lemeshow test. In addition, decision curve analysis was used to determine the clinical usefulness of the nomogram by calculating the net benefit of the model at different threshold probabilities.
Interobserver variability in ADC histogram parameters was evaluated using the ICC, and the results were interpreted as follows(19): 0.4–0.75, moderate; 0.75–0.9, good; 0.9–1.0, excellent.