Pharmacophore Analysis
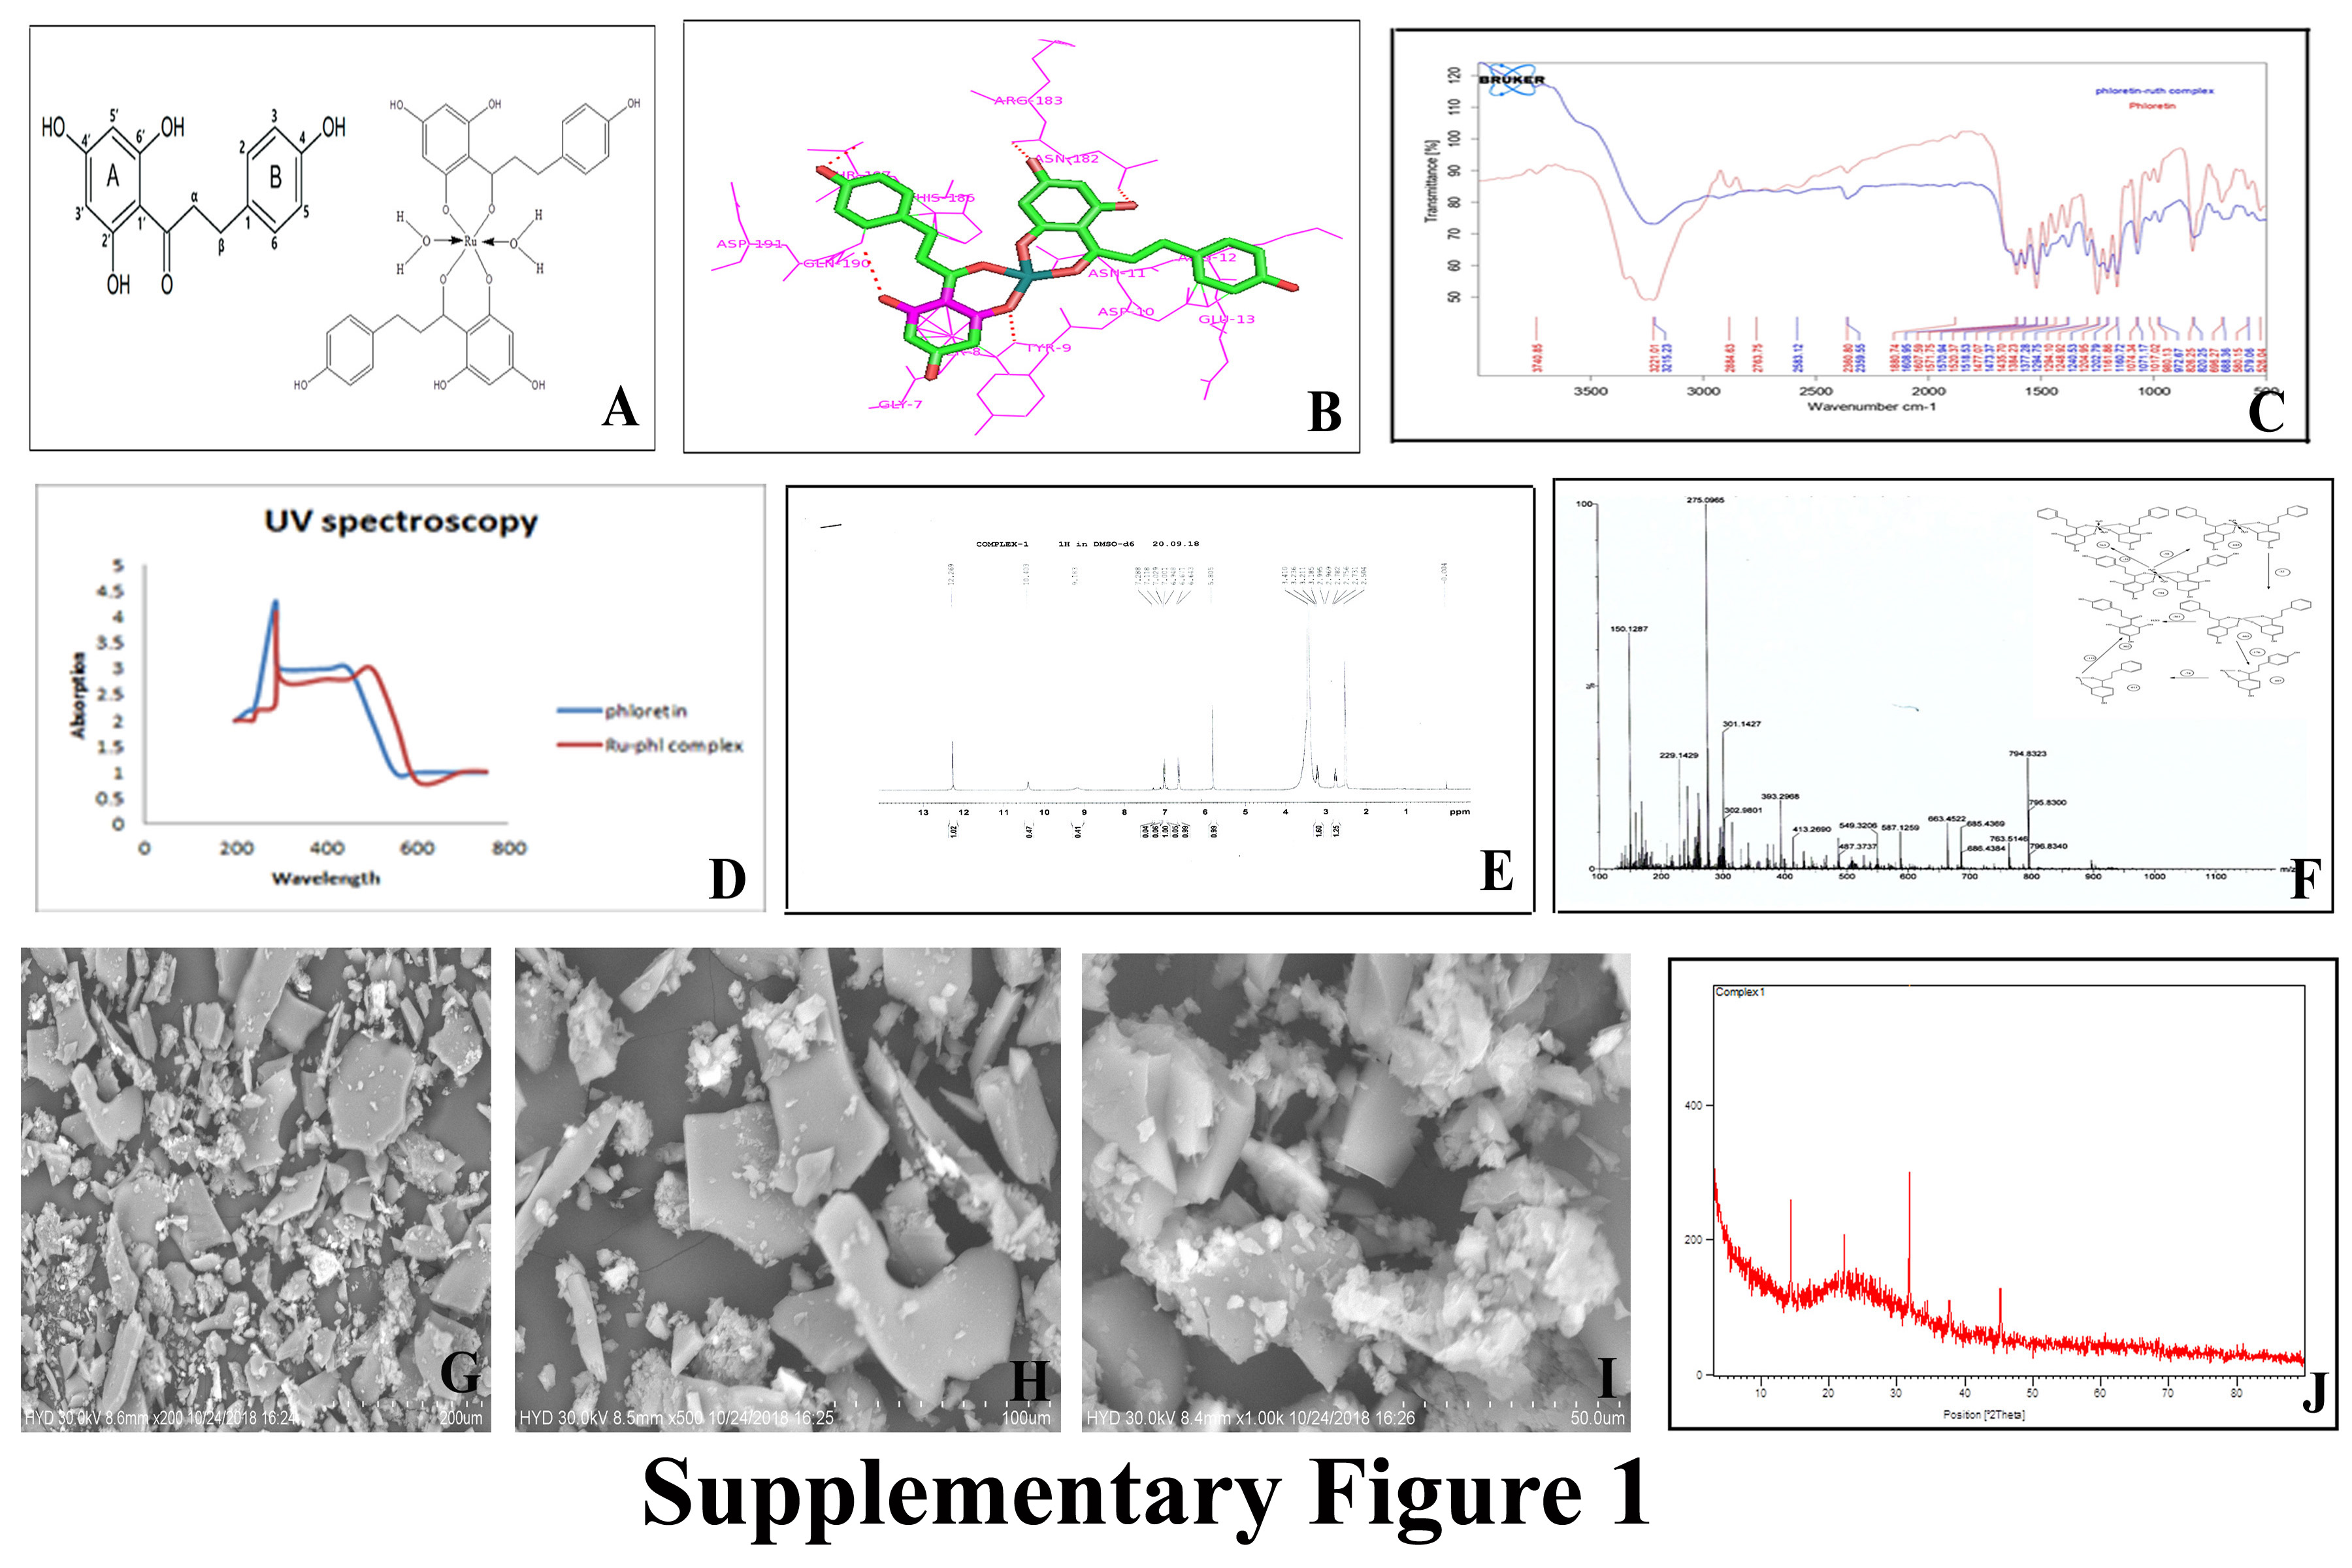
The docking results shows that Bcl-2 protein is strongly binds with ruthenium-phloretin within active site amino acids of both polar and electrostatic interactions within target amino acids of Tyr9, Asn182, Arg183, Thr187 and Gln190, with strong hydrogen bonding of -9.52 kcal/mol of energy. (Table 1 and Supplementary Figure 1B)
Table 1: Ligand with its binding energy values from docking studies
|
Ligand
|
No of H-bonds
|
Binding Energy
|
Inhibitory constant
|
Amino Acids
|
|
Ruthenium-phloretin
|
5
|
-9.52
|
11.6
|
TYR 9, ASN 182, ARG 183, GLN 190 and THR 187
|
In vitro antioxidant activity of ruthenium phloretin complex
Ruthenium phloretin complex scavenges DPPH, FRAP and ABTS radicals
It has been ascertained that the absorbance of ABTS at 734 nm declined dramatically by fluctuating the concentrations complex in the solution (Figure 1 A). Compared to free phloretin the complex was capable of scavenging free radical quite successfully in the presence of ABTS, which might be directly linked to the hydroxyl functional group and their ability to donate hydrogen atoms.
Figure 1(B) demonstrated the power of phloretin and ruthenium-phloretin complex in scavenging of radicals, where the chart implied that phloretin scrounged free radical to almost 43 per cent, while the complex was able to scrounge to about 79 percent of free radicals.
Reduction in Fe+3-TPTZ absorption spectrum was ascertained at 593 nm with the interaction of phloretin and ruthenium-phloretin complex. Figure 1(C) reinforces that the ruthenium phloretin has an antioxidant capacity greater than just phloretin.
Ruthenium-phloretin complex binds with CT-DNA
A significant reduction in absorption intensity (hypochromism) is confirmed following the addition of increasing concentrations of the complex to CT-DNA (Figure 1 D). After varying the concentrations of the complex in the DNA solution, the increase in the absorption is easily detected which can be associated with the intra-ligand transition band at 383 nm. Such spectroscopic details indicate that complex interferes with the binding of DNA by displaying a stacking activity between the ligand's chromophore by intercalative pattern association with the DNA base pairs.
In vitro Assessment
Ruthenium phloretin complex instigates the suppression of cell viability of MCF‐7 and MDA-MB-231 cells
The cell viability assessment designated that ruthenium–phloretin complex displayed a dose‐dependent inhibitory effect on MCF‐7 and MDA-MB-231 human breast cancer cells (Figure 2 A & B). The viability of the MCF-7 cells following treatment was found to decrease to 68.84%, 57.03%, and 33.43% at concentrations of 30, 60, and 120 μM respectively. Similar results were noted in MDA-MB-231 cells where viability of the cell was found to decrease to 57.19%, 51.64 %, and 43.33 % at concentrations 10, 30, and 60 μM after 24 hours.
Ruthenium-phloretin complex causes chromatin condensation within MCF‐7 and MDA-MB-231 cells.
Figure 2 C & D shows that the complex induces nuclear condensation in a dose dependent manner in both cell lines. It was observed that the treatment with 120 μM of complex in MCF-7 cells and 60 μM of the complex in MDA-MB-231 cells exhibited the maximum condensation of chromatin, after 24 hours and signifies the highest expanse of apoptosis.
Ruthenium phloretin complex induces colony inhibition capability of MCF‐7 and MDA-MB-231 cells
Ruthenium-phloretin complex successfully induces colony inhibition capability of MCF‐7 and MDA-MB-231 cells (Figure 2E) The complex was significantly more effective in inhibiting both colony number (figure 2 F&G) and size (figure 2 H&I) of MCF‐7 and MDA-MB-231 cells compared with untreated control cells. The plate efficiency (PE) for complex in both MCF‐7 and MDA-MB-231 cells (figure 2 J&K) show significantly reduced PE at highest concentrations of complex in both MCF‐7 and MDA-MB-231.
Effect of ruthenium-phloretin complex in cell cycle analysis and measurement of apoptotic assay by flow cytometry
Figure 3 A & D exhibited the allotment of MCF-7 and MDA-MB-231cells undergoing apoptosis following treatment with various concentration of the complex after 24 hours. Figure 3 B shows that the percentages of apoptotic cell are 16, 39.07 and 44.7 % following treatment with 30, 60, and 120 μM of the complex in MCF-7 cells and figure 3 E represents 17.9, 42.25 and 46.9 % of MDA-MB-231 cells undergoing apoptosis following treatment with 10, 30 and 60 μM of the complex in MDA-MB-231. Moreover, a dose dependent increment in early apoptotic cell population was also observed in the cells after 24 hours of treatment with the complex (Figure 3 C & F).
The number of sub diploid cells is represented by the apoptotic cells in the cell cycle histogram (Figure 3 G & H). The MCF-7 treated with 30 µM, 60 µM and 120 μM of the complex denoted 65.71 %, 61.18 % and 52.97 % cells in the G0/G1 phase. Similar results were noted in MDA-MB-231 cells, where treatment with 10 µM, 30 µM and 60 μM of the complex showed 63.77 %, 55.66 % and 41.94 %cells in the G0/G1 phase. Simultaneously, an increase of cells in the S-phase was noted after complex treatment in a dose dependent manner (Figure 3 I&J) in both cell lines.
Effect of ruthenium–phloretin complex on Caspase 3 expression in MCF and MDA-MB-231 cells
Figure 3 K&L represented the flow cytometric analysis of caspase 3 activity of ruthenium phloretin complex on MCF-7 and MDA-MB-231cells at different concentration after 24 hours of complex treatment. Following drug treatment, the number of caspase 3 designated apoptotic cells in M2 quadrant is significantly higher than the living cells present in M1 quadrant while untreated cells showing significantly much number of living cells in quadrant M1 as compared to the caspase 3 designated apoptotic cells in M2.
Effect of ruthenium–phloretin complex in expression of PI3K, Akt, mTOR, EGFR, VEGF, and cleaved caspase 3 in MCF 7 and MDA-MB-231 cells.
Figure 3 M, shows a dose‐dependent down-regulation of PI3K, Akt, mTOR, EGFR and VEGF following 24 hours of treatment with ruthenium–phloretin complex in both MCF 7 and MDA-MB-231 cells. A notable up-regulation of cleaved caspase 3 was however observed in both MCF 7 and MDA-MB-231 cells following 24 hours of treatment with ruthenium–phloretin complex.
In vivo carcinogenesis study
Histological analysis
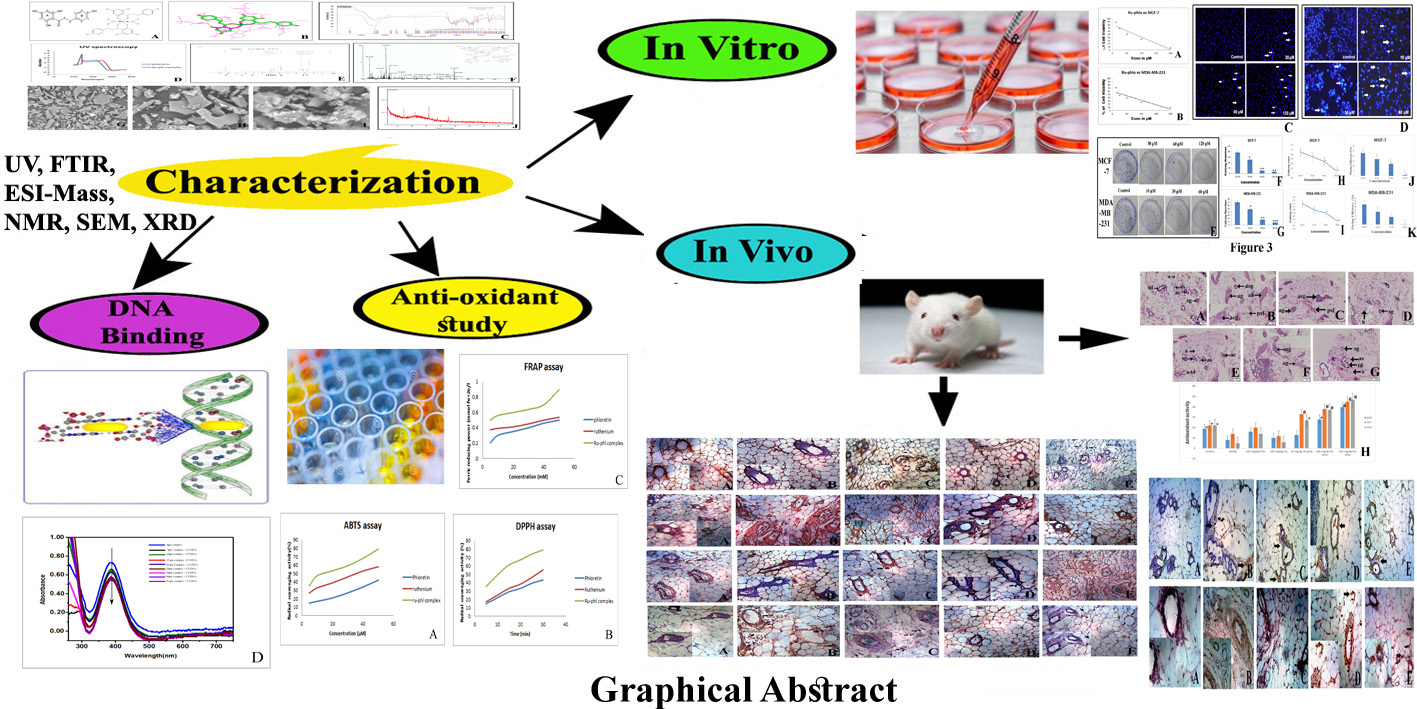
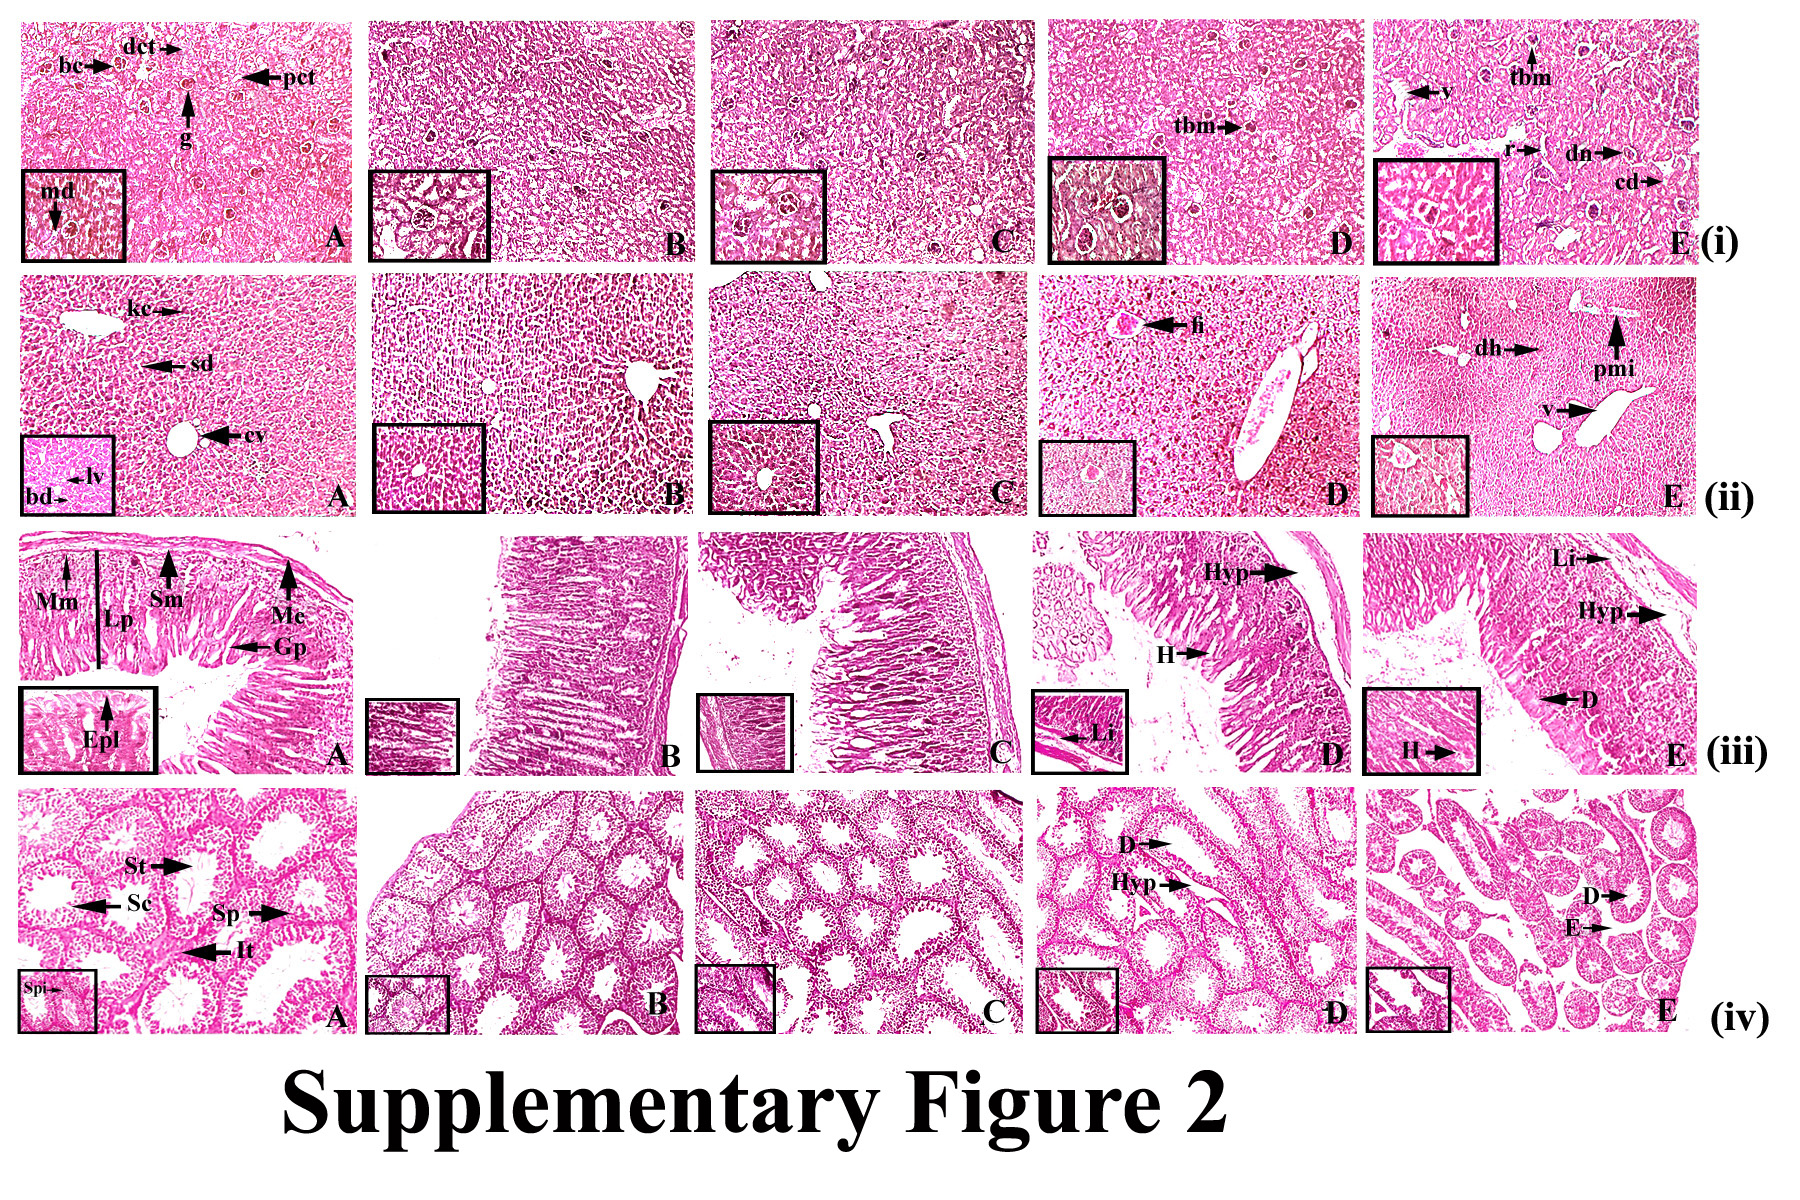
Figure 4A the normal control displayed conserved normal alveoli (a), alveolar septa (as), terminal duct lobular units (td), acinus (ac) and serous gland (sg) of mammary tissue. DMBA-treated mammary tissue displayed atrophy of glands with periductal, stromal fibrosis and fatty tissue (psf), atrophy of glands with surrounding fatty tissue (ag), atrophy of serous glands (asg) surrounding stromal fibrosis, hyperplasia of serous and mucinous glands(ah) (Figure 4B). Complex treatment groups of 50 and 100 mg / kg showed slight hyperplasia of serous and mucous glands (Figure 4 C&D), whereas the highest dose group displayed perfect histological profile with no signs of hyperplasia or cell proliferation in breast tissue, and standard architecture of the cells that line the ducts. (Figure 4 E). Phloretin‐treated group showed standard histopathologic pattern of rat breast tissue (Figure 4G) while ruthenium‐treated DMBA group represented atrophy of glands with encompassing fatty tissue (ag) and necrosis of serous glands (asg) (Figure 4F).
Antioxidant activity
The homogenized mammary tissue of the DMBA-treated rats was found with a decline in SOD, CAT and diminished glutathione levels. The animals treated with 200 mg / kg of the complex showed a prominent increase in the levels of SOD, CAT and glutathione in the homogenized mammary tissues as opposed to carcinogen control and other groups (Figure 4 H).
Immunohistochemical analysis
The presence of cellular biomarkers were assessed by the immunohistochemical staining techniques (Figure 5) (Table 2). It was observed that DMBA administration increased the levels of Bcl-2 [Figure 5 (ii) B] and MMP-9 [Figure 5 (iv) B] in a significant way whereas downregulating the expressions of Bax[Figure 5 (iii) B], p53 [Figure 5 (i) B] levels compared to the normal control group [Figure 5 (i), (ii), (iii) & (iv) A] (p<0.05). Ruthenium-phloretin therapy significantly increased the expressions of Bax [Figure 5 (iii) C, D & E] and p53 [Figure 5 (i) C, D & E] however a down regulation of Bcl-2 [Figure 5 (ii) C, D & E] and MMP-9 [Figure 5 (iv) C, D & E] were noted following ruthenium-phloretin therapy.
Table 2: Effect of ruthenium (Ru), phloretin (phl) and ruthenium phloretin complex (Ru- phl) on the expression of Bax, Bcl2, p53 and MMP9 in breast tissues.
|
Groups
|
Bax§
|
Bcl2§
|
p53§
|
MMP9§
|
|
Control
|
7.2 ± 0.8
|
7.9 ± 0.1
|
8.2 ± 0.9
|
8.6 ± 0.4
|
|
DMBA
|
4.3 ± 0.4
|
15.4 ± 1.8
|
3.9 ± 0.4
|
19.4 ± 0.9
|
|
Ru-phl 50 mg/kg
|
5.7 ± 0.1**
|
12.4 ± 0.1**
|
6.5 ± 0.8
|
15.2 ± 0.5
|
|
Ru- phl 100 mg/kg
|
9.1 ± 0.6*
|
9.6± 0.2**
|
9.5 ± 0.1**
|
12.2 ± 0.5**
|
|
Ru- phl 200 mg/kg
|
11.7 ± 1.8*
|
7.3 ± 0.5*
|
14.4 ± 0.6*
|
10.3 ± 0.1*
|
§Each score represents the results of 6 slides per rat and 6 rats per group, mean ± S.E. (n=6). Each field were selected randomly for evaluation of percentage of immune-positive cells.
* Significant difference between treated and carcinogen control (p<0.01).
** Significance difference between treated and carcinogen control (p<0.05).
Suppression of Ki-67 by Ruthenium-phloretin complex
The efficacy of the ruthenium-phloretin compound in the proliferation of mammary tissues is designate in Figure 6 (i) (Table 3). A significant rise in the Ki-67-LI values was observed in carcinogen control animals (Figure 6 (i) B) in comparison to the normal control group (Figure 6 (i) A), however a considerable reduction in the Ki-67-LI index could be found in the maximum dose of ruthenium-phloretin complex treated animals (p<0.01) (Figure 6 (i) C, D & E) in comparison to the carcinogen treated animals.
Table 3: Cell proliferation and apoptosis in breast
|
Groups
|
Ki-67-LI§
|
AI (%)§
|
R= Ki-67-LI /AI
|
|
Normal control
|
22.08 ± 0.4
|
0.17 ± 0.02
|
134.12 ± 0.2
|
|
DMBA
|
36.2 ± 1.3
|
0.08 ± 0.02
|
452.05 ± 0.5
|
|
Ru- phl 50 mg/kg
|
27.8 ± 0.2
|
0.07 ± 0.05
|
397.14± 0.1
|
|
Ru- phl 100 mg/kg
|
21.8 ±0.1**
|
0.11 ±0.02##
|
198.18 ± 0.2$$
|
|
Ru- phl 200 mg/kg
|
17.9± 0.6*
|
0.12 ± 0.03#
|
149.16± 0.9$
|
LI= Labelling index, Ki-67-LI = percentage of PCNA labelled cells/total number of cells counted, AI= Apoptotic index. R = PCNA-LI/AI. AI was calculated as the percentage of TUNEL positive cells/total number of cells counted. Values represents mean ± S.E.
§ Total number of six slides were evaluated per rat. Each field consisted of approximately 500 cells.
* Significant difference between Ki-67-LI of Ru- phl 200 mg/kg vs carcinogen control animals (p<0.01).
** Significant difference between Ki-67-LI of Ru 100 mg/kg, Ru- phl 100 mg/kg vs carcinogen control animals (p<0.05).
# Significant difference between AI of Ru- phl 200 mg/kg vs carcinogen control (p<0.01).
## Significant difference between AI of Ru 100 mg/kg, Ru- phl 100 mg/kg vs carcinogen control animals (p<0.05).
$ Significant difference between R of Ru- phl 200 mg/kg vs carcinogen control animals (p<0.01).
$$ Significant difference between R of Ru 100 mg/kg, Ru- phl 100 mg/kg vs carcinogen control animals (p<0.05).
Ruthenium-phloretin complex promotes apoptosis
TUNNEL activity was assayed to find out the efficacy of ruthenium-phloretin therapy on cellular death in breast cancer [Figure 6 (ii)]. In the case of the carcinogen control group [Figure 6 (ii) B] the TUNEL positive cells experiencing apoptosis were very few compared to the normal control group[Figure 6 (ii) A]. Compared with carcinogen control, the TUNEL positive cells of complex treated animals increased significantly [Figure 6 (ii) C, D & E]. AI describes the apoptotic index and is recorded in Table 3. Animals taking 200 mg / kg of the complex, represented a considerable rise in cell death, as compared against the carcinogen control group. The interpretation R is that it shows the proportion of cell death to tumor growth.