3.1. Studied waters exhibit low microbial activity
A summary of parameters in samples collected in the Metro Vancouver and Halifax Water systems is presented in Table 2:
Table 2
Characteristics of water samples collected from Metro Vancouver and Halifax Water transmission/distribution systems. Median results are shown, and the interquartile range (IQR) is represented in parenthesis. Turbidity results from Halifax Water are not available.
| | Halifax Water n = 283 | Metro Vancouver n = 40 |
| HPC | < 1 (< 1–1) | < 2 (< 2–4.5) |
| cATP | 0.20 (0.07–0.49) | 0.29 (0.12–1.23) |
| Free chlorine | 0.57 (0.45–0.77) | 0.76 (0.62–0.89) |
| Turbidity | N/A | 0.24 (0.19–0.29) |
Metro Vancouver and Halifax Water sample characteristics are largely comparable, with a slightly higher range of HPC and cATP values represented in Metro Vancouver samples due to the inclusion of raw inlet water in the sample set. Excluding raw inlet water samples (n = 8) from the Metro Vancouver dataset results in a median HPC of < 1 CFU/mL with zero IQR, i.e., the middle 50% of samples are all non-detectable for HPC. Water samples collected by Halifax Water are low in microbial activity: 67% (n = 190) are non-detectable for HPC (< 1 CFU/mL), and only 2% (n = 7) exceed the relatively low upper limit of 250 CFU/mL. Similarly, Metro Vancouver samples were 63% (n = 25) non-detectable for HPC (< 2 CFU/mL) with a maximum of 400 CFU/mL. In comparison, studies showing high HPC-ATP correlation, such as Duda et al. (2015) reported HPC up to 105 CFU/mL.
The median cATP in Halifax Water is 0.20 ug/mL and ranges from 0 to a maximum of 7.9 pg/mL, all of which are below the recommended limit of 10 pg/mL for corrective action (McIlwain, 2020). ATP demonstrates a higher sensitivity than HPC, as expected, with only 12% of samples (n = 34) non-detectable for ATP. Metro Vancouver samples shows a median cATP of 0.29 pg/mL and ranged from 0.01 pg/mL to 50.3 pg/mL (untreated source water). Similar to what is observed for HPC, excluding raw water samples (n = 8) reduces median cATP to 0.20 pg/mL (IQR 0.11–0.33 CFU/mL). As expected, ATP is a more sensitive test than HPC, with none of the samples being non-detectable for ATP.
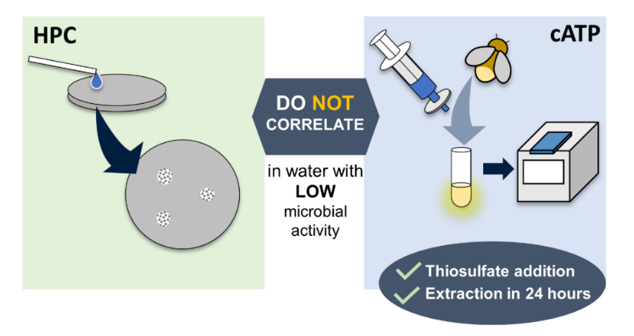
3.2. Poor correlation of ATP and HPC in waters with low microbial activity
HPC and cATP results for the Halifax Water and Metro Vancouver studies are presented in Fig. 1 and Fig. 2, respectively.
While Pearson R coefficients are shown to facilitate comparison with other studies, the data do not, in fact, satisfy the assumptions for simple linear regression. Namely, both Halifax Water and Metro Vancouver datasets yielded significant non-normal distributions of residuals, skewed left (p < < 0.001; residual plots, histograms, and Q-Q plots are shown in Figure S1 and Figure S2). One main contributor to the asymmetrical distribution appears to be the disproportionate number of low HPC samples (< 2 CFU/mL), combined with the fact that these low-range HPC samples correspond to a wide range of ATP results (0 to 3 pg/mL). This results in a significant number of negative residuals in the low HPC/ATP range (i.e., left-skewed), which is not improved even after excluding samples below and above the HPC detection (p < < 0.001).
Spearman Rs coefficient is therefore considered a more appropriate descriptor for these datasets, summarized in Table 3 for all studied parameters (equivalent correlation matrix for Pearson R coefficients provided in Table S2, for reference):
Table 3: Spearman Rs calculated for Halifax Water (A) and Metro Vancouver (B) samples. Insignificant correlations (p > 0.05) are shown in grey.

No significant relationship between HPC and cATP is observed for Halifax Water (p > 0.05). In contrast, a significant relationship of moderate strength is observed for Metro Vancouver (Rs = 0.55, p < 0.001). This aligns with studies testing HPC waters of a similar range: Nescerecka et al (2014) found Rs=0.33 when testing chlorinated water distribution samples with HPC up to 220 CFU/mL. The likely reason for the discrepancy between Halifax Water and Metro Vancouver is the inclusion of raw source water in the Metro Vancouver dataset: the relatively higher HPC and ATP values of the source water samples allow for a relationship to be determined between these two parameters. Excluding these raw water samples (n=8) eliminates any significant relationship between HPC and cATP (p=0.9, n=32; detailed results provided in Table S3)
Therefore, the present study supports the observation that low HPC waters, in the ranges typically found in chlorinated potable distribution systems, are unlikely to produce strong correlations between HPC and ATP. This also can be due to the fact that ATP is not sufficiently accurate in aquatic environments with low microbial concentrations (Hammes et al., 2010). In comparison, studies finding a high correlation, such as R = 0.90 by Duda et al. (2015) involved chlorinated waters collected at point-of-use with a mean HPC of 537 CFU/mL (reported as log10), which are orders of magnitude higher than the present study median HPC that is below detection limits (< 1–2 CFU/mL).
Further, in a study by Turner et al. (2010), a limitation of ATP testing was reported to be its inability to accurately measure Gram-negative bacteria due to incomplete cell lysis. Gram-negative bacteria can comprise a significant portion of the microbial population in surface waters, making up as much as 90% of isolates studied in Lake Ontario and Lake Superior (Bennett, 1969). Moreover, the percentage of Gram-negative bacteria can also shift significantly from source to point-of-use: Pepper et al. (2004) found Gram-negative bacteria comprised 76% of the studied source river water but only 12% in the chlorinated distribution system and 0.2% at the tap. This may explain the poor correlation between HPC and ATP in water samples, even in waters with higher biological activity.
Additionally, some of the concerning pathogenic heterotrophic bacteria that are Gram-negative are total coliforms, E. coli, Shigella, Pseudomonas aeruginosa, Legionella pneumophila, Aeromonas hydrophila, Klebsiella pneumoniae, Salmonella enterica (Cabral, 2010). Therefore, considering the prevalence, variability, and pathogenic concern of Gram-negative bacteria, it is advisable to complement ATP testing with species-specific tests, particularly for systems that utilize source waters of pathogenic concern. Alternatively, ATP detection limits for the mentioned pathogenic species can also be established in pure culture form. For instance, Turner et al. (2010) reported that the detection limit of E. coli and Staphylococcus aureus was 104 and 102 organisms, respectively.
3.3. Interpretation of HPC and ATP results can yield consistent conclusions
Despite weak correlation between ATP and HPC, it is worth noting that using guideline ranges to interpret ATP versus HPC data can lead to highly consistent conclusions. To illustrate, HPC results > 100 CFU/mL can be considered indicative of a need for investigation, based on the drinking water standard limit of 100 CFU/mL employed in jurisdictions like Germany, The Netherlands, and Japan (Robertson and Brooks, 2003) (in comparison, the US EPA guideline for HPC of 500 CFU/mL (Health Canada, 2012) is too high to be relevant for the studied waters, none of which exceeded this value). Similarly, cATP results > 10 pg/mL has been suggested by the test kit manufacturer as being indicative of a need for corrective action (McIlwain, 2020).
If these guidelines (HPC: 100 CFU/mL and cATP: 10 pg/mL) are used to interpret HPC and cATP results obtained from the Metro Vancouver study, then consistent conclusions would be reached for 39 out of the 40 samples or 98% of the sample set. That is, both HPC and cATP exceed 100 CFU/mL and 10 pg/mL for 39 out of 40 samples (98%), respectively. The one discrepancy is a sample with high ATP (40 pg/mL) but low HPC (54 CFU/mL), which can be described as a false positive if cATP is treated as the predicting parameter (i.e., cATP “wrongly” identified a need for corrective action when HPC was actually low).
When applied to Halifax Water, all but 10 of the samples agree (96%), with the 10 samples being low ATP samples (< 10 pg/mL) with high HPC (> 100 CFU/mL). This can be described as a false negative, i.e., cATP “wrongly” identifies there is no need for corrective action when HPC is, in fact, high. These results are summarized in Table 4:
Table 4
Analysis of error probability, based on cATP ≥ 10 pg/mL and HPC ≥ 100 CFU/mL as indicative of the need for corrective action. False positive: cATP indicates corrective action (≥ 10 pg/mL), but HPC does not (< 100 CFU/mL). False negative: cATP does not indicate corrective action (< 10 pg/mL) but HPC does (≥ 100 CFU/mL). Correct: cATP and HPC results are consistent (both above or both below 10 pg/mL and 100 CFU/mL, respectively)
| cATP Interpretation Compared to HPC | Halifax Water n = 283 | Metro Vancouver n = 40 |
| Correct | 96% (n = 273) | 98% (n = 39) |
| False-positive High cATP, low HPC | 0% | 2% (n = 1) |
| False-negative Low cATP, high HPC | 4% (n = 10) | 0% |
To be clear, this error analysis is only provided for illustrative purposes to demonstrate how cATP data may be used by utility managers to replace HPC. In practice, system-specific baselines and trends should be established for cATP, HPC and any other bacteriological monitoring technique (e.g., cell count using flowcytometry, gene copies count using q-PCR, bacterial relative and absolute abundance using microbiome analysis, etc.) over a sufficient test period, which is consistent with the recommended practice for how these bacteriological indicators are best used for utility monitoring (Abkar et al., 2023; Health Canada, 2022; Kirisits et al., 2019).
3.4. Correlating free chlorine and turbidity to HPC and cATP
Correlations between free chlorine, turbidity, HPC, and cATP for Metro Vancouver are summarized in Table 3. The Pearson coefficients for the same data are provided in Table S2. A weak but statistically significant negative correlation between free chlorine and cATP is observed in both data sets, ranging from Rs = -0.13 (p = 0.04) for Halifax Water to Rs = -0.39 (p = 0.01) for Metro Vancouver. The negative relationship is consistent with the disinfecting action of free chlorine. On the other hand, no significant relationship is observed between free chlorine and HPC for Halifax Water (p > 0.05). While a correlation is observed for Metro Vancouver (Rs = -0.44, p = 0.005), the results are again attributable to the raw source water samples included in the study. Overall, it is observed that free chlorine correlates more consistently with cATP than HPC, which is in agreement with Kennedy et al. (2021) who reported a better correlation of cATP with free chlorine than HPC.
Turbidity data is only available from Metro Vancouver, for which similar correlations are observed with both HPC and cATP (Rs = 0.46 and 0.33, respectively). These correlations are again due to the raw source water samples, which, when excluded, result in non-significant relationships (p > 0.05) between turbidity and both HPC and cATP (Table S3). Therefore, the study results do not necessarily indicate that turbidity can be practically correlated to either parameter when sampling from chlorinated transmission/distribution systems.
3.5. Sodium thiosulfate does not significantly affect cATP
As regulated microbial tests like for E. coli require samples to be chlorine-quenched, the impact of chlorine quenching on ATP assay was studied to assess whether thiosulfate-pre-charged sampling bottles can be used (i.e., to unify sample handling). As discussed in Methods section 2.1, n = 7 pairs of samples with and without thiosulfate addition were collected and extracted at three-time points, resulting in up to n = 6 pairs of comparative cATP results at each time point (not all samples could be extracted at all three-time points) for a total of n = 15 data pairs (Table 5).
Table 5
cATP results for samples with and without thiosulfate addition, reported as median with interquartile range represented in parentheses. Percent difference (calculated as “no thiosulfate” minus “with thiosulfate”) reported as mean ± one standard deviation.
| Time of Extraction | cATP (pg/mL) | Percent difference | |
| With Thiosulfate | No Thiosulfate |
| 4hr | 0.13 (0.13–39.98) | 0.32 (0.29–23.70) | 36 ± 77% | n = 3 |
| 6hr | 0.65 (0.17–29.95) | 0.43 (0.23–17.13) | 18 ± 123% | n = 6 |
| 24hr | 0.23 (0.12–7.12) | 0.28 (0.19–12.08) | 23 ± 89% | n = 6 |
Median cATP results for samples with and without thiosulfate are comparable across the extraction times, with a mean percent difference of up to 36% (non-thiosulfate cATP higher than thiosulfate). Paired t-test and Wilcoxon signed rank test (the latter for non-normally distributed sample sets) conducted for thiosulfate versus non-thiosulfate results, at each extraction time all indicate a lack of significant difference (p > 0.4, detailed results in Table S4), suggesting that thiosulfate addition does not significantly impact cATP results at the conditions tested.
To further support the analysis of these results, the baseline variance of ATP is determined from the mean coefficient of variance for n = 26 sets of triplicates (detailed results provided in Table S5). The one-way ANOVA test confirms that the coefficients of variance evaluated under the various sampling conditions (Methods section 2.1) are not significantly different (p = 0.4). As such, all n = 26 triplicates are used to calculate a mean coefficient of variance of 35 ± 17%, which is consistent with literature values of 32 ± 16% (Paul and Wootton, 2014). Percent differences evaluated between thiosulfate versus non-thiosulfate (Table 5) are not significantly different from baseline variance (p > 0.7, Welch’s t-test; detailed results in Table S6), further supporting the conclusion that thiosulfate addition does not significantly impact cATP results.
3.6. Extraction within 24 hours achieves consistent ATP results
To assess the impact of sample extraction time on cATP results, samples were extracted at 4, 6 and 24 hours after collection. Percent changes in cATP between different extraction times are presented in Fig. 3 (values reported in Table S7):
Results may suggest a greater decrease in cATP values in samples without sodium thiosulfate, based on larger decreases observed in comparing extractions at 24 versus 6 hours and 24 versus 4 hours: samples without thiosulfate consistently decreased by 30 to 33%, whereas samples with added thiosulfate displayed an inconsistent trend and even increased by 11% (in comparing 6 versus 24 hours). These results would be consistent with the chlorine quenching action of thiosulfate, which should reduce the rate of cell death in the sample bottle and therefore slow the reduction of cATP over time. However, the percent changes observed are comparable with the baseline variance (35 ± 17%), which is confirmed by Welch’s t-test yielding p > 0.06 at all conditions (statistical test conducted using absolute value of percent changes; detailed results in Table S8 and Table S9). Therefore, the study supports the manufacturer's recommendation that sample extraction within 24 hours should yield consistent results.
3.7. Cost and other considerations
While a full cost analysis is beyond the scope of the study, the authors believe that some general remarks on cost comparison between cATP and HPC testing can be valuable to utility managers. As of the date of this writing, the cost of consumables for cATP testing is approximately $20 CAD per sample (LuminUltra® QGA-25), while the cost of a luminometer is approximately $8,000–9,000 CAD (LuminUltra® PhotonMaster). In comparison, HPC costs for utility managers can vary widely depending on the scope of their operations. For utility managers operating certified laboratories for in-house HPC testing (e.g., Metro Vancouver), one of the main consumables is agar growth media. Cost of R2A agar can range from $0.35 CAD per test if prepared from dehydrated powder, up to $17 CAD per test if using prepared plates (Thermo Scientific R2A Agar). This excludes cost of equipment such as incubators, and additional equipment required for media preparation (e.g., drying oven). For utility managers that contract third-party laboratories for HPC testing (e.g., Halifax Water), the cost will naturally vary based on external laboratory pricing. That said, ATP testing is likely to be a cost-effective alternative especially considering its simplicity of operation, with the only equipment required being the aforementioned portable luminometer.
Finally, it is worth noting that a sizeable amount of plastic waste is produced for ATP testing, including the one-time use filters, syringes, and cuvettes. Plastic waste produced in HPC testing varies based on laboratory-specific procedures, with zero waste possible through the use of autoclavable glass plates and pipettes (as is the case for Metro Vancouver). For utility managers using prepared, disposable plates, however, the amount of waste generated becomes comparable with ATP testing.