The Water Quality Index (WQI) gathers information on physical-chemical and bacteriological parameters. This article analyzed, monthly for one year, water samples collected at the source and downstream of the São Gonçalo River in the municipality of São Domingos do Norte, at Espírito Santo. The average accumulated precipitation of the month that preceded the collection was grouped into dry and rainy periods. Precipitation data allowed classification into dry and rainy periods (p-value 0.0084). The WQI values were calculated and statistically evaluated regarding the collection point and precipitation (p-value 0.0125). In dry periods, the WQI presented lower values than in rainy periods. It was observed that at the source of the river, the WQI value was higher than downstream from the urban center due to anthropological action. Finally, the research allowed the identification of the temporal and spatial variation of the water body resulting from contamination by sewage contribution.
Research Article
Assessment of Water Quality of The São Gonçalo River in The Urban Section of São Domingos do Norte-ES
https://doi.org/10.21203/rs.3.rs-4277986/v1
This work is licensed under a CC BY 4.0 License
Version 1
posted
You are reading this latest preprint version
Environmental
Water Quality Index
River Water
Sewage system
Water is a vital resource for the survival of many species, including humans (Mo et al., 2019). It plays a crucial role in recreational and navigation activities and forms the foundation of urban, industrial, and agricultural development (Noori et al., 2019). However, untreated domestic sewage discharge into water bodies can contaminate rivers in urban areas, harming the aquatic ecosystem and facilitating the spread of waterborne diseases (Aissa-Grouz et al., 2018).
Water quality monitoring is a crucial tool for managing and controlling pollution. It helps to evaluate the variations in water quality over time and space. Doing so makes it easier to identify areas where contaminated water is being dumped and take corrective measures. However, some monitoring criteria generate a large amount of data, making it difficult to assess the water body effectively (Costa et al., 2020; Manna & Biswas, 2023).
Water quality indicators are a simple yet effective tool for evaluating the condition of water bodies. They enable accessible communication with the general public by presenting various data in a single value, as noted by Noori et al. (2019) and Pessoa, Souza, Domingos, and Azevedo (2020). The Water Quality Index (WQI) is the primary indicator for this purpose and includes both bacteriological and physicochemical data. It comprises nine parameters: thermotolerant coliforms, pH, turbidity, phosphate, nitrate, temperature, dissolved oxygen, BOD5.20, and total solids. Oliveira, Rezende, Fonseca, and Libânio (2019) have also highlighted the importance of these parameters in assessing water quality.
In Brazil, the National Water Quality Monitoring Network (RNQA) manages the assessment of Water Quality Indexes through the HidroWeb portal. This portal allows access to a database with information from the National Hydrometeorological Network (Vespucci et al., 2016). Despite ongoing efforts, numerous water bodies remain unsupervised, particularly those in smaller regions and inland municipalities (Brasil, 2022). The study area analyzed in this work also lacks river water quality monitoring records for the section under consideration (PMSDN, 2016).
The municipality of São Domingos does Norte is situated in the northwestern region of Espírito Santo state (IBGE, 2022). The São Gonçalo stream is the primary water source that receives the municipality's sewage discharge. Unfortunately, the absence of a Sewage Treatment Station leads to fresh releases from almost the entire urban area (PMSDN, 2016).
The monitoring results can be interpreted using statistical models that simplify complex data and variables into easily understandable groupings and results (Pinto et al., 2019).
When analyzing data, some statistical comparison tests are used to determine whether there is a significant difference between the medians of the analyzed parameters. Non-parametric tests are used when a Normal distribution cannot be identified in a set of values. The Mann-Whitney test is a non-parametric method used to evaluate the combination of two sample populations. The Kruskal-Wallis test, on the other hand, is used to compare three or more sample populations. Both tests are designed to test the null hypothesis that all populations have the same distribution functions while considering the alternative hypothesis that the populations have different distribution functions. Suppose the p-value is less than or equal to the significance level of 0.05. In that case, the null hypothesis is rejected, and it is concluded that the difference between the population medians is statistically significant (Almeida et al., 2022).
The research aimed to diagnose possible changes in the river's water quality that flows through the municipality.
Study Area
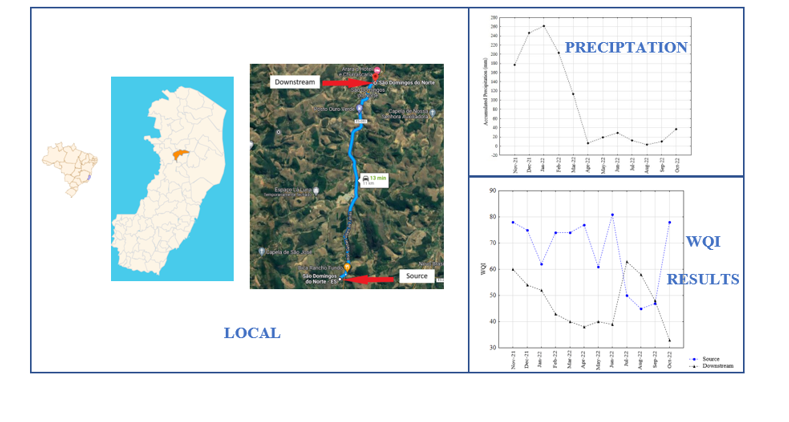
São Domingos do Norte's municipality is in Espírito Santo State (Fig. 1). The municipality has a population of over 8,700 inhabitants (IBGE, 2022).
The city is in the Rio Doce Basin, specifically in the São José Analysis Unit. Some of the main issues identified in the São José Analysis Unit include the use of pesticides, decreased natural vegetation cover, the lack of proper sanitation systems, and frequent floods during the rainy season (PARH São José, 2010).
The main rivers and streams in the municipality in question are the São José River, which borders the northeast portion of the city; the Córrego do Café, which is the source of drinking water supply for the local urban population; the São Gonçalo stream; the Divisa stream; the São Benedito stream; the Santo stream; the Dumer stream, and the Bom Destino stream. The main watercourse that crosses the urban area of the Municipal Headquarters is the Córrego São Gonçalo, which has its source in the community of the same name and flows into the Córrego Sabiá, which in turn has its mouth in the São José River. São Gonçalo stream, before reaching the main urban area, are the Oco do Pau, Sossego, Barbado and Damásio streams (Fig. 2).
The water supply system serves the municipality's local population. This system is operated by the Autonomous Water and Sewage Service (SAAE) (PMSDN, 2016). Sometimes, the water body under study is also called Rio São Domingos. However, for this work, the term "Rio São Gonçalo" refers to the water body that runs through the urban center.
Espírito Santo is among the states that most use surface water for public supply. Of the 78 urban centers, 71 are served exclusively by surface water sources (ANA, 2021).
Study Area
Two locations were selected for sampling surface water from water bodies. They are possible access points closest to the spring (-19.140464 S and -40.619645 W) and access points downstream of the urban center (-19.140744 S and -40.619642 W) with greater population density and before possible interference from crops or livestock activities or the self-purification of the water body, as illustrated in Figure 3.
Sampling and Preservation
The sampling process followed the guidelines stated in the National Guide for Sample Collection and Preservation (CETESB, 2011). The samples were collected and placed into polyethylene bottles, which were then refrigerated at approximately 4°C for subsequent physicochemical and microbiological analyses.
The temperature and dissolved oxygen data were collected on-site using an AZ model 8403 oximeter from Korea. The pH values were measured using a Kasvi model K39-0014PA instrument. Turbidity analysis was conducted using a turbidimeter from Hanna Instruments, model HI98703-02.
The analytical determinations of the other parameters were carried out following the methodology of the Standard Methods (SM) for the Examination of Water and Wastewater of the American Public Health Association (APHA) and the Brazilian Standards (NBR) of the Brazilian Association of Technical Standards (ABNT), each which is indicated for the parameter in Table 1.
Table 1 Methodology and analytical quantification.
|
Parameter |
Methodology |
|
Thermotolerant coliforms |
SM 9222 D |
|
Nitrate |
ABNT NBR 12.620/92 |
|
Total Phosphate |
SM 4500 PC |
|
BOD5,20 |
ABNT NBR 12.614/92 |
|
Total solids |
NBR 10.664/89 |
Physicochemical and Biological Parameters
The meteorological data used were obtained through the National Center for Monitoring and Alerting of Natural Disasters (CEMADEN) from the automatic rainfall station D1507, located under the coordinates of -19.148 S and -40.622 W (CEMADEN, 2022). The justification for choosing this station is due to its proximity to the study site. The water quality index was calculated using the same methodology the National Sanitation Foundation (NSF) adopted.
Analysis and Statistics
The parameter data were individually compared by CONAMA Resolution No. 357 of 2005 to classify the water body with the standard limit for each Class. The WQI values were also compared with the NSF classification, according to Table 2.
Table 2 Classification according to WQINSF.

The data was analyzed using Statistica software version 10. The k-means Clusters method divided the meteorological data into two periods. The Mann-Whitney test was applied to statistically evaluate the groups with a significance level of 5% (p < 0.05). Figure 4 shows that the WQI value and its parameters were grouped based on the location of the collection point, upstream or downstream, and the period, rainy or dry. The Kruskal-Wallis test assessed the statistical difference between the groups at a significance level of 5% (p < 0.05).
The physical-chemical and biological analyses of the collected samples, which are considered in the WQI calculation, are represented in Figure 5. Comparing the data with the Maximum Values Allowed by CONAMA nº 357 (2005), it was possible to observe that for the phosphate, total solids, temperature and pH parameters, the data are by the values established by CONAMA.
The Nitrate concentration values indicate that the water body is classified as Class 1. However, the data for Thermotolerant Coliforms showed a wide range of values, with some samples exceeding the maximum limit for Class 3, which is 2500 UFC.100mL-1. On the other hand, some samples showed no detectable presence of bacteria.
The Biochemical Oxygen Demand (BOD) showed varying ranges of values, placing the river's source in Class 2. However, downstream, the BOD value exceeded the Class 3 threshold. The Turbidity values obtained were classified as Class 1, with only one sample having a turbidity level classified as Class 2.
With the data and parameters selected, the diagnosis of the water body would be incomplete, only suggesting that the minimum Class that the river would be classified as Class 4 due to the variation in some data related to Thermotolerant Coliforms. This diagnosis would be considered in Effluent Discharge Licenses, allowing for a more significant load of pollutants. For this reason, using WQI makes it possible to represent the water body's quality better.
The results for each parameter were used to calculate the WQI and were organized according to sampling points and collection date (Figure 6). In some cases, the measured value was below the detection limit of the methodology used. In these cases, the minimum detection values were defined as the parameter's value in that sample to enable the calculation of the quality index. For the variable BOD5.20, the minimum detection limit was 2.0 mg.L-1. In some samples, the concentration was undetectable, as it was below the cited value, and the minimum value of 2.0 mg.L-1 was considered. as sample data.
The results of the physicochemical and biological analyses were statistically evaluated. They did not present a Gaussian distribution, as expected, as they are accurate environmental data influenced by climate, rainfall, temperature, consumption, and disposal of domestic sewage.
When classifying the WQI, according to the ranges used by the NSF, it was possible to observe that most of the samples from the source of the river have good quality, while downstream, the quality is poor (Table 3).
Based on the average of the samples collected from that year, the water body can be classified as having average quality in the East and poor in the Downstream. Additionally, it was obtained that the WQI (Water Quality Index) values at the Source were approximately 42.5% higher than the values obtained at the Downstream. This numerical difference reveals the impact of human activity on reducing water quality.
Figure 7 illustrates a noticeable variation between the effluent and influent collected. It shows that the samples collected from the months had the lowest WQI downstream and the highest WQI upstream. In Figure 7(a) from October 2022 and Figure 7(b) from June 2022, a marked difference in color can be observed in the sample from the East and Downstream. This visible variation indicates contamination of the water body.
Table 3 WQI values and averages classified according to NSF.

In Figure 8, we can see the amount of rainfall accumulated in the month before collection. The K-means Clustering method was used to group the months based on the amount of rainfall during dry and rainy periods, which relied on the Euclidean distance between them. November and December 2021 and January and February 2022 were identified as the rainy period, while the months between March and October 2022 were classified as the dry period. Statistical analysis using the Mann-Whitney test showed that the p-value between the two groups was 0.0084, indicating statistical significance.
The WQI value and the parameters that compose it were divided into rainy and dry groups in the months previously grouped and organized according to the upstream and downstream collection points.
Analyzing all associated variables in four groups: dry-upstream, dry-downstream, rain-upstream and rain-downstream, Kruskal-Wallis tests were recorded, and the p-values between the four groups are presented in Table 4.
After evaluating the results statistically, it was found that there is a significant difference between the WQI groups and some parameters like BOD, Dissolved Oxygen, and Turbidity. This difference can be attributed to the impact of rainfall on physical-chemical and biological parameters. As the number of rainy periods increases, the river's water volume also increases, which leads to the dilution of compounds and changes in their flow (Silva et al., 2008). The collection point also seems significant, indicating that human activities have caused a deterioration in water quality and reduced the support capacity of aquatic life. This justifies the values of Dissolved Oxygen concentration and Biological Demand for Oxygen consumption (Costa et al., 2020). Turbidity is also significant, which can be attributed to the discharge of domestic wastewater, leading to an increase in suspended solids and color content in the water body.
Table 4 Result of the p-value between the dry-upstream, dry-downstream, rain-upstream and rain-downstream groups of the Parameters and WQI of the Kruskal-Wallis test.
|
|
WQI |
BOD5,20 |
DO |
Nitrate |
Total Phosphate |
|
p-valor |
0.0125 |
0.0432 |
0.0006 |
0.3507* |
1.0000* |
|
|
Temperature |
Turbidity |
pH |
Total solids |
Thermotolerant Coliforms |
|
p-valor |
0.1405* |
0.0032 |
0.2119* |
0.4714* |
0.0881* |
* p-value greater than 0.05, indicating statistical insignificance between the groups.
The parameters that did not reach statistical significance between the WQI groups were Nitrate, Total Phosphate, Temperature, pH, Total Solids and Thermotolerant Coliforms. Total Nitrate and Phosphate were statistically insignificant as the measured values were below the detection limit of the methodology used. Water temperature is related to natural phenomena, such as climate and local humidity, so it did not present statistical significance. The probable statistical insignificance of pH may be associated with temperature, influencing water autoprotolysis. Thermotolerant Coliforms were higher than downstream in most of the months evaluated, except in July, August and September 2022, indicating contamination of the source caused by the dry period. This dry period caused a loss of riparian vegetation, favoring the proximity of animals to the collection point where they carried out their physiological needs.
Throughout the sampling period, the water quality index (WQI) values ranged from a low of 33, recorded during a dry period at the downstream location, to a high of 81, recorded at the source in June. The month with the highest accumulated precipitation was January 2022, and during this period, a WQI value of 62 was recorded at the source. These details are further illustrated in Figure 7.
During the dry season, the water quality index (WQI) was generally higher in most of the samples taken upstream compared to downstream, except for the months of July, August, and September 2022, when there was low rainfall. This dry period caused an increase in contaminants in the water source. Additionally, animals were more likely to gather near the collection point to drink water during this period, further contributing to the contamination. Moreover, the water evaporation rate from the water body increased during this time, leading to a decrease in the water volume in the river. As a result, the concentration of pollutants in the remaining water increased.
During the studied period, it was observed that the region experienced uneven rainfall, with periods of both rain and drought. The water quality at the source of the São Gonçalo River was significantly better than downstream, highlighting the negative impact of effluent release from various sources along the river's course.
The parameters analyzed individually show us that using indicators helps to understand an extensive data set better when compared with the diagnosis provided by the Maximum Values Allowed in CONAMA Resolution No. 357 of 2005. The average WQI values between the collection points showed that the water has an average quality at the river's source, while downstream, it is classified as poor. The average WQI value of the Source was approximately 42.5% higher than the average WQI of the downstream during the studied period.
The months were divided into two meteorological periods by grouping Clusters. A significant difference was observed between the rainy and dry periods in the region (p-value 0.0084) when the Mann-Whitney test was applied, justifying the need to evaluate them in two distinct groups. Thus, the location of the collection point played a crucial role, as analyzing the four organized groups revealed statistical significance using the Kruskal-Wallis test for the WQI (p-value 0.0125). Therefore, the period and collection point are essential factors in determining the Water Quality Index of the studied water body.
The results suggest that regardless of the meteorological condition recorded, the São Gonçalo River is significantly affected by the different pollution source contributions from the urban center. The analysis of the two monitoring points, upstream and downstream, of the water body allowed the identification of human action, thus justifying the need to promote the sustainable use of water and reduce pollution of the water body over time.
Acknowledgments
Thanks to CNPq and CAPES for the financial support.
Conflict of interest declaration
The authors declare no conflict of interest that might constitute an embarrassment to the publication of this article.
Funding
This study was financed in part by the Coordenação de Aperfeiçoamento de Pessoal de Nível Superior – Brasil (CAPES) – Finance Code 001 and National Council for Scientific and Technological Development – CNPq
- Aissa-Grouz, N., Garnier, J., & Billen, G. (2018). Long trend reduction of phosphorus wastewater loading in the Seine: determination of phosphorus speciation and sorption for modeling algal growth. Environmental Science and Pollution Research, 25(24), 23515–23528. https://doi.org/10.1007/s11356-016-7555-7
- Almeida, D. C., Pitanga, H. N., Silva, T. O. D., Silva, N. A. B., & Avelar, M. G. D. (2022). Utilização dos testes estatísticos Kruskal-Wallis e Mann-Whitney para avaliação de sistemas de solos reforçados com geotêxteis. Matéria (Rio de Janeiro), 27. https://doi.org/10.1590/1517-7076-RMAT-2021-45351
- ANA, Agência Nacional de Águas e Saneamento Básico. (2021). Atlas águas: segurança hídrica do abastecimento urbano. Retrieved from https://portal1.snirh.gov.br/ana/apps/storymaps/stories/1d27ae7adb7f4baeb224d5893cc21730
- Brasil, Agência Nacional de Águas e Saneamento Básico (2022). Conjuntura dos Recursos Hídricos no Brasil 2021:Relatório Pleno (ANA).
- CEMADEN. Mapa Interativo. Retrieved November 2, 2022, from http://www2.cemaden.gov.br/mapainterativo/#
- CETESB - Companhia Ambiental do Estado de São Paulo (2011). Guia nacional de coleta e preservação de amostras: água, sedimento, comunidades aquáticas e efluentes líquidos, 325.
- CIDADE-BRASIL. (2023). Cidades e municípios do Estado do Espírito Santo. Retrieved from https://www.cidade-brasil.com.br/estado-espirito-santo.html
- Costa, D. A., Azevedo, J. P. S., Santos, M. A., & Santos, R. F. V. A. (2020). Water quality assessment based on multivariate statistics and water quality index of a strategic river in the Brazilian Atlantic Forest. Scientific Reports, 10(1), 1–13. https://doi.org/10.1038/s41598-020-78563-0
- Google Maps. Pontos de Coleta. Retrieved January 23, 2023, from https://www.google.com.br/maps/dir/’-19.228079,-40.637136’/’-19.140744,-40.619642’/
@-19.181201,-40.659037,13016m/data=!3m1!1e3!4m14!4m13!1m5!1m1!1s0x0:0x6f581 19.2281941!1m5!1m1!1s0x0:0x959daea477565f2a05befaf28cd!2m2!1d-40.6364341!2d-!2m2!1d-40.619642!2d-19.140744!3e0 - IBGE. (2022). São Domingos do Norte (ES) | Cidades e Estados | IBGE. Retrieved from https://www.ibge.gov.br/cidades-e-estados/es/sao-domingos-do-norte.html
- Manna, A., Biswas, D. (2023). Assessment of drinking water quality using water quality index: a review. Water Conservation Science and Engineering, 8(1), 6. https://doi.org/10.1007/s41101-023-00185-0
- Mo, K., Chen, Q., Chen, C., Zhang, J., Wang, L., & Bao, Z. (2019). Spatiotemporal variation of correlation between vegetation cover and precipitation in an arid mountain-oasis river basin in northwest China. Journal of Hydrology, 574, 138–147. https://doi.org/10.1016/J.JHYDROL.2019.04.044
- Noori, R. B., Berndtsson, R., Hosseinzadeh, M., Adamowski, J. F., & Abyaneh, M. R. (2019). A critical review on the application of the National Sanitation Foundation Water Quality Index. Environmental Pollution, 244, 575–587. https://doi.org/10.1016/J.ENVPOL.2018.10.076
- Oliveira, M. D. de, Rezende, O. L. T. de, Fonseca, J. F. R. de, & Libânio, M. (2019). Evaluating the surface Water quality index fuzzy and its influence on water treatment. Journal of Water Process Engineering, 32, 100890. https://doi.org/10.1016/J.JWPE.2019.100890
- PARH SÃO JOSÉ. (2010). Plano de Ação de Recursos Hídricos da Unidade de Análise São José. Retrieved from https://www.cbhdoce.org.br/wp-content/uploads/2014/10/PARH_Sao_Jose.pdf
- Pessoa, M. A. R., de Souza, F. J., Domingos, P., & de Azevedo, J. P. S. (2020). Índice fuzzy de qualidade de água para ambiente lótico - IQAFAL. Engenharia Sanitaria e Ambiental, 25(1), 21–30. https://doi.org/10.1590/S1413-41522020147587
- Pinto, C. C., Calazans, G. M., & Oliveira, S. C. (2019). Assessment of spatial variations in the surface water quality of the Velhas River Basin, Brazil, using multivariate statistical analysis and nonparametric statistics. Environmental Monitoring and Assessment, 191(3), 1–13. https://doi.org/10.1007/s10661-019-7281-y
- PMSDN - PREFEITURA MUNICIPAL DE SÃO DOMINGOS DO NORTE. (2016).
Plano Municipal de Saneamento Básico e Gestão Integrada de Resíduos Sólidos. Retrieved from https://www.saodomingosdonorte.es.gov.br/uploads/filemanager/Plano_Municipal_de_
Saneamento_Basico/Plano_Municipal_de_Saneamento_Basico_de_Sao_Domingos_do_Norte.pdf - Silva, A. E. P., Angelis, C. F., Machado, L. A. T., & Waichaman, A. V. (2008). Influência da precipitação na qualidade da água do Rio Purus. Acta Amazonica, 38(4), 733–742. https://doi.org/10.1590/S0044-59672008000400017
- Vespucci, A. G., Santos, J. G. R. dos, & Bayer, M. (2016). Estações fluviométricas do estado de Goiás: qualificação dos dados hidrológicos disponíveis na base HIDROWEB/ANA. Ateliê Geográfico, 10(3), 89–108.
No competing interests reported.