Identification of cuproptosis clusters in READ
Based on the expression of 10 CRGs, the unsupervised consensus clustering results were shown in Figure 1A, and the expression signatures of 10 CRGs were shown in Figure 1B, together with the correspondent clinical messages. To validate the clustering results, the Kaplan-Meier plot indicated the significant differences in prognosis among cuproptosis clusters (Figure 1C), and the principal component plot showed the fine effectiveness of differentiation (Figure 1D). As compared between cuproptosis type (CT) 1 and 3, which had relative better survival, CT 1 cluster was enriched of multiple metabolic pathways, including the glyoxylate and dicarboxylate metabolism, pyruvate metabolism and arginine and proline metabolism pathways, indicating the abrupt metabolic changes in CT1 (Figure 1E). Compared with CT1, the CT2 cluster had elevated complement and coagulation cascades (Figure 1F). CT2 cluster also had activated notch signaling pathway, mTOR signaling pathway and P53 signaling pathway, which represented the elevated proliferative activity in the CT2 (Figure 1G). These differences in biological pathways finally led to the worst survival of CT2 cluster.
Establishment of the cuproptosis related prognostic model
In order to assess the predictive significance of cuproptosis in READ, we created a PCA model called CRS using the overlap genes among the three cuproptosis clusters.The patients were divided into high- and low-CRS group based on a moderate cut-off. Figure 2A displayed the K-M survival curve, indicating that patients in the high-CRS group had superior overall survival (OS). The larger proportion of CT1 and all the samples in CT2 were classified into the low-CRS group, which had significantly worse survival (Figure 2B). Figure 2C depicted the clinical parameters and expression patterns of the encapsulated genes for each sample, while Figure 2D displayed the distribution of CRS and survival time. Following both univariate and multivariate Cox analyses, CRS was determined to be an independent protective factor associated with READ prognosis, in comparison to other conventional prognostic factors (All P < 0.05, Hazard Ratio < 1, Figure 2E, F).
The comparison of immune landscape between high- and low-CRS groups
Based on multiple methods, the estimated infiltration or proportion of immune cells were summarized in Figure 3A. Specifically, the CRS exhibited a positive association with the estimated B cells, Macrophages, and T helper cells, while showing a negative correlation with regulatory T cells (Tregs) (Figure 3B). The low-CRS group exhibited a notable increase in the infiltration of Tregs, myeloid derived suppressor cells (MDSC), and Macrophages, which were recognized as significant immunosuppressive elements in the TME (Figure 3C). Additionally, the low-CRS group demonstrated a significantly higher ImmuneScore and ESTIMATEScore, representing more immune cells and tumor cells infiltration. (Figure 3D). The ssGSEA results indicated there were higher level of immune checkpoint signatures, increased cytolytic activity and HLA molecules in the low-CRS group (Figure 3E). Moreover, results from the TIL website also indicated the higher infiltration of T helper cells in the high-CRS group as well as more infiltrated Tregs and MDSCs in the low-CRS group (Figure 3F). These results jointly demonstrated the enriched immune regulatory cells including Tregs and MDSCs in the low-CRS group, which may lead to the anergy of immune effector cells.
CRS subgroups had significant clinical implications and unique mutation landscape
We additionally investigated the association between CRS and the clinical condition of READ. Notably, the CRS was significantly lower in advanced stages samples and samples with metastasis, and was steadily decreased with T stages and N stages advanced (Figure 4A). Furthermore, the low-CRS group exhibited a considerably greater percentage of advanced READ (all P < 0.05, Figure 4B). Regarding patient prognosis, for patients with T3-4, N1-2 and stage Ⅲ-Ⅳ clinical status, the high-CRS group had significantly better overall survival (Figure 4C). Figure S1A and Figure S1B summarized the overall mutation landscape of high- and low-CRS group respectively. The low-CRS cohort exhibited a reduced TMB in comparison to the high-CRS cohort (Figure S1C). Additionally, the TMB showed a positive correlation with the CRS, which was determined using the PCA method (R= 0.26, P = 0.0014, Figure S1D). Also, samples with higher TMB had better OS (P < 0.001, Figure S1E), and together with CRS, could predict patient prognosis (P < 0.001, Figure S1F).
LIAS was the hub gene of cuproptosis related genes in READ
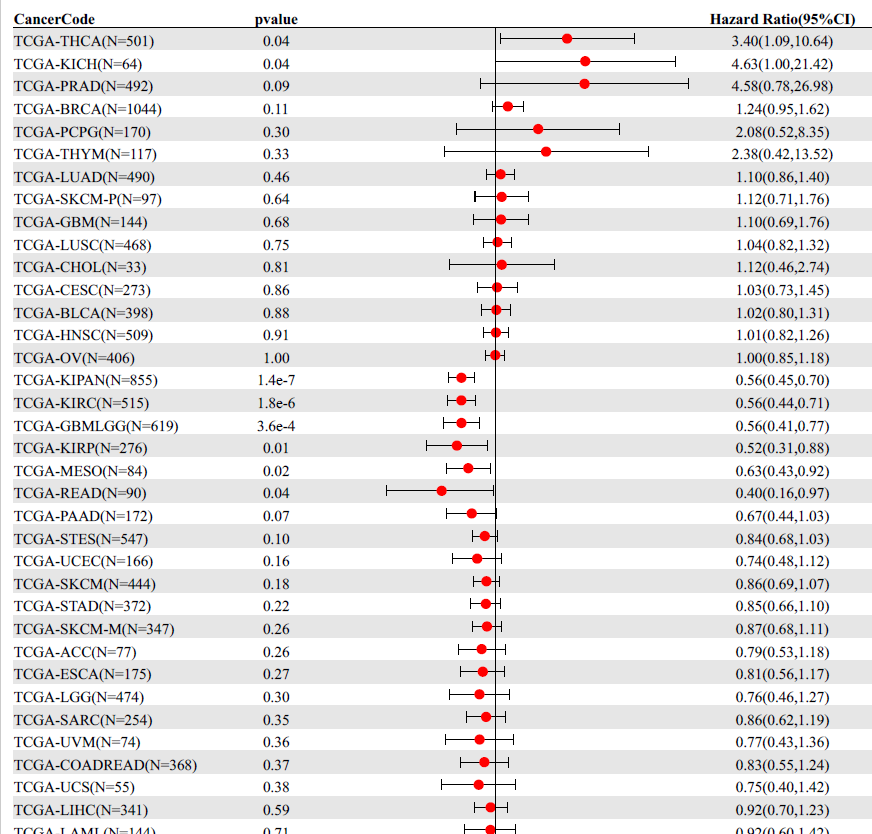
To uncover the hub CRG in READ, we conducted additional investigations into their predictive significance and association with immune markers. Out of the ten CRGs, seven of them (CDKN2A, DLAT, DLD, FDX1, GLS, PDHA1, and PDHB) exhibited increased expression in the tumor tissue. Conversely, LIAS displayed decreased expression (Figure 5A). Moreover, the low LIAS expression group had significantly worse survival (Figure 5B-K). To evaluate the individual role of LIAS in human cancers, the pancancer expression analysis was conducted. As was shown in Figure 6A, LIAS was differentially expressed in other 10 cancer types (P < 0.05). In half of the 10 types of cancers, LIAS was highly expressed in tumor tissues compared to normal tissues, including CHOL, LIHC, LUAD, LUSC, and STAD. In the remaining five cancer types, LIAS was lowly expressed in tumor tissues compared with normal tissues, including BRCA, KICH, KIRC, THCA, ESCA and UCES. Furthermore, we analyzed the prognostic value of LIAS in pan cancer. LIAS was significantly associated with survival prognosis in various malignant tumors, including READ (Figure S2). In the HPA database, the expression level of LIAS protein was notably elevated in READ tissues compared to the adjacent normal colon tissues (Figure 6B, C). And LIAS was mainly localized to the nucleoplasm, approved by the inmmunofluorescent staining of human cell line (Figure 6D, E).
LIAS was involved in a variety of cancer and immune-related signaling pathways
The GSEA method was employed to examine the disparities in pathways enriched by genes with differential expression between samples with high and low LIAS expression. The findings from the HALLMARK pathway enrichment analysis indicated that genes regulated by ALIS were linked to the regulation of different processes and functions related to tumors, including increased activity in pathways like myc signaling pathway, E2F signaling pathway and mTMOR signaling pathway with increased activity and some pathways with reduced activity, such as IL6-JAK-STAT3 signaling pathway and Kras signaling pathway (Figure 7A). Regarding KEGG and GO pathways, the diminished expression of LIAS additionally enhanced immune-associated signaling pathways, including B cell receptor signaling pathway, lmmunoglobulin receptor binding and Primary immunodeficiency. Conversely, the significant overexpression of LIAS primarily enriched signaling pathways related to synthesis and transport of amino acids and proteins, such as ribosome biogenesis, aminoacyl tRNA biosynthesis, and protein export. Additionally, we examined the infiltration of immune cells in the high- and low-LIAS expression subtypes using five different algorithms (TIMER, CIBERSORT, MCPCOUNTER, XCELL, and EPIC) to compare their results (Figure 8A). In our findings, we observed a negative correlation between LIAS expression and the abundance of various immune cells infiltrating the system. This includes significant immunosuppressive cells like regulatory T cells and M2 Macrophage (Figure 8B-L). On the other hand, there was a positive correlation between LIAS expression and the abundance of infiltrating CD8+ T cells (Figure 8M). Furthermore, the LIAS expression exhibited a negative correlation with the immune score, stromal score, and environment score, as depicted in Figure 7N-P. These data suggested that LIAS could have a distinct function in immune infiltration and might serve as a predictor for the response to immunotherapy in READ.
LIAS was associated with FBXW7 mutation in READ
Our research delved into the influence of LIAS on genomic alterations, as depicted in Figure 9A-D. We observed a positive correlation between LIAS and EREG-mRNAsi (R = 0.367, P < 0.001, Figure 9A), MSI (R = 0.264, P = 0.001, Figure 9B), and mRNAsi (R = 0.422, P < 0.001, Figure 9D). Contrarily, there was no notable correlation between TMB and LIAS (Figure 9C). Additionally, our study revealed the mutation patterns associated with LIAS in rectal adenocarcinoma (Figure 9E-G), highlighting a higher prevalence of FBXW7 mutations in patients with elevated LIAS expression (Figure 9G). In clinical correlations, patients with FBXW7 mutations exhibited potentially better clinical characteristics compared to those with the wild-type (Figure 10A). The GSEA suggested that FBXW7-mut patients may exhibit increased activity in E2F target, mTORC1 signaling, oxidative phosphorylation, and G2M checkpoints, but decreased activity in reactive oxygen species, UV response DN, early estrogen response, TGF-beta signaling, bile acid metabolism, xenobiotic metabolism, and epithelial mesenchymal transition (Figure 10B). In addition, we created a network of protein-protein interactions (PPI) using genes that showed differential expression between FBXW7-mut and wild-type individuals (Figure 10C).
LIAS possessed diagnostic value and drug concentration prediction in READ
According to the literature, it has been stated that nomograms have the potential to forecast the gene expression value in cancer diagnosis and the likelihood of survival [22]. To this end, we first analyzed the differences in LIAS expression in different clinical subgroups. The results showed significant differences in LIAS expression across clinical subgroups. LIAS expression was relatively low in the subgroups with more advanced T, N, and M stages, greater ages, and with lymphatic invasion (Figure 11A-E). Furthermore, we created a nomogram by merging clinical factors with LIAS in order to estimate the chances of survival for patients at 1, 3, and 4 years.The findings indicated that the prognosis prediction, which took into account the level of LIAS expression along with conventional factors like pathological T, N, M stages, age, and lymphatic invasion, demonstrated a consistently reliable predictive effectiveness (Figure 11F, G). Moreover, the expression of LIAS could also be used to predict drug sensitivity. Figures 11H-K illustrated that the estimated IC50 scores for Lapatinib and Parthenolide were lower in the low-LIAS group, implying heightened sensitivity to these agents among individuals with this subtype of READ. Conversely, patients within the high-LIAS group exhibited increased responsiveness to Nilotinib and Rapamycin.
Over expression of LIAS inhibited the proliferation and migration ability of colorectal cancer cell in vitro
To evaluate the tumor related effect of LIAS in vitro, HCT116 and RKO cells were stably transfected with a plasmid expressing LIAS, while cells transfected with a scrambled vector were used as a negative control. Using the plasmid, expression of LIAS was successfully over expressed in two colorectal cancer cell lines (Figure 12A). Subsequently, we examined the influence of LIAS on READ cell proliferation. The CCK-8 assay revealed a significant reduction in the proliferation ability of HCT116 and RKO cells upon overexpression of LIAS. (Figure 12B-C). These findings were further substantiated by clone assays conducted in both HCT116 and RKO cells (Figure 12D), indicating that LIAS effectively inhibits the proliferation of READ cells in vitro. Additionally, Transwell assays were performed to assess the impact of LIAS on the migration and invasion of READ cells. The results demonstrated that LIAS could impede malignancy in READ cells, as evidenced by decreased migration and invasion abilities in HCT116 and RKO upon LIAS overexpression (Figure 12E).