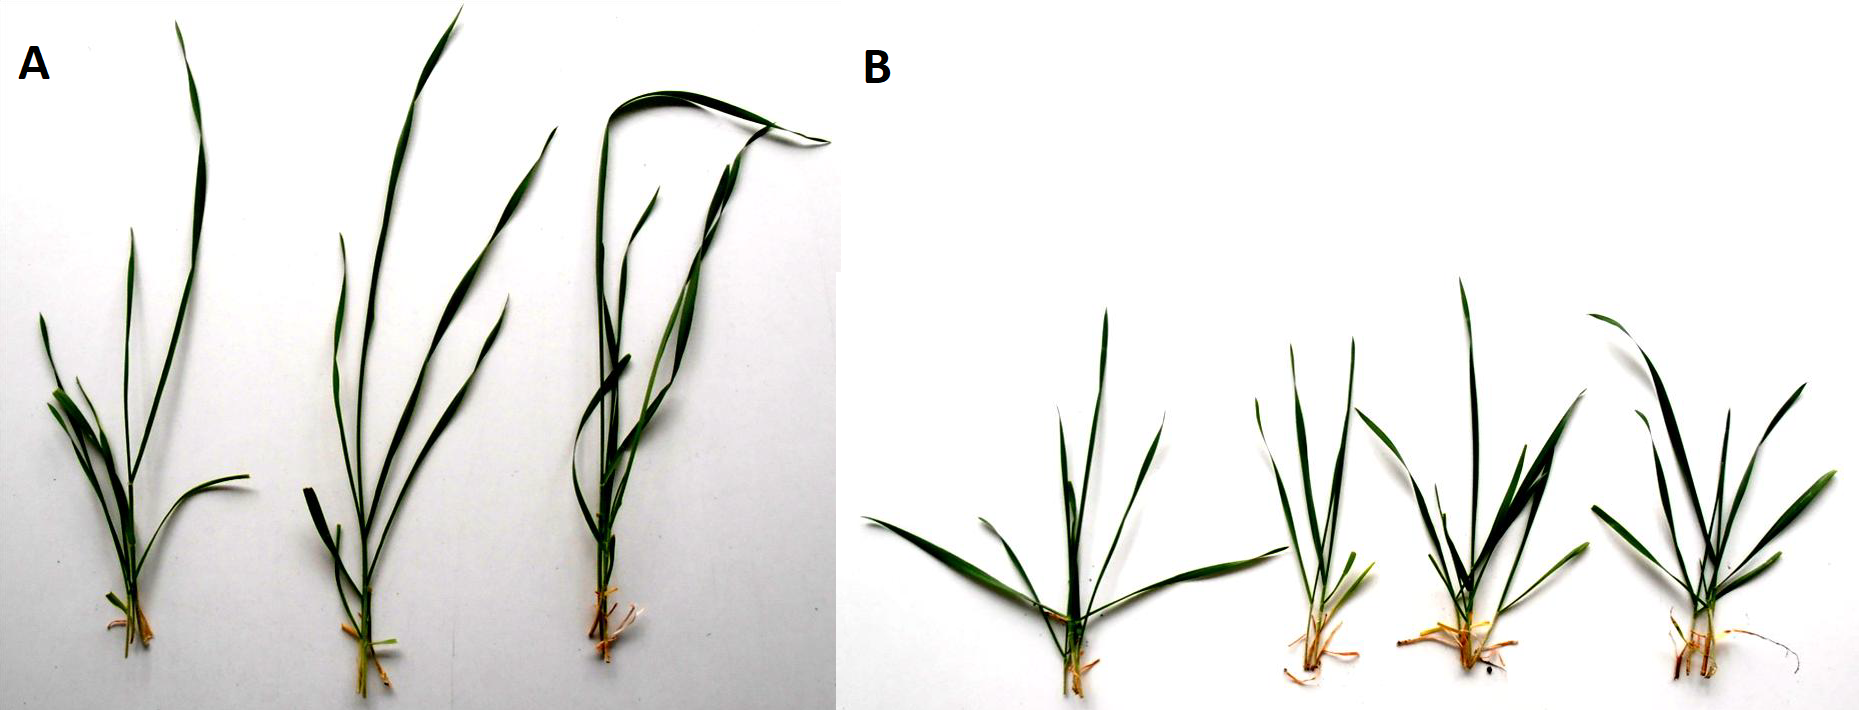
The cv. 'Hewo' seedlings had an upright habit, while cv. 'Magnat' seedlings - lying, with leaves spread close to the soil surface. Additionally, the dimensions of the leaves differed between parental cultivars at the same 7-weeks old cold-hardened seedlings stage (Fig. 1S). The first leaf was on average 69 mm longer and 0.94 mm narrower in cv. 'Hewo' than in cv. 'Magnat' seedlings (p < 0.05). The second leaf sheath and the lamina were on average 7.9 mm and 55.5 mm longer in 'Hewo' than in 'Magnat' (p < 0.05) seedlings. The second leaf blade was almost 1/3 narrower in 'Hewo' than in 'Magnat' (p < 0.05) seedlings.
All independent factors (plant genotype and experiment number) as well as the interaction between them had significant influence on the studied traits (p < 0.05). For that reason QTLs were calculated for the data of each experiment separately. The Shapiro-Wilk test as well as skewness and kurtosis results confirmed the normal distribution of values for every experiment and each trait (Table 1), what allowed to perform further QTL analysis.
Table 1
The values range of the analyzed traits: number of leaves (NL), length of first (LFL) and second (LSL) leaf, width of first (WFL) and second (WSL) leaf, second leaf sheath length (LSSL), second leaf blade length (LSLB) and fresh mass of leaves (LFM). Experimental mean value, together with standard deviation as well as the results of the Shapiro-Wilk test, skewness and kurtosis were presented.
|
Trait
|
Exp. No.
|
Minimum - Maximum
|
Mean value ± SD
|
Normality
|
Skwesness
|
Kurtosis
|
|
NL
Number of leaves
|
1
|
6–9
|
8 ± 0.6
|
0.19
|
-0.30
|
0.47
|
|
2
|
4–8
|
5 ± 0.8
|
0.15
|
0.43
|
-0.11
|
|
3
|
2–3
|
3 ± 0.3
|
0.11
|
-0.67
|
0.27
|
|
LFL
First leaf length (cm)
|
1
|
8.52–14.4
|
11.3 ± 1.2
|
0.23
|
-0.07
|
0.31
|
|
2
|
8.7–16.5
|
12.6 ± 1.5
|
0.25
|
0.14
|
0.24
|
|
3
|
9.3–16.9
|
13.3 ± 1.8
|
0.28
|
-0.03
|
-0.60
|
|
WFL
First leaf width (cm)
|
1
|
2.4–4.9
|
4.1 ± 0.4
|
0.16
|
-0.37
|
0.13
|
|
2
|
2.8–5.1
|
4.1 ± 0.3
|
0.12
|
-0.45
|
0.12
|
|
3
|
3.4–5.1
|
4.3 ± 0.3
|
0.12
|
-0.05
|
0.26
|
|
LSL
Second leaf length (cm)
|
1
|
16.2–35.5
|
25.2 ± 4.6
|
0.56
|
0.11
|
-0.96
|
|
2
|
13.6–31.3
|
22.3 ± 3.8
|
0.54
|
0.04
|
-0.73
|
|
3
|
12.4–28.8
|
21.5 ± 3.4
|
0.49
|
0.20
|
-0.28
|
|
WSL
Second leaf width (cm)
|
1
|
3.3–6.7
|
5.7 ± 0.6
|
0.17
|
-0.15
|
0.96
|
|
2
|
3.2–6.2
|
4.9 ± 0.6
|
0.14
|
-0.15
|
0.12
|
|
3
|
2.4–5.8
|
4.6 ± 0.5
|
0.13
|
-0.70
|
0.60
|
|
LSSL
Second leaf sheath length (cm)
|
1
|
0.9–6.1
|
3.6 ± 0.8
|
0.18
|
-0.25
|
0.38
|
|
2
|
1.9–5.5
|
3.5 ± 0.9
|
0.15
|
-0.01
|
-0.82
|
|
3
|
1.6–7.7
|
4.2 ± 1.2
|
0.17
|
0.12
|
0.02
|
|
LSLB
Second leaf blade length (cm)
|
1
|
14.7–29.6
|
21.6 ± 3.9
|
0.48
|
0.15
|
-0.93
|
|
2
|
11.7–26.4
|
18.8 ± 2.9
|
0.43
|
0.09
|
-0.45
|
|
3
|
9.7–22.8
|
17.4 ± 2.4
|
0.37
|
-0.24
|
0.17
|
|
LFM
Fresh mass of leaves (g)
|
1
|
0.1–0.9
|
0.4 ± 0.2
|
0.14
|
0.05
|
-0.61
|
|
2
|
0.1–1.1
|
0.6 ± 0.2
|
0.09
|
0.21
|
0.35
|
|
3
|
0.2–1.1
|
0.6 ± 0.2
|
0.09
|
0.17
|
0.17
|
QTL analyses revealed 22 loci identified by a composite interval mapping (CIM) with LOD value ≥ 3.0 which appeared in at least two experiments with range common for all analyzed traits (in cM). They included: 2 loci for the first leaf length (LFL), 3 loci for the first leaf width (WFL), 5 loci for the second leaf length (LSL), 3 loci for the second leaf width (WSL), 4 loci for the second leaf sheath length (LSSL) and 5 loci for second leaf blade length (LSLB) (Table 3). Additionally, 18 loci of QTL regions with LOD value ≥ 3.0 are presented for all analyzed traits (Table 1S): 4 loci for the number of leaves (NL), 3 loci for the first leaf length (LFL), 2 loci for the first leaf width (WFL), 2 loci for the second leaf length (LSL), 2 loci for the second leaf width (WSL), 1 locus for the second leaf blade length (LSLB) and 4 loci for the fresh mass of the leaves (LFM). Those 18 loci were specific only for one trait and appeared in one or two experiments.
Table 2
Correlation coefficients between the number of leaves (NL), length of first (LFL) and second (LSL) leaf, width of first (WFL) and second (WSL) leaf, second leaf sheath length (LSSL), second leaf blade length (LSLB) and the fresh mass of leaves (LFM) in a DH 'Hewo' x ‘Magnat' winter triticale mapping population evaluated in three different experiments.
| |
LFL
|
WFL
|
LSL
|
WSL
|
NL
|
LSLB
|
LSSL
|
|
WFL
|
0.428*
|
|
|
|
|
|
|
|
LSL
|
0.676*
|
0.238***
|
|
|
|
|
|
|
WSL
|
0.293**
|
0.689*
|
0.171**
|
|
|
|
|
|
NL
|
-0.050**
|
0.004***
|
-0.062**
|
0.332*
|
|
|
|
|
LSLB
|
0.672*
|
0.212***
|
0.992*
|
0.152**
|
-0.036***
|
|
|
|
LSSL
|
0.637*
|
0.271**
|
0.943*
|
0.161**
|
-0.145**
|
0.895*
|
|
|
LFM
|
-0.291***
|
-0.107**
|
-0.168***
|
-0.014***
|
0.048**
|
-0.171**
|
-0.145***
|
| *, **, *** - significant at P < 0.05, P < 0.01 and P < 0.001, respectively. |
Table 3
The characteristics of the most significant QTL regions identified by CIM method for the first leaf length (LFL), first leaf width (WFL), second leaf length (LSL), second leaf width (WSL), second leaf sheath length (LSSL) and second leaf blade length (LSLB) in DH ‘Hewo’ x ‘Magnat’ mapping population.
|
QTL name
|
Flanking markers a
(position in cM)
|
Exp.
No
|
LOD
|
LOD max. position
|
Marker
closest to the LOD peak
|
R2
(%) b
|
Add c
|
Favorable allele d
|
|
First leaf length (LFL)
|
|
Qlfl.hm.4R.1
|
4345445 : rPt-402563 (141.4–149.5)
|
2
|
4.4
|
142.7
|
4200451
|
15.1
|
-6.3
|
M
|
|
Qlfl.hm.6R.2
|
3623117 : 3045717 (18.7–39.5)
|
3
|
4.3
|
18.7
|
3623117
|
16.3
|
7.3
|
H
|
|
First leaf width (WFL)
|
|
Qwfl.hm.1R.1
|
4349664 : 4204964 (123.6–146.3)
|
3
|
4.3
|
123.6
|
4349664
|
14.9
|
19.0
|
H
|
|
5.3
|
136.9
|
rPt-507790
|
16.8
|
19.8
|
H
|
|
4.4
|
143.8
|
3609054
|
15.0
|
18.6
|
H
|
|
Qwfl.hm.4R.1
|
3611142 : 3620564 (132.8–160.8)
|
1
|
4.0
|
132.8
|
3611142
|
14.8
|
-21.1
|
M
|
|
4.2
|
143.9
|
4355123
|
14.9
|
-20.5
|
M
|
|
3.5
|
152.9
|
3043032
|
13.2
|
-19.6
|
M
|
|
Qwfl.hm.4R.2
|
3620564 : 4371409 (160.8–175.8)
|
3
|
5.8
|
168.7
|
rPt-509173
|
18.5
|
-21.0
|
M
|
|
Second leaf length (LSL)
|
|
Qlsl.hm.4B.1
|
4218883 : 3046835 (0.0–17.6)
|
2
|
4.0
|
6.3
|
4213221
|
5.1
|
9.1
|
H
|
|
3.9
|
15.0
|
6044038
|
5.0
|
9.3
|
H
|
|
Qlsl.hm.5R.1
|
rPt-506433 : rPt-507500 (0.0–12.0)
|
1
|
31.1
|
6.8
|
rPt-390294
|
6.9
|
3.8
|
H
|
|
Qlsl.hm.5R.2
|
4205026 : 3610765 (27.6–35.6)
|
2
|
23.4
|
29.8
|
3040546
|
6.5
|
3.2
|
H
|
|
Qlsl.hm.5R.3
|
4339461 : 3610765 (22.0–35.6)
|
3
|
13.6
|
24.2
|
4343102
|
4.3
|
2.3
|
H
|
|
14.0
|
29.8
|
3040546
|
4.3
|
2.3
|
H
|
|
Qlsl.hm.6R.3
|
3623117 : 3045717 (18.7–39.5)
|
3
|
3.6
|
35.5
|
3617691
|
8.1
|
1.1
|
H
|
|
Second leaf width (WSL)
|
|
Qwsl.hm.4R.1
|
wPt-4487 : 304302 (119.8–152.9)
|
1
|
3.9
|
141.4
|
4345445
|
13.9
|
-23.2
|
M
|
|
3.6
|
150.6
|
rPt-390504
|
12.5
|
-22.1
|
M
|
|
Qwsl.hm.4R.2
|
rPt-509173 : 3603973 (168.7–173.2)
|
3
|
5.2
|
170.9
|
rPt-505225
|
20.6
|
-27.5
|
M
|
|
5.2
|
175.8
|
4371409
|
21.7
|
-27.8
|
M
|
|
Qwsl.hm.6R.1
|
4213428 : 4202378 (365.1–383.1)
|
1
|
3.5
|
365.1
|
4213428
|
12.5
|
-23.9
|
M
|
|
4.1
|
379.7
|
4201137
|
14.3
|
-25.0
|
M
|
|
Second leaf sheath length (LSSL)
|
|
Qlssl.hm.1R.1
|
rPt-507790 : 4215936 (135.9–151.4)
|
1
|
4.3
|
149.9
|
3603565
|
6.5
|
-25.7
|
M
|
|
Qlssl.hm.5R.1
|
rPt-506433 : rPt-507500 (0.0–12.0)
|
1
|
23.2
|
6.8
|
rPt-390294
|
6.2
|
7.6
|
H
|
|
Qlssl.hm.5R.2
|
4343102 : 3047417 (24.2–31.4)
|
2
|
22.2
|
29.8
|
3040546
|
5.7
|
7.6
|
H
|
|
Qlssl.hm.5R.3
|
4343102 : 3047417 (24.2–31.4)
|
3
|
15.7
|
29.8
|
3040546
|
3.9
|
8.1
|
H
|
|
Second leaf blade length (LSLB)
|
|
Qlslb.hm.4B.1
|
4218883 : 3046835 (0.0–17.6)
|
2
|
5.6
|
0.0
|
4218883
|
8.6
|
8.9
|
H
|
|
5.7
|
15.0
|
3044038
|
8.4
|
8.8
|
H
|
|
Qlslb.hm.5R.1
|
rPt-506433 : rPt-507500 (0.0–12.0)
|
1
|
27.6
|
7.9
|
rPt-390522
|
6.8
|
3.1
|
H
|
|
Qlslb.hm.5R.2
|
4339461 : 3610765 (22.0–35.6)
|
2
|
21.6
|
29.8
|
3040546
|
5.3
|
2.3
|
H
|
|
Qlslb.hm.6R.1
|
4213428 : 4202378 (365.1–383.1)
|
2
|
4.1
|
377.5
|
rPt-505870
|
5.8
|
7.9
|
H
|
|
Qlslb.hm.6R.2
|
3623117 : 3045715 (18.7–39.5)
|
3
|
3.9
|
30.9
|
3606053
|
12.2
|
9.2
|
H
|
| a – an identifiable region of the QTL defined by the first and last marker of the QTL region; b – R2 (%) – percentage of the phenotypic variance explained by the QTL; c – Add – additive effect; d - favorable allele for each QTL: H - cv. Hewo and M - cv. Magnat. |
Number of leaves (NL)
The number of seedling leaves ranged from 4 to 9 in cold-hardened plants (Exp. 1 and 2, Table 1) as well as from 2 to 3 in unhardened ones (Exp. 3, Table 1). For this trait, four QTL regions were identified in Experiments 1 and 2 on chromosomes 2A, 3A, 6R and 7B (Table 1S). Those regions explained from 12.6–19.3% of phenotypic variation for Qnl.hm.7B.1 locus (Table 1S). For same locus the highest LOD value (5.4) was observed (Table 1S).
First leaf length (LFL)
The first leaf length ranged from 8.5 cm (Exp. 1) to 16.9 cm (Exp. 3). The longest first leaf was observed in unhardened, 4-weeks-old seedlings (Table 1). Five QTL regions were found for this trait (Table 3, Table 1S). Two of them: Qlfl.hm.4R.1 and Qlfl.hm.6R.2 loci cover common region of 4R and 6R chromosomes identified for other analyzed traits; remaining Qlfl.hm.3A.1, Qlfl.hm.6R.1 and Qlfl.hm.7B.1 were specific only for LFL trait (Table 1S). The highest LOD value (5.0) was observed for Qlfl.hm.7B.1 (Table 1S) and the highest explained phenotypic variation (16.3%) for Qlfl.hm.6R.2 (Table 3).
First leaf width (WFL)
The first leaf width ranged from 2.4 cm (Exp. 1) to 5.1 (Exp. 2 and 3) (Table 1). For this trait, five QTL regions were identified (Table 3, Table 1S). Three of them were considered as common for other analyzed traits (Qwfl.hm.1R.1, Qwfl.hm.4R.1, Qwfl.hm.4R.2, Table 3). Only two regions were specific for WFL (Table 1S). Identified loci referred to Exp. 1 and 3. For Qwfl.hm.1R.1 locus, the LOD was peaked in four different markers assigned to chromosome 1R (Table 3). The highest LOD value (5.8) and explained phenotypic variation (18.5%) was observed for Qwfl.hm.4R.2 locus (Table 3).
Second leaf length (LSL)
The longest second leaf was observed in Exp. 1 in cold-hardened plants (25.2 cm), while Exp. 3 mean value was 21.5 cm (Table 1). For this trait, seven QTL regions were identified in all experiments and five of them were common for other traits (Table 3, Table 1S). The most interesting LSL loci were found on rye chromosomes 5R and 6R for which very high LOD values (23.4, 31.3 and 35.5) for Qlsl.hm.5R.2, Qlsl.hm.5R.1 and Qlsl.hm.6R.3 were observed, respectively (Table 3). Positive allele effect of all those loci referred to cv. ‘Hewo’. The phenotypic variation of this trait was in range from 4.4% for Qlsl.hm.5R.3 to 8.1% for Qlsl.hm.6R.3 (Table 3).
Second leaf width (WSL)
The mean value of second leaf width was similar in Exp. 2 and 3 (4.9 cm and 4.6 cm, accordingly) and higher in Exp. 1 (5.7 cm, Table 1). Five loci were identified but only three were considered as common for all other traits; they were found on rye chromosomes 4R and 6R (Table 3, Table 1S). Loci specified for WSL were identified on wheat chromosome 1A as well as rye chromosome 3R (Table 1S). For all loci, negative allele effect referred to cv. ‘Magnat’. The highest phenotypic variation was observed for Qwsl.hm.4R.2 (21.7%) and the highest LOD value for Qwsl.hm.1A.1 and Qwsl.hm.4R.2 loci (Table 3, Tab. S1).
Second leaf sheath length (LSSL)
The longest second leaf sheath (4.2. cm) was observed in unhardened plants in Exp. 3 (Table 1); for plants in Exp. 1 and 2 the length was similar (3.6 and 3.5, accordingly, Table 1). For this trait, four QTL regions were identified on rye chromosomes 1R and 5R and all of those regions were common for other analyzed traits (Table 3). The most interesting loci were found on chromosome 5R with the highest LOD value (23.2) for Qlssl.hm.5R.1 (Table 3). The phenotypic variation for this trait explained 6.5% for Qlssl.hm.1R.1 locus. Positive allele effect of loci identified on chromosome 5R referred to cv. ‘Hewo’ whereas negative allele effect on of locus on 1R referred to cv. ‘Magnat’.
Second leaf blade length (LSSB)
The longest second leaf blade was observed in Exp. 1 (21.6 cm, Table 1) comparing to blades in Exp. 2 and 3 (18.8 and 17.4 cm, Table 1). Six QTL regions were identified for this trait and only one locus Qlslb.hm.5R.3 was specific (Table 1S). All loci for this trait were found on chromosomes 4B, 5R and 6R (Table 3, Table 1S). The most interesting loci were Qlslb.hm.5R.1 and Qlslb.hm.5R.2 for which LOD value was very high (27.6 and 21.5, respectively, Table 3). Positive allele effect of all those loci referred to cv. ‘Hewo’. The highest explained phenotypic variation (12.2%) was found for Qlslb.hm.6R.2 (Table 3).
Comparison of common QTL regions
22 out of total 40 loci identified in at least two experiments were common for all analyzed traits (Table 3). Those loci were identified on wheat chromosome 4B and on rye chromosomes 1R, 4R, 5R and 6R (Table 3).
On chromosome 4B, two loci were found for LSL and LSLB in Exp. 2 - Qlsl.hm.4B.1 and Qlslb.hm.4B.1, respectively (Table 3). Between those traits high correlation (0.992) was also observed (Table 2). Those QTL regions were in the same position on this chromosome, from 0.0 cM to 17.6 cM. In both regions, the CIM peak showed two markers and one of them, 3044038 was common for both QTL regions. The maximum LOD position was 5.6 and 5.7 for Qlslb.hm.4B.1 (Table 3). Positive allele effect of those loci referred to cv. ‘Hewo’.
On chromosome 1R, two loci for WFL and LSSL were identified in Exp. 1 and 3 - Qwfl.hm.1R.1 and Qlssl.hm.1R.1 between 123.6 cM and 151.4 cM (Table 3). For Qwfl.hm.1R.1 LOD peek revealed four markers with maximum LOD value 5.3 and it explained 16.8% of phenotypic variation (Table 3).
On chromosome 4R, five QTL regions were found for WFL, WSL and LFL in all experiments - Qwfl.hm.4R.2 and Qwsl.hm.4R.2 between 160.8 cM and 175.8 cM as well as Qlfl.hm.4R.1, Qwfl.hm.4R.1 and Qwsl.hm.4R.1 between 119.8 cM and 160.8 cM (Table 3). The correlation between WFL and WSL had high (0.689), and between WFL and LFL medium (0.428) value (Table 2). The highest LOD value was observed for Qlfl.hm.4R.1 (4.4) and Qwfl.hm.4R.2 (5.8). Negative allele effect of those loci referred to cv. ‘Magnat’ (Table 3). All of those loci explained 12.5% − 21.7% of phenotypic variation. For Qwfl.hm.4R.1 and Qwsl.hm.4R.1 maximum LOD peak was for two markers located near to each other on chromosome 4R (Table 3).
On rye chromosome 5R, eight QTL regions were detected in two different position (Table 3). In first 0.0–12.0 cM region, three loci: Qlsl.hm.5R.1, Qlssl.hm.5R.1 and Qlslb.hm.5R.1 were found for LSL, LSSL and LSLB in Exp. 1. For those regions very high LOD values was observed, with maximum (31.1) value observed for Qlsl.hm.5R.1 (Table 3). The same rPt-390294 peak marker was detected for Qlsl.hm.5R.1 and Qlssl.hm.5R.1 (Table 3). The high correlation between LSL, LSSL and LSLB was found (Table 2). Second region identified on chromosome 5R was located between 22.0 cM and 35.6 cM. It contained five QTLs for LSL, LSSL and LSLB identified in Exp. 2 and Exp. 3 (Table 3). The LOD peak in the same marker 3040546 was observed for loci Qlsl.hm.5R.2, Qlsl.hm.5R.3, Qlssl.hm.5R.2, Qlssl.hm.5R.3 and Qlslb.hm.5R.2 (Table 3). Those loci were also characterized by high LOD value, with the maximum 23.4 value for Qlsl.hm.5R.2. Positive allele effect of all those loci referred to cv. ‘Hewo’.
Two regions of QTL common for more than one trait were found on chromosome 6R. First, containing three loci – Qlfl.hm.6R.2, Qlsl.hm.6R.3 and Qlslb.hm.6R.2 for LFL, LSL and LSLB in Exp. 3 was located between 18.7 cM and 39.4 cM (Table 3). High correlation between those traits was also observed (Table 2). LOD value was the highest for Qlfl.hm.6R.2. Positive allele effect of all those loci referred to cv. ‘Hewo’ (Table 3). In second region, two loci - Qwsl.hm.6R.1 and Qlslb.hm.6R.1 for WSL and LSLB were found in Exp. 1 and Exp. 2 on chromosome 6R, between 365.1 cM and 383.1 cM and with LOD value 4.1 (Table 3).