Considered one of the most consumed foods in the world, milk has many nutritional properties healthily to human. The toxic elements in milk can come from environmental sources such as the area where livestock are confined, as well as food and water. In addition, milk can be contaminated during and after ordering, in the industrialization process or, during transport and packaging. Whey is often discarded in the manufacture of milk, however some applications of this by-product can be useful, and among the advantages is the reduction of waste generation, thus becoming an environmentally correct action. In this work, an FIA-FAAS system was proposed using activated carbon fibers (ACF) modified with albumin forming Restricted Access Material (ACF-RAM) and using this material as an adsorbent in SPE, for determination of cadmium in whey. The abbreviation adopted for this method was FIA-SPE-ACF-RAM-FAAS. The RAM possibility the directed introduction of the whey samples to the system without any prior treatment because only ions could be adsorbed into ACS, the bigger molecules, e.g. proteins, were discarded to waste during the process. The FIA system was optimized by chemometric tools such as Factorial Design and Doehlert Matrix. The Limit of Detection was 0.24 µg L-1 and the Limit of Quantification was 0.81 µg L-1. The method was applied to a whey sample, the precision checked through Relative Standard Deviation was always less than 5.0 %. The accuracy was verified through the spiked sample and recovery were between 95% and 105%.
Research Article
The Use of Carbon Fiber Restricted Access Material for Cadmium Determination in Milk Whey
https://doi.org/10.21203/rs.3.rs-4312062/v1
This work is licensed under a CC BY 4.0 License
You are reading this latest preprint version
Activated Carbon Fibers
Cadmium
RAM
FIA
FAAS
Milk is one of the most consumed foods around the world, and its nutritional properties have been frequently researched [1]. Beside of organics components, such as proteins and fats, the minerals are also interesting to human health. On the other hand, the contamination by toxic elements is worrying, due to the high-scale production, industrialization, and some environmental parameters [2]. The toxic elements in milk, can come from environmental sources, such as the area where the cattle are confined as well as the food and water. Also, the milk can be contaminated during and after the milking, in the industrialization process or, in some cases, during the transport and packaging. It has been very common to precipitate the milk proteins to produce cheese, and several other dairy products [3]. The metallic elements, in milk, can be found in proteins, bounded to amino acids as well as in the ion form in whey [4]. The whey is often discarded on milk manufacturing. However, some applications of this by-product can be useful, and among the advantages there is the decrease in waste generation, becoming, therefore, an environmental correct action [5].
The whey is rich in some micro and macro nutrients, and this motivated to propose the methods to it quality control e.g. cadmium determination in whey samples [6].
Atomic Absorption Spectrometry (AAS) are the most used technique to determine Cadmium. When the sample has low concentration (µg L-1), the Graphite Furnace Atomization (GFAAS) is recommended. On the other hand, if the concentration is high (mg L-1), the Flame Atomization (FAAS) can be employed [7].
In despite of GFAAS technique has sufficiently sensitivity to determine low concentrations of analytes, some alternatives using FAAS are useful. As an example, it has the use of pre-concentration with Solid Phase Extraction (SPE).
Coupling SPE with FAAS can be relatively easy when the Flow Injection Analysis (FIA) is used. There is a large amount of work employing these tools [8].
Briefly, FIA technique is a canalization of reagents and samples that increases the methodology performance. The mains´ FIA components are peristaltic pump (to propel the fluids), injector commutator (to introduce the samples), the detector (to produce the signal) and, of course, the tubes for the conduction of fluids.
In the FIA-SPE-FAAS system, the adsorbent material is the main component and, in this work, the Activated Carbon Fiber (ACF) of Restrict Access was used [9–10].
Carbon Fiber is an adsorbent material used for air and water purification. It has high adsorption capacity, when compared to granulated carbon and powdered activated carbon. In addition, carbon fiber is light weight, flexible, easy to process, and chemically stable. To increase its adsorption capacity, carbon fiber can be activated with acid treatment. In the present work, the ACF was modified to form a Restricted Access Material (RAM) [11].
RAM can selectively adsorb small-sized analytes, in the presence of larger compounds. Therefore, RAM had been very useful to determination of metal ions on complex samples, e.g., whey and other biological fluids [12–13].
To transform ACF into ACF-RAM, the material was treated with Bovine Serum Albumin (BSA) and sodium borohydride14, forming a layer that surrounded the ACF. The BSA layer is hydrophobic, so the proteins present in sample were repelled, and only the ions crossed this layer and reached the ACF, where they were adsorbed [15].
To optimize the proposed method, chemometric tools (Factorial Design, to screening the significant variables, and Doehlert Matrix, to define optimum values for each variable) were employed. These chemometric tools are better than conventional univariate procedures and present the advantages such as: information about interaction among variables, lower numbers of experiments, and more accuracy to reach the optimum values for each variable [16].
The aims of this work were to modify the ACF, to form ACF-RAM and to employ this material as adsorbent on SPE, to cadmium determination in whey protein samples. To proceed this method, a FIA with SPE that had ACF-RAM was proposed. The abbreviation adopted for this method was FIA-SPE-ACF-RAM-FAAS.
The experimental procedures were conducted at the Instrumental Analytical Chemistry Laboratory, in Chemistry Institute of the Federal University of Alfenas, UNIFAL-MG, Alfenas, Brazil.
Solutions and Reagents
The Cadmium solutions, used in the experiments, were prepared from the 1,000 mg L-1 stock solution (Sigma-Aldrich). To adjust the pH values of the samples, 1.0 mol L-1 sodium hydroxide (Merck-Sigma Aldrich) and, 0.1 mol L-1 nitric acid prepared by diluting 65% HNO3 (Merck-Sigma Aldrich), were used. All glassware was decontaminated using a 10% v/v HNO3 bath, for at least 24 h.
Carbon Fiber
The carbon fibers, figure 1, were produced by Dr. Jossano Saldanha Marcuzzo (FATEC-SJC, SP\ITA\INPE), which has equipment and expertise in the process of carbonization and activation of carbon fibers. The synthesis of carbon fibers had thermic treatment of PAN textile in 2 steps. The first step was at 200° for 50 min, and the second step at 300oC for 50 min. More details about the synthesis of this material are described in works by Marcuzzo et al. 2012 [17] and Marcuzzo, Otani 2015 [18].
Restrict Access Materials (RAM) Production
To cover the carbon fibers, 45 mL of a 1% BSA solution (w/v) in 50 mmol L-1 phosphate buffer (pH = 5.7) and 5 mL of a 1% glutaraldehyde aqueous solution were percolated (v/v) on an SPE cartridge containing 200 mg of carbon fiber. In this step, glutaraldehyde, a bifunctional crosslinking agent, established interconnections between the amine groups of the protein chains, fixing the BSA layer around the ACF. After a period of 5 h, 10 mL of a 1% sodium borohydride aqueous solution (w/v) was percolated through the cartridge to reduce the imines (originated from the previous reaction) to amines, which are more chemically stable groups, thus providing chemical stability to the material. Finally, the material was washed with water to remove the remaining reagents from the coating process, according to the representative scheme in Figure 2.
Column to Solid Phase Extraction (SPE)
To prepare the column assembly (Figure 3) of weighed approximately 0.2 g of the Carbon Fiber material coated with BSA and packaging it in a tube from a disposable syringe for Insulin with a volume of 1 mL. The ends of the tube were filled with cotton fabric to avoid wasting material. Column dimensions were 2 mm inside diameter and 0.3 mm length.
FIA-SPE-ACF-RAM-FAAS
System
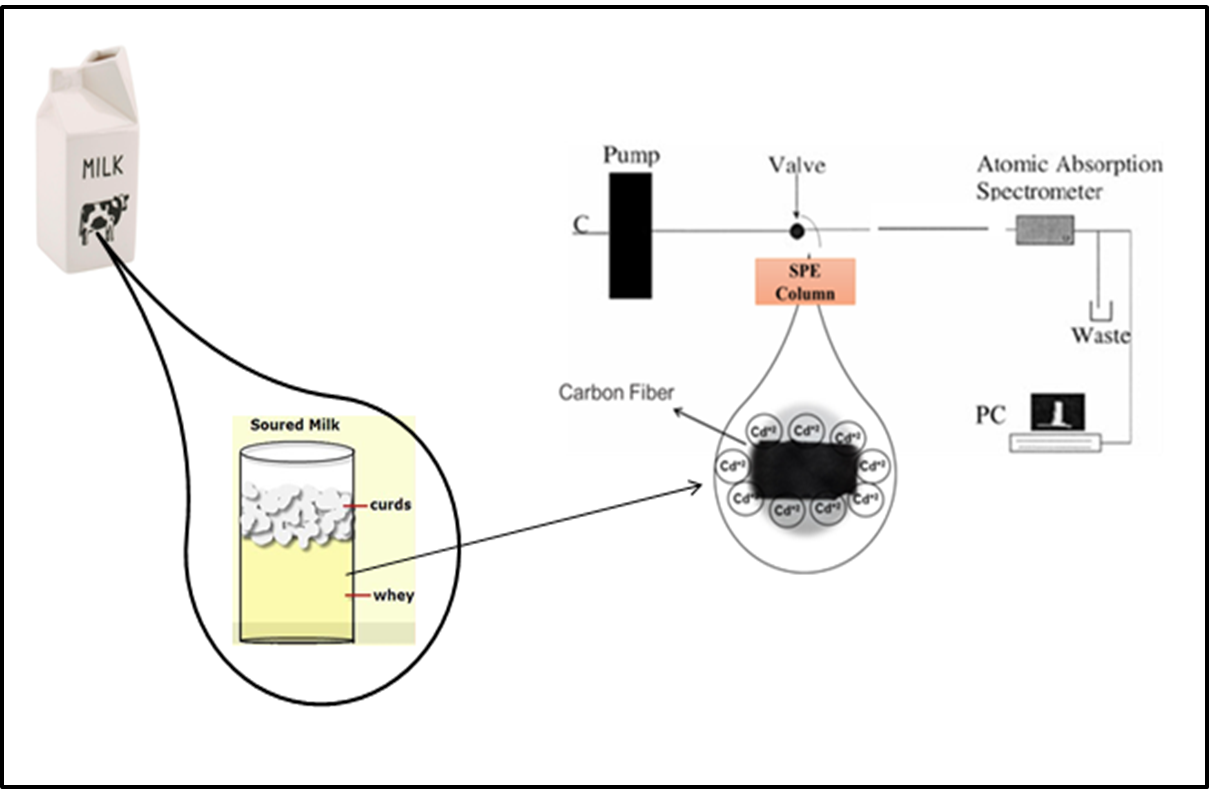
For cadmium determination, a FIA-SPE-ACF-RAM-FAAS system, shown in figure 4, was used. It was composed of a Shimadzu AA-6800 atomic absorption spectrometer (Shimadzu, Tokyo, Japan), equipped with a cadmium hollow cathode lamp (λ= 228.8 nm) and a deuterium lamp for background correction. The FIA system had a peristaltic pump (Ismatec IPC-08, Glattzbrugg, Switzerland), equipped with Tygon® tube to propel all reagent and solutions through the polyethylene canalization (0.8 mm i.d.). An acrylic injector commutator was used to select the wash and elution/sampling steps, during the procedures. The FIA-SPE-ACF-RAM-FAAS system, work in two steps. The first step start when the 20 ml of sample was conducted through the system and pass by column to adsorption of analyte (Cd). The second step starts when the system is commuted and the eluent solution pass through the column provoking the desorption of the analyte and lead it until FAAS for detection. After, the system is commuted again and repeat the cycle.
FIA-SPE-ACF-RAM-FAAS
Optimization
For this study, a two-level factorial design was used, getting a set of eight experiments carried out in duplicates and at random way. The pH of the solution (pH), the Pre-concentration Flow Rate (FR), the Eluent Concentration (EC) and their possible interactions were investigated. Table 1 shows the selected factors. The others experimental conditions for the procedure were cadmium concentration 50 µg L-1, elution flow rate of 7.5 mL min-1 and pre-concentration volume of 20 mL.
Table 1 Factor levels in planning 23
|
Levels |
||||
|
|
Initials |
Factor |
Minimum (-) |
Maximum (+) |
|
EC |
Eluent Concentration (mol L-1) |
0.1 |
1.0 |
|
|
FR |
Pré-concentration flow rate (mL min-1) |
3.5 |
7.5 |
|
|
|
pH |
Sample pH |
3.5 |
5.5 |
Levels
|
Experiment |
Fatores |
||
|
EC (mol L-1) |
FR (mL min-1) |
Sample pH |
|
|
1 2 3 4 5 6 7 8 |
- (0.1) +(1.0) -(0.1) +(1.0) -(0.1) +(1.0) -(0.1) +(1.0) |
- (3.5) - (3.5) + (7.5) + (7.5) - (3.5) - (3.5) + (7.5) + (7.5) |
- (3.5) - (3.5) - (3.5) - (3.5) + (5.5) + (5.5) + (5.5) + (5.5) |
Font: From Autor
After the Factorial Design Experiments a Doehlert Matrix were performed. Table 2 shows the planning of the Doehlert Matrix, where the other experimental conditions used were: Cadmium concentration 50 µg L-1, elution flow rate 7.5 mL min-1 and pre-concentration volume 20 mL.
Table 2 Coded ( ) and actual levels of the Doehlert Matrix, for 3 factors used in the optimization of the Cd2+ on-line pre-concentration system in carbon fiber.
|
Factor |
Coded and Real Levels |
||||||
|
EC (mol L-1) |
|
(-1) 0.025 |
(-0.5) 0.06 |
(0) 0.1 |
(0.5) 0.15 |
(1) 0.2 |
|
|
pH |
(-0.866) 2.5 |
(-0.577) 3.5 |
(-0.289) 4.5 |
(0) 5.5 |
(0.289) 6.5 |
(0.577) 7.5 |
(0.866) 8.5 |
|
FR (mLmin-1) |
|
|
(-0.817) 6.5 |
(0) 7.5 |
(0.817) 8.5 |
|
|
|
Experiments |
Fators |
||
|
EC (mL min-1) |
pH |
FR (mol L-1) |
|
|
1 |
0.1 (0) |
5.5 (0) |
7.5 (0) |
|
2 |
0.2(1) |
5.5(0) |
7.5 (0) |
|
3 |
0.15(0.5) |
8.5(0.866) |
7.5(0) |
|
4 |
0.15(0.5) |
6.5(0.289) |
8.5(0.817) |
|
5 |
0.025(-1) |
5.5(0) |
7.5(0) |
|
6 |
0.06(-0.5) |
2.5(-0.866) |
7.5(0) |
|
7 |
0.06(-0.5) |
4.5(-0.289) |
6.5(-0.817) |
|
8 |
0.15(0.5) |
2.5(-0.866) |
7.5(0) |
|
9 |
0.15(0.5) |
4.5(-0.289) |
6.5(-0.817) |
|
10 |
0.06(-0.5) |
8.5 (0.866) |
7.5(0) |
|
11 |
0.1(0) |
7.5(0.577) |
6.5(-0.817) |
|
12 |
0.06(-0.5) |
6.5(0.289) |
8.5 (0.817) |
|
13 |
0.1(0) |
3.5(-0.577) |
8.5 (0.817) |
*The first number represents actual values. numbers in parentheses represent encoded values. Font: From Autor
Sample collection and preparation
Whey samples from 7 different brands of milk were analyzed in the following categories: Skimmed milk (SM), Whole milk (WM), and semi-skimmed milk (SSM), all collected in supermarkets at the Alfenas city, MG, Brazil. The samples were stored in glass vials and analyzed within a maximum period of 24 h. To obtain whey, 1 mL of 0.1 mol L-1 nitric acid was added to each 100 mL of sample, which were then centrifuged and filtered. All samples had the pH adjusted to 6.2 with NaOH, 1 mol L-1 and/or HNO3 0.1 mol L-1, before analysis.
Factorial Design
It was observed by the Pareto Diagram (Fig. 5), that all factors and two-level interactions were significant (p > 0.05). Only the three-level interaction was not significant. It is important to mention that information about interactions is not obtained in univariate designs. The Eluent Concentration has a negative effect, so the lower level produces a greater response, the other variables have the positive effect, therefore the responses are directly proportional to the levels.
Doehlert Matrix Optimization
After obtaining the information from the factorial planning, it was possible to continue the optimization using a Doehlert Matrix (Table 3).
The method of least squares was used to obtain a second-degree polynomial equation from the data obtained with the Doehlert Matrix, see Eq. 1, by which the response surface graph (Fig. 6) and the maximum values for each variable were found. All calculus and graphs were done using a Excel plan® Microsoft.
|
Factor |
Coded and Real Levels |
||||||
|---|---|---|---|---|---|---|---|
|
EC (mol L− 1) |
(-1) 0.025 |
(-0.5) 0.06 |
(0) 0.1 |
(0.5) 0.15 |
(1) 0.2 |
||
|
pH |
(-0.866) 2.5 |
(-0.577) 3.5 |
(-0.289) 4.5 |
(0) 5.5 |
(0.289) 6.5 |
(0.577) 7.5 |
(0.866) 8.5 |
|
FR (mL min− 1) |
(-0.817) 6.5 |
(0) 7.5 |
(0.817) 8.5 |
||||
|
Experiments |
Factor |
Absorbance |
||
|---|---|---|---|---|
|
EC (mL min− 1) |
pH |
FR (mol L− 1) |
||
|
1 |
0.1 (0) |
5.5 (0) |
7.5 (0) |
0.359–0.334 |
|
2 |
0.2(1) |
5.5(0) |
7.5 (0) |
0.283–0.268 |
|
3 |
0.15(0.5) |
8.5(0.866) |
7.5(0) |
0.211–0.210 |
|
4 |
0.15(0.5) |
6.5(0.289) |
8.5(0.817) |
0.288–0.318 |
|
5 |
0.025(-1) |
5.5(0) |
7.5(0) |
0.063–0.061 |
|
6 |
0.06(-0.5) |
2.5(-0.866) |
7.5(0) |
0.042–0.040 |
|
7 |
0.06(-0.5) |
4.5(-0.289) |
6.5(-0.817) |
0.155–0.160 |
|
8 |
0.15(0.5) |
2.5(-0.866) |
7.5(0) |
0.085–0.037 |
|
9 |
0.15(0.5) |
4.5(-0.289) |
6.5(-0.817) |
0.263–0.216 |
|
10 |
0.06(-0.5) |
8.5 (0.866) |
7.5(0) |
0.187–0.197 |
|
11 |
0.1(0) |
7.5(0.577) |
6.5(-0.817) |
0.218–0.221 |
|
12 |
0.06(-0.5) |
6.5(0.289) |
8.5 (0.817) |
0.246–0.272 |
|
13 |
0.1(0) |
3.5(-0.577) |
8.5 (0.817) |
0.122–0.087 |
| *The first number represents actual values. numbers in parentheses represent encoded values. Font: From Autor | ||||
The analysis of variance (ANOVA) (Table 4) showed that there was no lack of fit in the quadratic model, and 99.0% of the source of variation in this model is explained by regression at a confidence level of 99.0%. Thus, with the information found during the optimization process (Fig. 6), the following optimized conditions were reached: pre-concentration flow rate 7.7 mL min − 1, sample pH 6.2 and eluent concentration = 0.13 mol L− 1.
|
F (calculated) |
F (tabulated) |
||
|---|---|---|---|
|
MQR/MQr |
695.79 |
2.54 |
Regression is significant |
|
MQf/Mqe |
6.5 |
6.70 |
No lack of fit |
|
R2 |
0.997848802 |
||
| Legend: MQR: regression quadratic square, MQr: residuous quadratic square. Font: From Autor | |||
Figures of merit and application
To obtain the concentration factor and the sensitivity of the method, two analytical curves were prepared first with direct readings on the FAAS flame, as shown in Fig. 7. The linear range for this curve was 50 to 200 µg L− 1, (R = 0.9996) with a linear regression equation: A = 9x10− 4[Cd+ 2] + 4.3x10− 3.
The second calibration curve (Fig. 8), using the FIA-SPE-ACF-RAM-FAAS system, the linear range for this curve (A = 0.0136[Cd+ 2] + 0.0015) was 0.5 µg L− 1 to 12 µg L− 1, (R = 0.9923).
The detection (LD) and quantification (LQ) limits were 0.24 and 0.81 µg L− 1, respectively. The pre-concentration factor was calculated, based on the ratio between the angular coefficient of the obtained curves with and without pre-concentration. The obtained pre-concentration factor (15.11) was very close to one of the mains adsorbents reported in the literature, the silica, which has a pre-concentration Cd factor of 18.44. Table 5 presents the merit figures of the proposed method. It is important to mention that if you need of more sensitivity, a higher sample volume can be used, nevertheless the time for analysis to be higher too.
|
Linear Range, µg L-1 |
0.5–12.00 |
|---|---|
|
Sensitivity, L µg-1 |
0.0015 |
|
Detection limit, µg L-1 |
0.24 |
|
Quantification limit, µg L-1 |
0.81 |
|
Precision, % |
2.94 |
|
Pre-concentration factor |
15.11 |
| Font: From Autor | |
Study of accuracy and application of methods
The method was applied to several whey samples collected in supermarkets in the city of Alfenas (Table 6). To evaluate precision, an addition/recovery test was performed and results were obtained between 99 and 110% recovery. The limit of quantification obtained (0.81 µg L− 1) was lower than the maximum limit established by the National Health Surveillance Agency, Anvisa, in its Resolution - RDC nº 4219 (0.05 mg kg− 1) and by European Food Safety Authority, EFSA20, (0.0025 mg L− 1).
Table 6 Addition and Recovery in samples of skimmed, whole and semi-skimmed whey with the pre-concentration step in the on-line system for the Cd+2 determination
|
Sample Whey |
Conc. Cd+2 Added (µg g L-1) |
Conc. Cd+2 Obtained (µg g L-1) |
% Recovery |
|
Skimmed milk A |
0 5 |
0.56 5.53 |
99 |
|
Skimmed milk B |
0 5 |
0.49 5.24 |
95 |
|
Skimmed milk C |
0 5 |
0.42 5.48 |
101 |
|
Semi-skimmed milk A |
0 5 |
0.25 5.51 |
105 |
|
Semi-skimmed milk B |
0 5 |
0.47 5.54 |
101 |
|
Whole milk A |
0 5 |
0.20 5.23 |
100 |
|
whole milk B |
0 5 |
0.54 5.51 |
99 |
Font: From Autor
Table 7 shows comparisons of the method proposed in this work with some already existing in the literature, when studying the determination of cadmium in milk samples. From the table it can be seen that most of the methodologies use mineralization processes, differentiating the proposed method because it is a treatment in which the use of high temperatures, pressures and large volumes of acids and oxidizing agents is avoided21. The FIA-SPE-ACF-RAM-FAAS method was efficient for metal extraction at room temperature using a low volume of acid (only 1 mL of HNO3 for the whey obtaining step). These advantageous characteristics added to the adequate validation of the proposed method showed that the FIA-SPE-ACF-RAM-FAAS method is efficient for extracting metals from complex samples and that the developed method can be applied in routine analyzes to verify the quality of whey. Therefore, this method is suitable for monitoring Cd concentration in whey samples, with the frequency of pre-concentration and sample and/or standard readings being 12 h− 1.

The ACF functionalized with BSA was applied as adsorbent in the FIA-SPE-ACF-RAM-FAAS for Cd determination in whey samples and performed well in terms of precision and accuracy. It also presented LD and LQ suitable for applications on these samples. The chemometric tools, employing factorial design and Doehlert's matrix improved the method optimization and reduced the number of experiments, consequently the time and costs of analyses. The pre-concentration factor of 15.11 was close to others adsorbents reported in the literature, such as silica, which has a pre-concentration Cd factor of 18.44. The frequency of pre-concentration and readings of samples and/or standards was 12 h− 1. In addition, the material is low cost, recyclable, and the FIA-SPE-ACF-RAM-FAAS system reduces the consumption of reagents and sample, and generating less waste, being compatible with green chemistry.
DECLARATION OF CONFLICT OF INTEREST
The authors declare that they have no known competing financial interests or personal relationships that could have appeared to influence the work reported in this paper.
FINANCING
This study was partially funded by the Coordination for the Improvement of Higher Education Personnel - Brazil (CAPES) - Financial Code 001.
ETHICAL APPROVAL AND DATA AND MATERIAL AVAILABILITY: not applicable.
Author Contribution
Nathália C. Costa : Doctoral students , experimental datas acquisition Giovana F. Lima : auxiliar orientations Cristiana S. Magalhães: auxiliar orientations Eduardo J. Arruda : Syntesis of adorbent materialsJossano S. Marcuzzo :Syntesis of adorbent materialsGizele A. Almeida : Experimental data acquisitionPedro O. Luccas? Main Orientation.
Acknowledgement
This study was partially funded by the Coordination for the Improvement of Higher Education Personnel - Brazil (CAPES) - Financial Code 001. Thanks CAPES.
- MARTIN, N. H.; EVANOWSKI, R.L; WIEDMANN M. Invited review: Redefining raw milk quality—Evaluation of raw milk microbiological parameters to ensure high-quality processed dairy products. Journal of Dairy Science, v. 106, p. 1502-1517.
- BAKIRCIOGLU, D.; et al. Investigation of macro, micro and toxic element concentrations of milk and fermented milks products by using an inductively coupled plasma optical emission spectrometer, to improve food safety in Turkey. Microchemical Journal, v. 136, p. 133-138.
- YILDIZ, F. Development and Manufacture of Yogurt and Other Functional Dairy Products, Chapter 8: Quality Attributes of Yogurt and Functional Dairy Products. Ed. 1, 2009.
- ANTUNOVIĆ, Z.; et al. Concentrations of mercury and other elements in ewes’ milk: Effect of lactation stage. Chemosphere, v. 261, December 2020.
- AYED, L.; M’HIR, S.; ASSES, N. Sustainable whey processing techniques: Innovations in derivative and beverage production. Food Bioscience, v.53, June 2023.
- ROCHA, J.M.; GUERRA, A. On the valorization of lactose and its derivatives from cheese whey as a dairy industry by-product: an overview. European Food Research and Technology, v.246, p.2161-2174,2020.
- SISTO, A.; MOLLO, A.; KNOCHEN, M. Fast and simple method using DLLME and FAAS for the determination of trace cadmium in honey. Journal of Food Composition and Analysis, v. 82, 2019.
- BARBOSA, F.A.; et al. Restricted access carbon nanotubes for direct extraction of cadmium from human serum samples followed by atomic absorption spectrometry analysis. Talanta, 213, 2015.
- FANG, Z., XU, S., ZHANG, S., Fundamental and pratical considerations in the desing of on-line column preconcentration for flow-injection atomic spectrometric systems. Analytica Chimica Acta, 200, 2007, 35-49.
- FANG, Z. Flow injection separation and preconcentration. Nova York, EUA. Ed. VHC, 1993.
- BARBOSA, A. F.; et al. Restricted access carbon nanotubes for direct extraction of cadmium from Human serum samples followed by atomic absorption spectrometry analysis. Talanta, v. 131, p. 213-220, 2014
- KRUG, F. J. Métodos de preparo de amostras, fundamentos sobre preparo de amostras orgânicas e inorgânicas para análise elementar. Piracicaba, 2008.
- CHICO, J. et al. Restricted access materials for sample clean-up in the analysis of trace levels of tetracyclines by liquid chromatography: Application to food and environmental analysis. Journal of Chromatography A, v. 1181, n. 1-2, p. 1-8, 2008.
- BARBOSA, A. F.; et al. Restricted access carbon nanotubes for direct extraction of cadmium from human serum samples followed by atomic absorption spectrometry analysis. Talanta. v.131, p.213-220, 2015.
- MARCUZZO, J.S., OTANI, C., POLIDORO, H.A, OTANI, S. Influence of thermal treatment on porosity formation on carbon fiber from textile PAN. Mater Res. v. 16, n. 1, p. 136-144, 2012.
- LUBIN, G. Handbook of Composites. Nova York (USA): Ed. Van Nostrand Reinhold, 1982.
- MARCUZZO, J.S., OTANI, C., POLIDORO, H.A, OTANI, S. Influence of thermal treatment on porosity formation on carbon fiber from textile PAN. Mater Res. v. 16, n. 1, p. 136-144, 2012.
- MARCUZZO, J. M., OTANI, C. Fibra de carbono ativada-produção ultrarrápida a partir da PAN têxtil: abordagem da produção e caracterização de fibra de carbono ativada a partir de matéria prima têxtil. Novas Edições Acadêmicas. 1 ed., p. 152, 2015.
- BRAZIL MINISTRY OF HEALTH. NATIONAL HEALTH SURVEILLANCE AGENCY. RESOLUTION - RDC No. 42, of August 29, 2013. Available at [http://www.anvisa. gov.br/alimentos/informes/33_251007.htm]. [Accessed 2023 Jun 22].
- EUROPEAN FOOD SAFETY AUTHORITY. Regulation 1881/2006. [Access-2023 Jun 22] Available at http://www. efsa.europa.eu/en/topics/topic/metals.htm
- CASTILHO, R.L. Synthesis and characterization of magnetic restricted access carbon nanotubes and their use for extraction of lead and cadmium in milk samples. Doctoral thesis Federal University of Alfenas.2023
- SUJKA, Monika. et al. Determination of the content of Pb, Cd, Cu, Zn in dairy products from various regions of Poland. Open Chemistry, Germany, v. 17, n. 1, p. 694–702, 2019. ISSN: 23915420, DOI: 10.1515/chem-2019-0072.
- MONTEVERDE, Vicenzo. et al. Heavy Metal Levels in Milk and Serum of Dairy Cows from Different Farms Located near an Industrial Area. Animals, , v. 12, n. 19, [s.p] 2022. DOI: 10.3390/ani12192574. Switzerland
- FEIZI, Rozhan. et al. Determination and health risk assessment of heavy metals (Pb, Cd, Cu and Zn) in different brands of pasteurized milk. International Journal of Environmental Analytical Chemistry, Netherlands, [s.v], p. 1–12, 2020. ISSN: 0306-7319, DOI: 10.1080/03067319.2020.1817908.
- BOUDEBBOUZ, Ali. et al. Determination of heavy metal levels and health risk assessment of raw cow milk in guelma region, algeria. Biological trace element research, United States, v. 201, n. 4, p. 1704-1716, Apr. 2023. ISSN: 1559-0720, DOI: 10.1007/s12011-022-03308-1.
- CAPCAROVA, Marcela. et al. Levels of essential and xenobiotic elements and their relationships in milk available on the slovak market with the estimation of consumer exposure. Biological Trace Element Research, United States, v. 188, n. 2, p. 404–411, Mar. 2019. ISSN: 0163-4984, DOI: 10.1007/s12011-018-1424-9.
- YAO, Yao; WU, Hao; PING, Jianfeng. Simultaneous determination of Cd(II) and Pb(II) ions in honey and milk samples using a single-walled carbon nanohorns modified screen-printed electrochemical sensor. Food Chemistry, England, v. 274, p. 8–15, Feb. 2019. ISSN: 18737072, DOI: 10.1016/j.foodchem.2018.08.110.
- PALISOC, Shirley. et al. Electrochemical detection of lead and cadmium in UHT-processed milk using bismuth nanoparticles/Nafion®-modified pencil graphite electrode. Sensing and Bio-Sensing Research, Netherlands , v. 23, p. 100268, Jan. 2019. ISSN: 22141804, DOI: 10.1016/j.sbsr.2019.100268.
- KHALFAOUI, M. et al. New theoretical expressions for the five adsorption type isotherms classified by BET based on statistical physics treatment. Journal of Colloid and Interface Science, United States, v. 263, n. 2, p. 350–356, July 2003. ISSN: 00219797, DOI: 10.1016/S0021-9797(03)00139-5.
- HASAN, G. M. M. A.; KABIR, M. H.; MIAH, M. A. S. Determination of heavy metals in raw and pasteurized liquid milk of Bangladesh to assess the potential health risks. Food Research, United States of America, v. 6, n. 1, p. 233–237, Feb. 2022. ISSN: 25502166, DOI: 10.26656/fr.2017.6(1).191.
- PARVIZZAD, Kosar; SOROURADDIN, Saeed Mohammad; FARAJZADEH, Mir Ali. Preparation of a magnetic sorbent based on Tanacetum extract and its application in the extraction of Cu(II) and Pb(II) ions from milk performed in a narrow-bore tube followed by dispersive liquid–liquid microextraction. Journal of Food Composition and Analysis, United States, v. 112, p. 104654, Sep. 2022. ISSN: 08891575, DOI: 10.1016/j.jfca.2022.104654.
No competing interests reported.