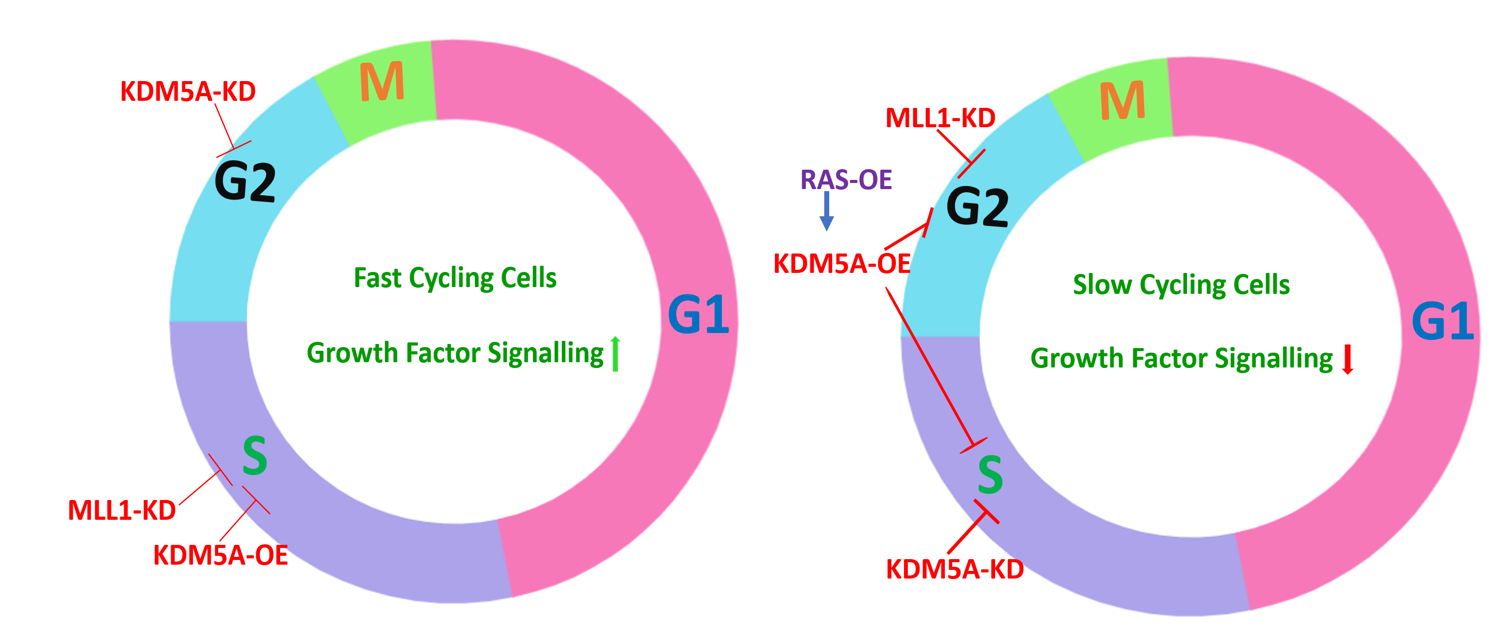
To understand the cell cycle distribution under KDM5A knockdown, overexpression and MLL1 knockdown conditions, we choose cervical (HeLa), Prostate (PC3) and Keratinocyte (HaCaT) cell lines. Following transfections and PI staining, we observed that in HeLa (Fig. 1a-b) and HaCaT (Fig. 1c-d) cell lines, KDM5A knockdown led to an increase in G2/M population compared to siControl, and KDM5A overexpression (KDM5A-OE) led to S-phase arrest. MLL1-knockdown (MLL1-KD) also led to S-phase arrest. From the cell cycle distributions, we understood that these observations are a consequence of global changes in H3K4me3 as siKDM5A would increase the active mark and render the chromatin in open configuration thereby influencing the G2/M phase transition, as normally chromatin compaction should commence at this stage and enhanced H3K4me3 hinders with this process. In KDM5A-OE and ML1-KD, as both these conditions reduce H3K4me3, an S-phase arrest was noted due to highly packaged DNA being rendered inaccessible for replication process in S-phase.
In PC3 cell line, although the effects were subtle but a reverse trend was observed, i.e., siKDM5A led to S-phase arrest and KDM5A-OE led to G2/M arrest (Fig. 1e-f). One difference between PC3 and the other two cell lines used is that PC3 is a slow growing cell line. So, to test whether a slow culturing HeLa cell would also exhibit similar cell cycle distribution, we serum starved HeLa cells to reduce their high proliferative ability and performed similar knockdown and overexpression experiments as mentioned above. To our surprise, serum starved HeLa cell cycle distribution (Fig. 2a-b) was similar to the PC3 distribution rather than normally cultured HeLa (10% FBS) cells. Serum starvation and siKDM5A treatment led to S-phase arrest instead of G2/M; whereas KDM5A overexpression and siMLL1 led to an increase in G2/M population instead of S-phase as observed in Fig. 1a-b.
Further, from earlier reports on KDM5B (a member of KDM family of demethylases) in melanoma cells, when the cells were serum starved, knockdown of KDM5B led to S- phase increase but when stimulated with different concentrations of FCS, a rise in G2/M population occurred as seen in our experiments. In line with this, when we assessed the expression of KDM5A at different serum concentrations, serum starvation (0% FBS) enhanced KDM5A but high percentage of FBS (20%) reduced KDM5A levels (Fig. 2c).From our observations so far and other literature, we hypothesized that an interplay exists between KDM5A and some factors of FBS. As growth factors are the major signaling molecules of FBS and can trigger the RTK signaling during cell cycle according to KEGG identifier 04110N pathway, we sought to assess the differences among growth factor signaling molecules. As we used different cell lines in the study which could be triggered by different growth factors and possess diverse receptors, we assessed the initial cytosolic effector molecules of RTK signaling and analyzed GRB1, SOS1 and RAS expression among cervical and prostate cancers using TGCA datasets.
We observed that GRB2 expression was marginally enhanced in cervical cancer patients but not in prostate cancer (Fig. 3), and SOS1 was downregulated in both (Fig. 3). As RAS proteins are most mutated among cancers, we assessed KRAS, NRAS and HRAS, and found that KRAS and NRAS were highly expressed in cervical cancer patients and in HeLa and HaCaT cell lines when compared to PC3 in which they were unaffected and less expressed (Fig. 4, a&b). Unlike KRAS and NRAS, HRAS was more expressed in PC3 cell line, and enhanced in both prostate and cervical cancer patients, but its expression was twice that of normal in cervical patients compared to PC3 where only marginal changed were noted (Fig. 4c).
Following the in-silico gene expression analysis, we speculated that although GRB2 and SOS1 were slightly upregulated (in cervical) or remained unregulated, but RAS proteins were highly expressed in HeLa and HaCaT compared to PC3, and might affect KDM5A expression or activity. From literature survey we noticed that many epigenetic markers are target to CDKs, and from our results we see that cells grown in serum starved conditions exhibited altered KDM5A or MLL1 functioning when compared to cells grown in 10% FBS, we hypothesized that RAS proteins might activate/enhance KDM5A enzymatic activity or reduce MLL1 methyltransferase activity downstream of MAPK signalling. To test our hypothesis, we overexpressed KRAS (Fig. 5a) and analyzed if RAS overexpression affects KDM5A expression. As shown in Fig. 5b, we traced that KRAS overexpression led to reduction in KDM5A protein. KDM5A protein content is reduced in enhanced RAS conditions, however, RAS might enhance the demethylase activity of the residual KDM5A.
To test whether RAS enhanced KDM5A demethylase activity, we overexpressed RAS in HaCaT cells and assessed the H3K4me3 levels as an indirect estimate of the demethylase function of KDM5A. We noted that RAS overexpression reduced H3K4me3 (Fig. 5c), supporting that RAS might activate/enhance KDM5A’s enzymatic function. Along this line, we also tested if inhibiting MAPK signalling enhanced H3K4me3 levels. Using U0126 (MEK inhibitor) in HaCaT cells, we analysed the levels of the writer (MLL2) and the modification and observed that both were increased (Fig. 5d). From this, we concluded that reduced MAPK signalling activates MLLs function thereby increasing H3K4me3, and increased MAPK activity increases KDM5A’s demethylase function thereby reducing H3K4me3.
As we have observed that RAS overexpression reduced H3K4me3, we tested whether transfection of both RAS and KDM5A together in serum starved HeLa and HaCaT cells would enhance KDM5A’s demethylase activity and enhance cell population in S-phase instead of G2/M as observed in Fig. 2. So, when this double transfection was performed, an increase in S-phase population was noted when compared to KDM5A and RAS transfection alone (Fig. 6, a-d). Further, in PC3 cells which exhibit low RAS proteins and KDM5A expression in normal conditions (10% FBS) led to G2/M arrest, RAS and KDM5A double transfection led to increase in S-phase cells (Fig. 6e&f), proving that KDM5A activity was monitored by RAS or the downstream signalling molecules and global H3K4me3 status dictated by KDM5/MLL ratio was responsible for the changes observed in this study.