3.1. Plaque and salivary microbiome
3.1.1. Sequences Information and Bacterial Diversity
All the samples were divided into four groups. After 454 pyrosequencing, a total of 415,203 16S rRNA sequences were obtained from 40 samples, 20 from plaque and 20 from saliva, and 328486 high-quality sequences (79%) passed the quality-control test. The mean sequence length was 476 bp, with an average sequencing depth of 6,347 reads per sample. All the qualified sequences (≥ 97% similarity level), were compared to the SILVA database (version10.6) using Mothur software (version 1.31.2) and the reads were clustered into 14,076 operational taxonomic units (OTUs) including 6,042 OTUs from caries plaque, 6,757 OTUs from caries-free plaque, 5,406 OTUs from caries saliva, and 5,561 OTUs from caries-free saliva (Table 1).
The indices of Shannon, Simpson, Chao, and ACE were calculated to obtain the bacterial richness and diversity; the Good’s coverage reflects the sequencing depth. The oral microbial diversity parameters are shown in Table 2; there was no significant difference in the richness and diversity of the bacterial communities between caries and caries-free group(P> 0.05). The Good’s coverage for each group was over 95%, indicating adequate sequencing depth.
Table 1. Statistics of the Microbial Number in Plaque and Saliva From Several Taxonomic Levels
|
|
PH
|
PN
|
SH
|
SN
|
|
phylum
|
13
|
15
|
12
|
14
|
|
class
|
20
|
23
|
20
|
21
|
|
order
|
33
|
35
|
35
|
36
|
|
family
|
50
|
52
|
62
|
54
|
|
genus
|
82
|
90
|
105
|
97
|
|
OTU(0.03)
|
6042
|
6757
|
5406
|
5661
|
Table 2. Community Richness Estimator and Diversity Estimator of Every Group
|
|
PH
|
PN
|
SH
|
SN
|
|
ACE(0.03)
|
18587
(18044,19155)
|
20059
(19502,20641)
|
14641
(14189,15117)
|
16707
(16198,17241)
|
|
Chao(0.03)
|
12126
(11549,12764)
|
12813
(12273,13406)
|
10159
(9686,10685)
|
10919
(10410,11482)
|
|
Shannon(0.03)
|
6.74
(6.73,6.75)
|
6.8
(6.78,6.82)
|
6.53
( (6.51,6.54)
|
6.54
6.53,6.56)
|
|
Simpson(0.03)
|
0.0038
(0.0037,0.0039)
|
0.0034
(0.0033,0.0035)
|
0.0049
(0.0049,0.005)
|
0.0045
(0.0044,0.0046)
|
|
Coverage(0.03)
|
0.951656
|
0.964732
|
0.959671
|
0.958081
|
3.1.2. Bacterial Community Structure and Composition in Different Niches
A total of 18 phyla, 28 classes, 48 orders, 78 families,135 genera, and 410 species were detected in the 40 samples analyzed. Overall, the six most abundant phyla were Firmicutes (33.66%), Bacteroidetes(23.61%), Fusobacteria(19.83%), Proteobacteria(12.89%), Actinobacteria(6.85%), and Candidate division TM7(2%). Together, they represent 98.84% of the total sequences. The reads were dominated by 13 genera including Streptococcus (17.86%), Leptotrichia (14.60%), Prevotella (9.99%), Neisseria (7.51%), Porphyromonas (5.47%), Fusobacterium (5.12%), Capnocytophaga (5.10%), Veillonella (2.86%), Actinomyces (2.79%), Gemella (2.20%), Granulicatella (2.17%), Johnsonella (2.09%), and Derxia (2. 06%). They occupied 79.84% of the whole. Figure 1a and Figure 1b shows the taxonomic distributions of the predominant bacteria at the phyla and genera levels. The relative abundance between caries-active and caries-free subjects were compared using the Wilcoxon rank-sum test. The significant difference was detected among four group(additional Table3 and additional Table4).A higher abundance(relative abundance >1%)of Porphyromonas was detected in the SN group(P=0.04396) and Derxia in the SH group(0.04493). A higher abundance (relative abundance >1%)of Capnocytophaga was observed in the PN group than PH group(P=0.01898)(Fig.2)
To explore the relationship of the bacterial-community, a circular phylogenetic tree from 133 genera was constructed (Fig. 3). The relative abundance in caries-free and caries group, as well as the community composition at the genus level, could be observed in the Heatmap (Fig. 4), in which we could find that the predominant microbial communities were largely similar, but the variety of individual microorganism is apparent among the four groups.
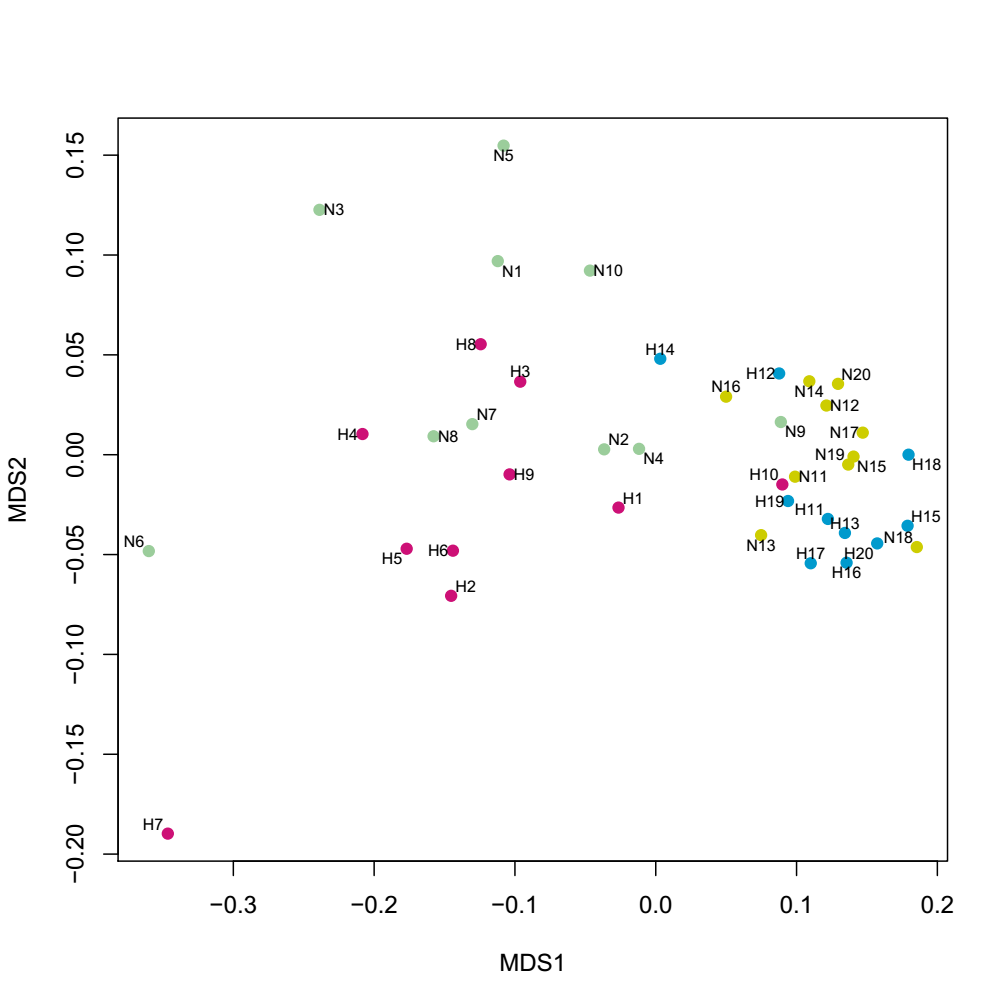
The analysis of similarities (ANOSIM) was performed to compare similarities and dissimilarities in the bacterial community structures among the four groups. The principal coordinates analysis (PCoA), based on the Bray-Curtis distances, demonstrated segregations between samples from dental plaque and saliva. As shown in Figure 5, the microbiota from the SN group overlapped with SH, so as PN and PH groups. A clear difference can be observed within the saliva and the plaque samples. The PCoA result indicated that the oral microbial community compositions are similar between caries-active patients and healthy controls; nevertheless, there were some dissimilarities in two different niches. These differences were also observed using the nonmetric multidimensional scaling (NMDS) analysis (Additional Fig.1).
The LEfSe analysis was performed to represent differences in the bacterial community composition among the four groups, and their effect sizes were represented in a taxonomic tree. Figure 6a shows cladograms representing the microbial community with significant differences at different levels. Significant differences detected in the PH group were Dialister and Selenomonas at the genus level. Capnocytophaga (belonging to class Flavobacteria, order Flavobacteriales, family Flavobacteriaceae), Fusobacterium (belonging to family Fusobacteriaceae), and Desulfuromonadales_g_unclassified (belonging to order Desulfuromonadales) exhibited relatively higher abundance in the PN group. As for the saliva group, Actinomyces and Mogibacterium were significantly enriched in the SH group, while the relative abundance of Haemophilus and Porphyromonas was higher in the SN group (LDA > 2, P<0.05). Figure 6b shows the LDA score representing the impact of differential features among groups.
3.1.3. The Core Microbiome
A Venn diagram was used to display the core microbiome, the overlapping areas in the circles stand for the members shared among the four groups in each taxonomical level. The oral microbiome analysis revealed an overlap of shared OUTs and genera. As the Venn diagram shows (Fig.7a,7b); 14076 OTUs were identified including 5406, 6042, 5661, and 6757 OTUs in the SH, PH, SN and PN groups, respectively. A total of 1328 OTUs and 71 genera were common among the four groups, occupying 9.4% of all the OTUs (14076 OTUs), and 52.6% of all the genera (135 genera) detected. We detected 18 predominant genera uniform in the samples from saliva and plaque subjects including Abiotrophia, Actinomyces, Bergeyella, Campylobacter, Capnocytophaga, Corynebacterium, Derxia, Fusobacterium, Gemella, Granulicatella, Johnsonella, Neisseria, Porphyromonas, Prevotella, Propionibacterium, Streptococcus, Veillonella, and Ruminococcaceae uncultured. This shared microbiome supports the existence of an “oral core microbiome” and this shared genera may be part of the oral core microbiome in the dental plaque and saliva of caries from patient and healthy controls.
3.2. Differentially Expressed Proteins Related to Dental Caries and Its Functional Classification
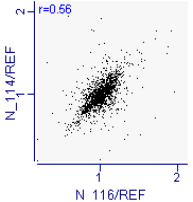
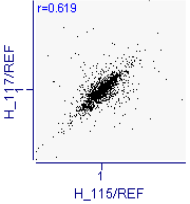
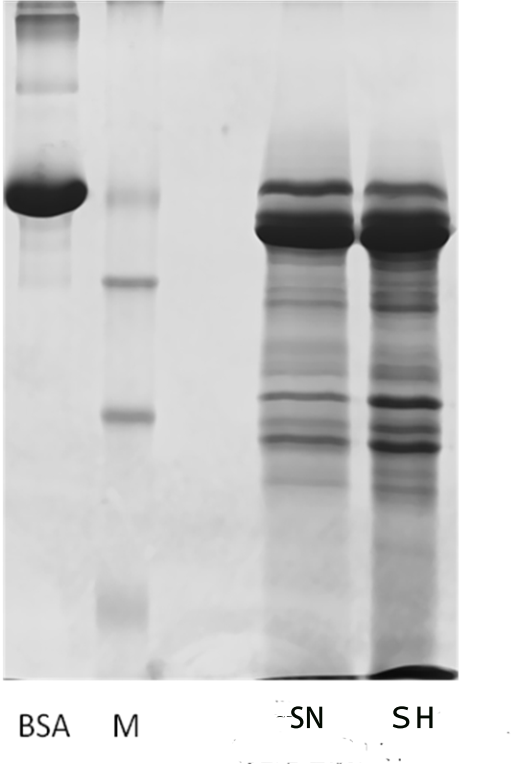
Proteomic analysis of saliva samples was performed using the iTRAQ-coupled LC-MS/MS method to detect protein biomarkers of caries risk in children. Two saliva samples from the SN (caries-free saliva group, n=10) and SH (caries-active saliva group, n=10) were used for this study. The protein bands of the saliva samples from subjects with and without caries were not entirely consistent with SDS-PAGE electrophoresis (Additional Fig.2), indicating the existence of differentially expressed salivary protein between healthy and cariogenic children. The salivary protein samples from the SN and SH groups were also used (90 μg for each group) for the iTRAQ analysis. After querying the database, a total of 9135 unique peptides and 1662 proteins group (unique peptides ≥ 1) were identified, including 1626 proteins with quantitative information (Additional file1). Pearson correlation between each experimental group and its replicate showed good reproducibility (Appendix Fig.3a,3b). We found 258 proteins to be differentially expressed according to the criteria of P-value < 0.05 and ratio- fold change > 1.2. Some differential expressed proteins between caries and healthy saliva were listed in the additional Table5.
Gene ontology analysis was performed to explore the biological function of the differentially expressed proteins base on their biological processes, molecular function, and cellular components. The proteins involved in the metabolic process (16.91%), regulation of biological process (12.99%), and response to the stimulus (12.54%) were enriched in the SH group compared with healthy controls (Figure. 8a). The majority of differentially expressed proteins were found in the cytoplasm (17.05%), extracellular (14.26%), and membrane (13.77%) (Figure. 8b). GO analysis showed that proteins involved in the protein binding (35.76%) and catalytic activity (16.94%) were enriched in SH group (Figure.8c).