3.1. GR/DT/RHOB Cross-Plot:
This analysis concerns the Upper TAGS in well14 and well15. The confrontation of GR and DT in cross-plot (X and Y axis) with RHOB in color scale (Z axis) has showed three zones (A, B and C) (Figure-5). Each zone can be interpreted as below:
Zone A: It represents the zone of clean sandstones (devoid of clays) which are practically absent or extremely rare. Usually, the response of sonic (DT) in front of clean sandstone is low (DT = 56 µs/f) where its density (RHOB) is around of 2.64 g/cc. Sandstone gamma ray (GR) is generally less than 40 API.
Zone B: This zone shows acceptable GR values for clayey sandstones (GR < 50 API). DT varies between 57µs/f and 77µs/f. The density (RHOB) varies between 2.60 and 2.61 g/cc.
Zone C: Compared to normal petrophysical properties of sandstones, the GR and the DT of this zone are considered very high. Density values are close in the two wells (small red squares). Mazouz (2017) interprets this zone by illite-rich sandstone.
3.2. Saturation log:
Figure-6 shows the saturation log (from PDK-100 tool) for Well8. In this log (Track5), the considerable value of Sigma main (= total Sigma) explains a significant concentration of chlorine and consequently of salt in the sandstone matrix (Sonatrach, 2002b).
Normal responses (Sigma clay = 35 cu, Sigma matrix sandstone = 12 cu) are observed below 2954 m, but above this depth, Sigma main increases and turns around 40 cu which is abnormal.
Figure-6
Saturation log (from PDK-100 tool) (Well8) showing increased value of Sigma main (Track 5) (Modified f
3.3. RCI Log:
Results of pressure test logging (Table-1) show low mobility in many tested points at the top of TAGS (bold character in Table-1). Reservoir permeability is closely related to fluid mobility which is equivalent to permeability over viscosity (MilliDarcy/CentiPoise). Fluid circulation in reservoir rock is disturbed by the cementation degree of rock grains (certainly halite cement); this can explain decreasing of permeability in top of TAGS.
| Depth ( m ) | Mobility (Md/cp) | Remarks |
| 2 887,60 | 0,50 | Tight reservoir |
| 2 890,50 | 0,40 | Tight reservoir |
| 2 897,00 | 3,20 | Low permeability |
| 2 899,80 | 2,30 | Low permeability |
| 2 909,00 | 58,20 | Good test |
| 2 910,20 | 18,20 | Good test |
| 2 916,50 | 89,60 | Good test |
| 2 917,40 | 4,50 | Low permeability |
| 2 921,30 | 12,30 | Good test |
| 2 927,00 | 23,00 | Good test |
| 2 934,20 | 32,10 | Good test |
| 2 945,10 | 24,60 | Good test |
| 2 946,20 | 302,60 | Good test |
| 2 947,20 | 28,90 | Good test |
Table-1: Pressure test results from RCI logging tool, TAGS reservoir (Well7)
3.4. Core lab measurements:
Comparatively with the rest of TAGS interval, above 2894m, Figure-7 shows very low values of core porosity (Phi_core) and core permeability (K_core).
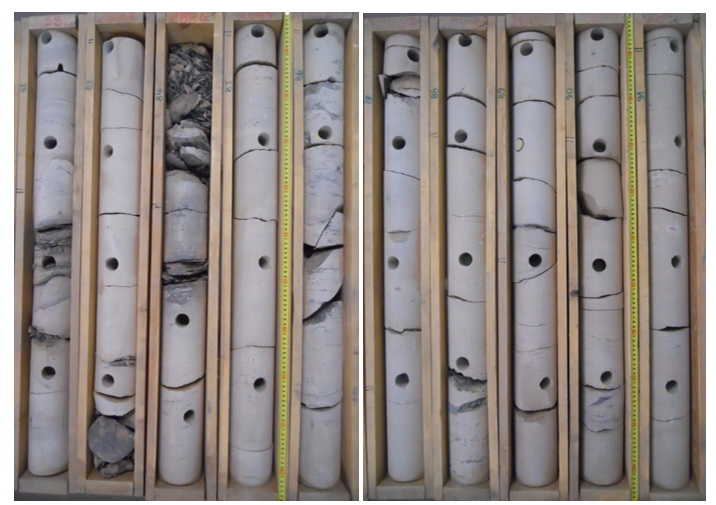
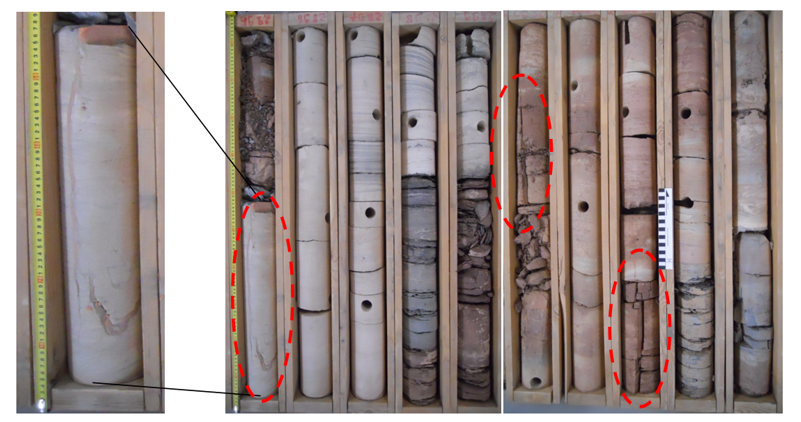
3.5. Cores observation:
In photo-1 we can observe a compact sandstone mentioned as hard to very hard in core-log description of Well9 (Sonatrach/GTL, 2002).
A high rate of reddish salt (Halite) is observed macroscopically filling a long fracture in Well7 (Photo-2). It cannot be confused to sulfates (anhydrite or gypsum) because it tastes salty.
3.6. Closest salty formations to TAGS reservoir.
TAGS formation as reservoir is upper-sealed first by “Lias argileux” (French translation of Shaly Liassic) with average of 30m in Toual field. Secondarily we find the “Lias salifère” (French translation of Salty Liassic) overlaying the “Lias argileux” with more than 300m of evaporatic facies, mainly salt (Halite) interbedded with some anhydrite and gypsum layers (Figs. 3 & 8).