Study Design
This study retrospectively assessed peripheral blood samples that were banked from advanced NSCLC patients while on targeted molecular or immunotherapy. Patients had ~ 4 mL plasma collected immediately prior to treatment initiation (baseline), after 3 months, 6 months, 12 months, and at the time of disease progression when available. The main objectives of this study were to detect and measure oncogenic driver alterations in plasma, monitor ctDNA dynamics during therapy, and correlate these changes with clinical outcomes.
Dynamic changes in ctDNA were assessed by allele frequency of individual driver alteration and MMPM. We defined variant allele frequency change as the driver oncogene variant allele change from initial first collection and second collection. The MMPM level was quantified by summing the allele frequency of each variant detected and normalizing to the total amount of input circulating free DNA (cfDNA). The greatest MMPM clearance was defined as the change between the lowest MMPM score on serial sampling compared to baseline MMPM. Clinical endpoints included the best radiographic response and the time to treatment failure (TTF). Radiographic response was assessed using RECIST v1.1 criteria. Time to treatment failure was defined as the time-period from treatment initiation to treatment discontinuation or the addition of new therapy.
Patient and Sample Characteristics
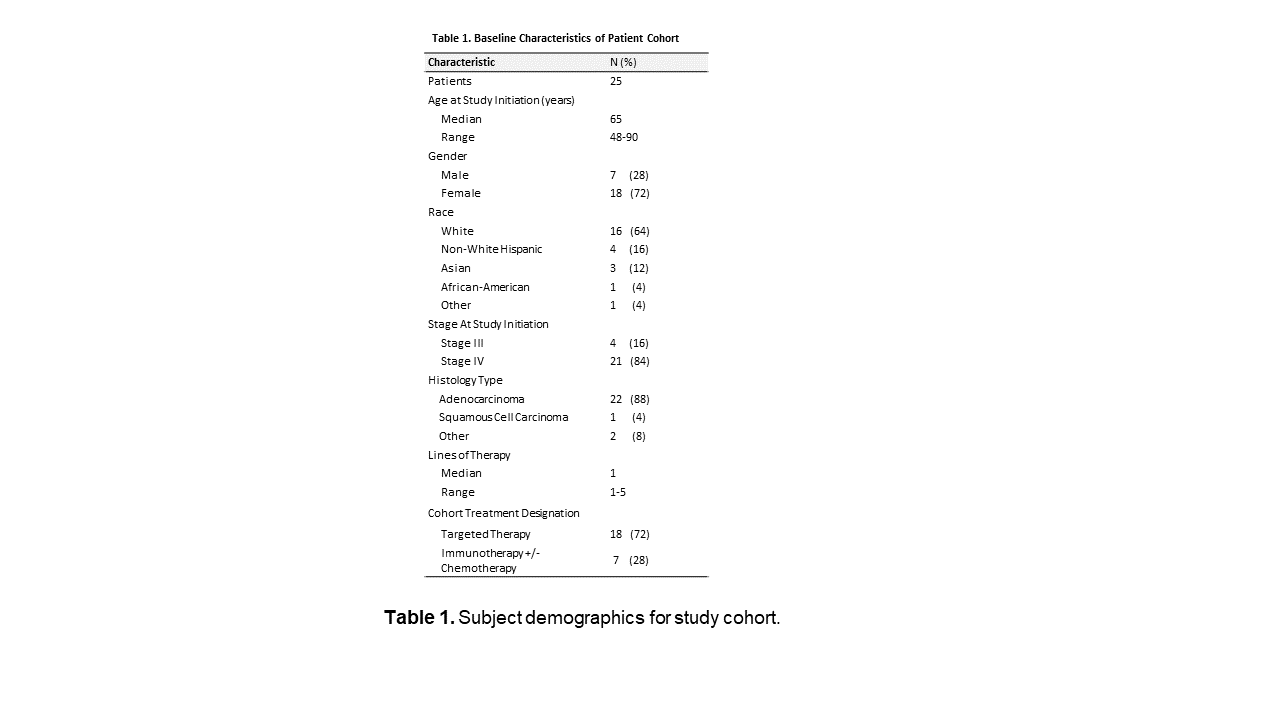
The study cohort (n = 25) included subjects with locally advanced or metastatic NSCLC undergoing treatment with either targeted therapy (n = 18; 15 with EGFR, 2 with ALK, 1 with ERBB2) and immunotherapy (n = 7). Clinical and pathological characteristics for all patients are summarized in Table 1. Patient enrollment and genomic studies were approved by the Institutional Review Board (IRB). Patients provided written informed consent of sample acquisition for research purposes and correlation with clinical outcome.
For all patients, serial blood draws were collected over the course of treatment and isolation of plasma was performed at the University of California, San Diego. Extraction of cfDNA from plasma and genomic DNA from plasma-depleted whole blood for genomic analyses were performed at Signature Diagnostics GmbH (Roche Diagnostics Potsdam). To analyze changes in cfDNA and capture the clonal heterogeneity of metastatic disease, we analyzed sequence changes. DNA from PBMC was sequenced to subtract variants of clonal hematopoiesis of indeterminate significance and germline single-nucleotide polymorphisms (SNP).
Sample Preparation and Sequencing
A total of 125 (N = 125) plasma and 25 (N = 25) PBMC samples from 25 subjects were processed and 2-5ml of plasma from each timepoint and 500 ul of buffy coat was analyzed. The DNA was extracted and libraries were prepared using AVENIO ctDNA Surveillance Kit (Roche, Research Use Only). AVENIO surveillance kit is a research use only assay, which leverages a ~ 200 kb targeted panel, covering 471 frequently mutated regions across 197 genes for detection of SNVs, indels, rearrangements and copy number amplifications relevant in lung and colorectal cancer.
The AVENIO ctDNA Analysis Kit was used to allow preparation of sequencing-ready libraries from DNA isolated from plasma. The DNA input amount for each sample was adjusted on the basis of DNA quality and size distribution (q-ratio). After quality control (QC) of the enriched libraries, the samples were pooled and sequenced with the Illumina NextSeq 500/NextSeq Dx 550 (RUO mode) instrument. Pools of 8 sequencing-ready libraries were created and sequenced as one multiplexed pool per run on NextSeq 500 (Illumina, San Diego, CA, USA) using a High Output Kit (Illumina, San Diego, CA, USA) with paired-end sequencing (151-cycles). PhiX DNA was spiked into the multiplexed sequencing pools as a quality control for sequencing fidelity. The concentration of the pooled library was quantified using the Qubit dsDNA High Sensitivity (HS) Assay Kit (Thermo Fisher Scientific, Q32854) according to the manufacturer’s instructions. The size distribution of the pool was assessed by diluting the pool to 1–5 ng/µL range and analyzing on a 4200 TapeStation system (Agilent Technologies, G2991BA) with a High Sensitivity DNA Kit (Agilent Technologies, 5067) following the manufacturer’s instructions.
Data analysis of Next-Generation Sequencing data and variant calling
Sequencing data was analyzed by using the AVENIO Oncology Analysis Software (OAS, Version 2.0.0; Roche, Research Use Only) to generate a variant report and key sequencing metrics such as sequencing depth, on-target rate, coverage uniformity, number of reads and error rate to ensure quality across different stages of the workflow. OAS filters were set to keep known somatic variants including variants seen in COSMIC (Catalogue of Somatic Mutations in Cancer) and TCGA (The Cancer Genome Atlas) databases, and variants in the Loci of Interest (LOI) list, and removed known germline variants which included variants in ExAC (Exome Aggregation Consortium) or 1000 Genomes databases with allele frequency (AF) > 0.1%, or in dbSNP (Single Nucleotide Polymorphism database) database. Identification of variants in plasma-derived cfDNA and somatic variants in cfDNA were derived by filtering out predicted germline variants.
The monitoring module of the AVENIO OAS v2.0.0 software was used to determine whether the mAF of a given set of variants was significantly higher than background noise11. Plasma samples with variations significantly higher than background were considered to be ctDNA-positive, otherwise ctDNA-negative. CHIP detection used germline variant calls with AFs ranging from LOD to 15% and compared to the cfDNA calls using the monitoring module of the AVENIO OAS server.
For mutational profiling, Roche NAVIFY Mutational Profiler (NMP, Roche, Santa Clara, US, Research Use Only) was used for tertiary analysis i.e. annotation of detected variants including resistance mutations. References to the gene list for the AVENIO ctDNA Analysis Kit are provided in the supplemental data. Variants were detected down to a lower threshold of 0.1%. The analytic performance is supported by integrated digital error suppression (iDES) strategies combining molecular barcodes with in silico error suppression techniques11.