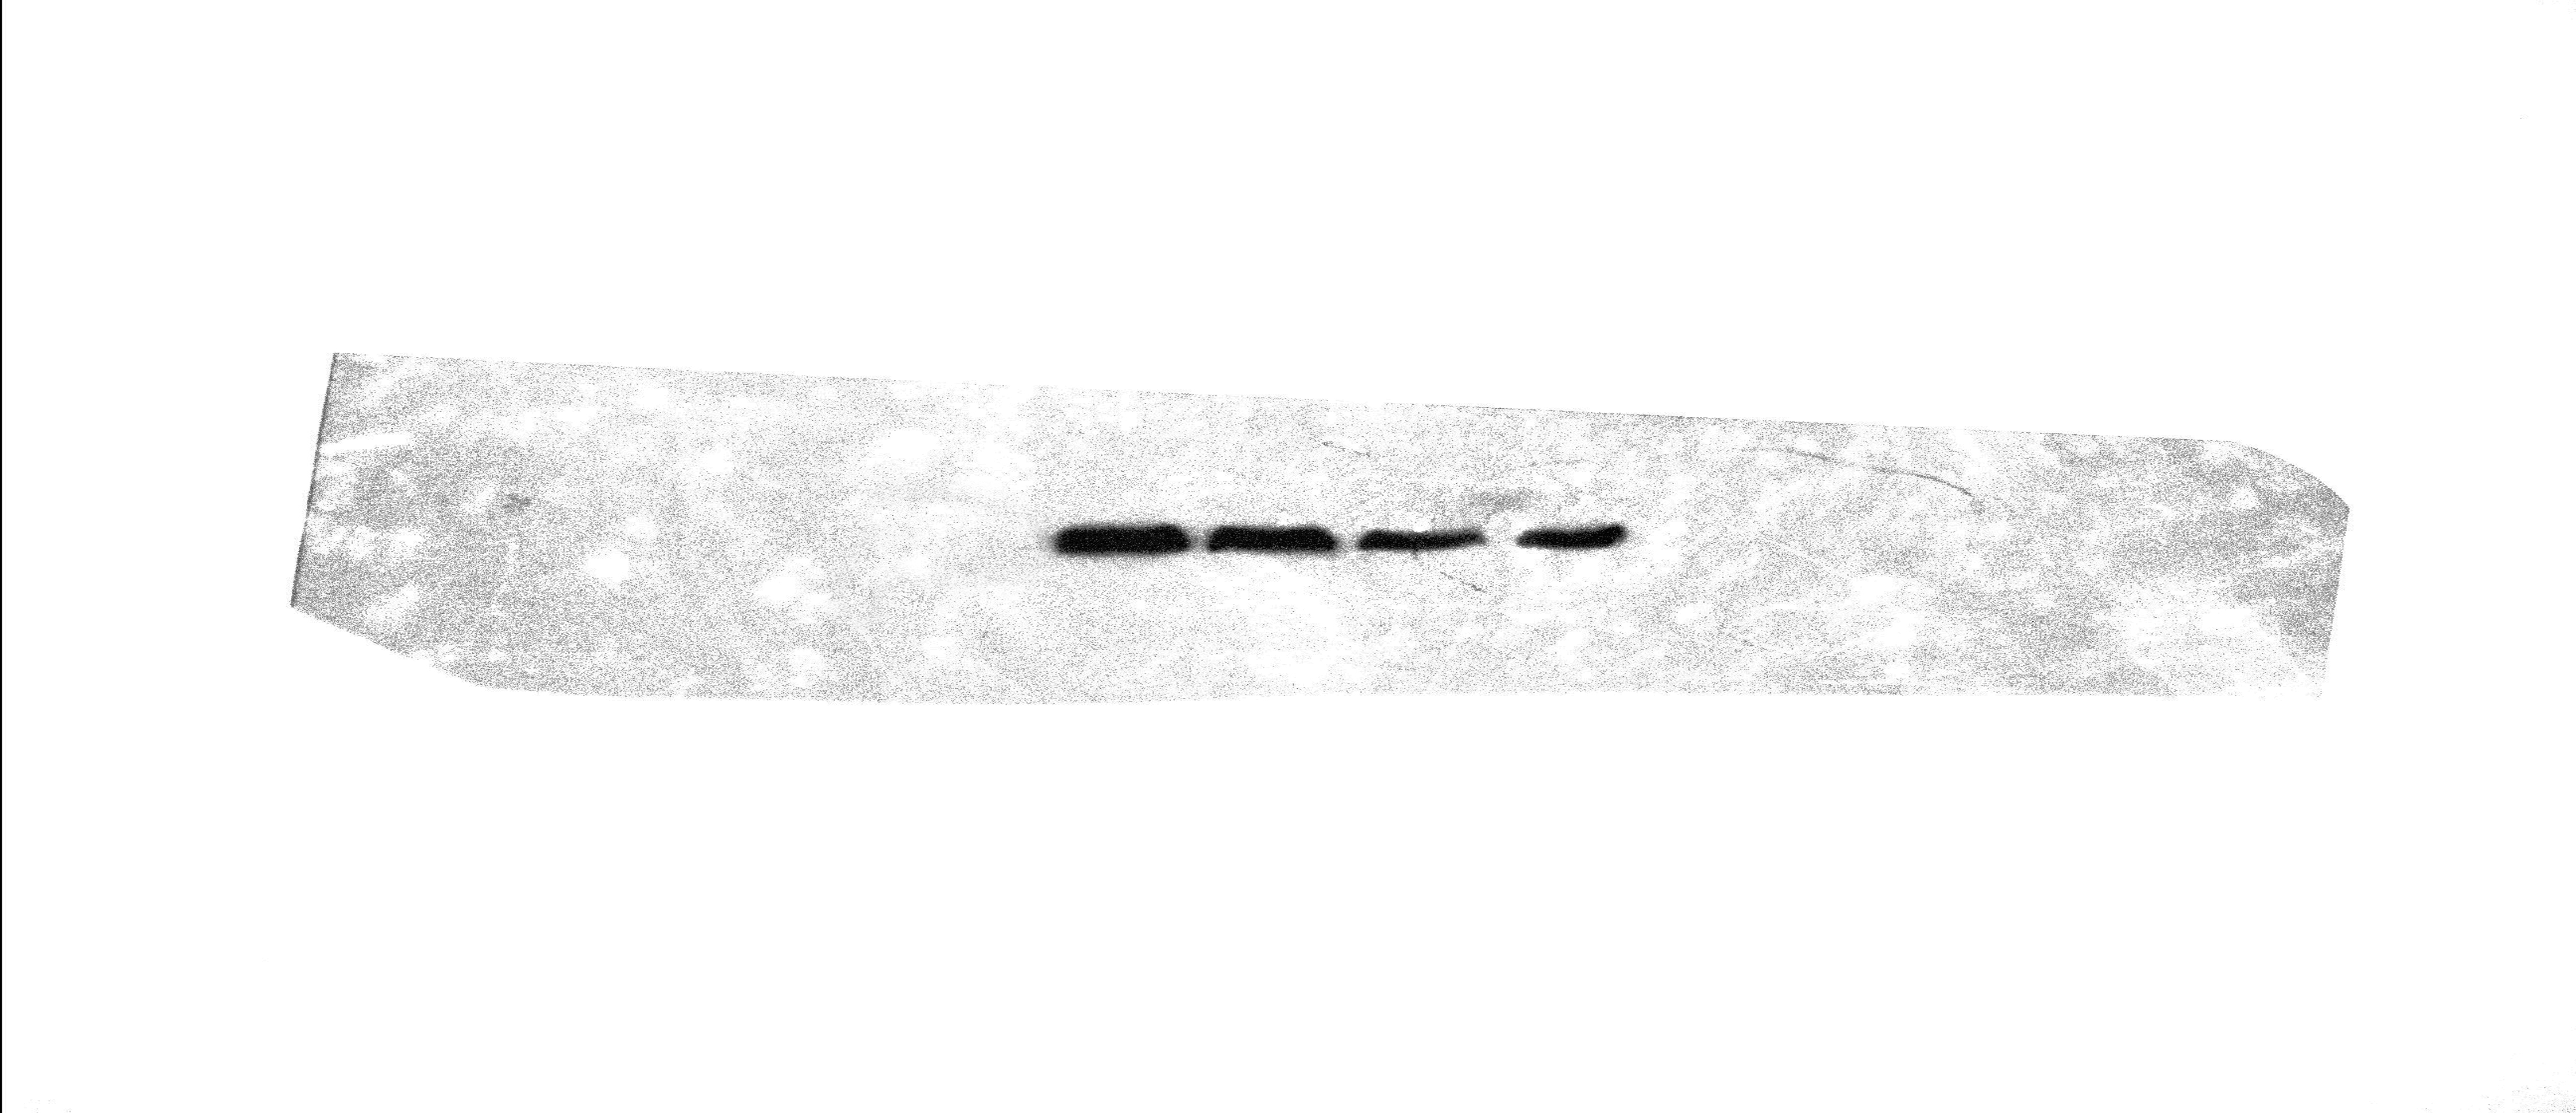
Expressions of STIP1 and Hsp90 in A549 cells are higher than that in 16HBE cells
A Western blot method was used to determine the expressions of STIP1 and Hsp90 in A549 and 16HBE cells, we found that the expressions of STIP1 and Hsp90 in A549 cells were higher than that in 16HBE cells (Fig. 1A). Quantitative analysis suggested that the expressions of STIP1 (0.88 ± 0.17) and Hsp90 (0.79 ± 0.27) in the A549 cells were higher than that in 16HBE (0.46 ± 0.13 for STIP1; 0.52 ± 0.19 for Hsp90, P< 0.001) (Fig. 1B).
Expressions of STIP1 and Hsp90 in LAC tissues are higher than that in cancer-adjacent normal lung tissues
The semi-quantification analysis of IHC for STIP1 (14 samples were scored as 0 point; 17 as 1 point; 42 as 2 points) and Hsp90 (16 samples were scored as 0 point; 14 as 1 point; 43 as 2 points) were performed. The results showed that the expression rate of STIP1 in cancer-adjacent normal tissues was 21.9% (16/73) and in LAC tissues 57.7% (42/73), showing that the expression of STIP1 in LAC was higher than that in non-cancerous lung tissues (P < 0.001) (Table 2; Fig. 1C; Fig. 2A - 2D). The expression of Hsp90 also showed a significant increase in LAC tissues (43/73; 68.9%), compared with cancer-adjacent normal tissues (24/73; 32.9%) (P = 0.002) (Table 2; Fig. 1D; Fig. 2E - 2H).
Expression of STIP1 is associated with poor differentiation, lymph node metastasis and advanced stage of LAC
Compared with well differentiation (6/19; 31.6%), no-lymph node metastasis (3/28; 9.6%) and early stage (16/45; 33.3%), the STIP1 was highly expressed in LAC tissues with poor differentiation (24/32; 75%) (P = 0.019), lymph node metastasis (39/42; 92.9%) (P < 0.001), and advanced stage (26/28; 92.8%) (P = 0.002), suggesting that the elevated STIP1 was associated with malignant biological behavior of LAC (Table 3; Fig. 3A - 3C).
Expression of Hsp90 is associated with lymph node metastasis and advanced stage of LAC
A higher expression of Hsp90 was observed in lymph node metastasis (37/42; 88.1%) (P < 0.001) and advanced LAC tissues (24/28; 85.7%) (P < 0.001) compared to no-lymph node metastasis (6/31; 19.4%) and early stage of LAC (9/45; 42.2%), suggesting that the increased Hsp90 was associated with metastasis and progression of LAC (Table 4; Fig. 3D - 3F).
Expressions of STIP1 and H sp90 in LAC showed a strong positive correlation
The STIP1 and Hsp90 had a positive co-expression rate of 38.4% (28/73) and a co-negative rate of 54.8% (40/73). The Pearson correlation coefficient was 0.86 (P < 0.001) and the Spearman correlation coefficient was 0.86 (P < 0.001), which indicated that there was a significant positive correlation between the expressions of STIP1 and Hsp90. The Kappa value was 0.859 (P < 0.001), indicating that there was a consistent trend between their expressions.
Expressions of STIP1 and Hsp90 are negatively correlated with the survival of LAC patients
As shown in Table 5, compared with patients with negative STIP1 (49.93 ± 13.61 months; 95% CI = 42.92 - 52.89), LAC patients with positive STIP1 (35.50 ± 11.89 months; 95% CI = 31.78 – 39.23) had a shorter survival (Log Rank, P < 0.01; Breslow, P < 0.01) (Fig. 4A and B). In addition, the survival of LAC patients with positive Hsp90 (36.61 ± 13.63 months; 95% CI = 32.56 – 40.64) was shorter than those with negative expression of Hsp90 (49.74 ± 13.22 months; 95% CI = 41.79 - 51.67) (Log Rank, P < 0.01; Breslow, P < 0.01) (Fig. 4C and D).
Multiple regression analysis of clinical parameters and overall survival of patients with LAC
As shown in Table 6, a total of 8 parameters were included in the analysis, including gender, age, smoking or not, degree of tissue differentiation, lymph node metastasis, TNM staging, and the expressions of STIP1 and Hsp90. Finally, three parameters, TNM staging (P value = 0.007; OR value = 2.876; 95% CI = 1.393 – 6.698), STIP1 (P value = 0.001; OR value = 9.532; 95% CI = 2.317 – 39.33) and Hsp90 (P value = 0.008; OR value = 3.597; 95% CI = 1.282 – 10.176), were included in the regression equation. The results suggested that the TNM staging and the expressions of STIP1 and Hsp90 were risk factors for shortening the survival of patients with LAC and the regression equation based on COX regression was H(t)=[h0(t)]e(1.607 X6 + 2.242 X7 + 1.301 X8).