3.1 Characterization of the MgAl-LDH colloid/layered crystals
The nitrate-intercalated MgAl-LDH with an ideal composition Mg2Al(OH)6NO3·H2O (Mg/Al = 2) was synthesized using a simple co-precipitation method [41] (96% yield):
2Mg(NO)·6HO + Al(NO)·9HO + 6NaOH
→ [Mg2Al(OH)6]NO3(s) + 6NaNO3(aq) + 21H2O(l) (1)
It is known that several molecules such as acetone [42], glycine [43], N,N-dimethylformamide [40] and formamide [40] can be adsorbed on the surfaces of LDH with a medium adsorption energy [44]. They can also efficiently weaken the electrostatic attractions between the LDH layers and intercalated ions to separate the stacked layers successfully. After dispersing the as-prepared MgAl-LDH crystals in aqueous formamide, the positively charged nanosheets [Mg2Al(OH)6]+ are obtained according to Eq. (2), and the process is depicted in Fig. 1a.
[Mg2Al(OH)6]NO3(s) + HCONH2 (aq) → [Mg2Al(OH)6]+(aq) + HNO3(aq) + HCONH¯(aq) (2)
The obtained colloid (Fig. 1b) contains the dispersed MgAl-LDH NS, exhibiting the Tyndall effect typical of colloids when the laser was shined through. It was first assumed from the observation of colloidal state of materials that the size of the MgAl-LDH NS is 10-1000 nm, similar to that in the literature [40]. The colloidal suspension exhibited the absorption characteristics with maximum absorption at wavelength (\({\lambda }_{max}\)) of 205 nm, nicely agree with the references [45, 46]. The energy gap (Eg) can be calculated following the Tuac’s relation according to Eq. (3),
(𝛼h𝜈)𝛾 = A(h𝜈 − 𝐸𝑔) (3)
where 𝛼, h, 𝜈, 𝛾, 𝐸𝑔 and A indicate the absorption coefficient, Planck’s constant, light frequency, indirect band gap value (𝛾=2), band gap energy, and proportionality constant of light, respectively [47]. By using the linear extrapolation method with Tuac’s plot (the plot between (𝛼h𝜈)2 and h𝜈, later), Eg of 5.7 eV was obtained, similar to that in Mantilla et al [48] and Xu et al [49]. Then, the morphology of MgAl-LDH NS was studied by SEM (Fig. 1c), showing sheets with thickness of ~ 300 nm as determined by ImageJ software. This is further supported by TEM (Fig. 1d) showing thin, flat, uniform sheets of MgAl-LDH NS with the average lateral dimension of 59.03 ± 5.31 nm.
We also characterize the starting, parent-layered crystals of nitrate-intercalated MgAl-LDH by ATR (Fig. 1(e)). The bands at 3,550 cm− 1 and 1,656 cm− 1 correspond to the stretching vibration and bending vibration, respectively, of hydroxyl (O-H) groups in brucite-like layers and absorbed water molecules at interlamellar space alike [50]. The peak at 1,382 cm− 1 is the stretching vibration of intercalated nitrate ion, and the bands at 649/963 cm− 1 are attributed to Mg-O/Al-O lattice vibrations. Similar results for the functional group were obtained in the literature [51]. Figure 1f shows the XRD pattern of the MgAl-LDH, exhibiting the (003), (006), (012), (015), (018), and (110) reflections typical of the hydrotalcite structure [52]. This is explained by the hexagonal crystal structure with the shortest cation-cation distance of a and the three-layer rhombohedral (3R) polytype of c. Each of those 3R layers (c/3) basically consists of a brucite-like layer together with an intercalated anion layer [53]. The Rietveld refinement of MgAl-LDH crystals (vs CIF #2102792) shows good fitting parameters within the Rp = 2.47, wRp = 3.59, and GOF = 1.52. No secondary phase was identified, suggesting it content (if any) is probably less than the ~ 5 wt%.
The refined unit cell parameters were estimated using a Bragg-type evaluation from the peak-profile analysis, which was found to be a = b = 3.0481 ± 0.0003 ºA and c = 23.3973 ± 0.0070 ºA. The d003 spacing of MgAl-LDH is 7.79 Å, confirming the intercalation of the NO3− anions [54] (vs ~ 7.5–7.6 in [55]). In addition, the broad (003) and (006) reflections indicate the nanocrystalline nature with the average crystallite size of 66.3 ± 6.7 nm (calculated using Scheerer equation). Altogether, the successful synthesis of the MgAl-LDH layered crystals (Fig. 1(g) and (i)) and the subsequent exfoliation to nanosheets can be deduced.
3.2 Characterization of the BC/MgAl-LDH NS composite films
Various contents of MgAl-LDH (%v/v) were loaded into the BC matrix and the mixture was cast into the film. As illustrated in Fig. 2a, the composited film can be rolled and folded while also reverting back to its original shape even at 1.5% v/v loading. The ATR-IR spectra of the BC/MgAl-LDH composites at 0.5, 1, 1.5, 3, and 5%v/v compared to the pristine BC and the MgAl-LDH layered crystals are depicted in Fig. 2b. They all show the characteristic vibrations of BC without those of the MgAl-LDH, suggesting high dispersion of the latter (or its relatively low content). BC is a polysaccharide composed of linear chains of β-linked D-glucose units. The vibrations at 3,348 cm− 1 and 1,649 cm− 1 correspond to the stretching (\(v\) O-H) and bending (\(\delta\) O-H) vibrations, respectively, of the OH group. The peaks at 2,900 cm− 1/1,420 cm− 1 are due to the C-H stretching/bending vibrations within its skeleton. The peaks at ∼1,190, 1,136, and 1,105 cm− 1 indicate the C-O and C-O-C stretching vibration (\(v\) C-O-C) at the ring typical of the β-1,4-glycocidic bonds. All of the IR peaks are consistent with those in the literature [56]. The XRD patterns (Fig. 2c) show three reflections (\(\stackrel{-}{1}\)10), (110) and (200) typically found in BC (consistent with JCPDS #03-0829 and other [57]), indicating the highly crystalline phase of cellulose I which is the co-presence of Iα and Iβ as commonly observed [57, 58]. The composited films show similar patterns without any reflection’s characteristics of the MgAl-LDH. The UV-VIS spectra (Fig. 2d) show decreased intensity at 205 − 180 nm with increasing amounts of the MgAl-LDH NS filler, and the maximum absorption becomes broad. The band gap energy of the BC/MgAl-LDH composite films was estimated from Tuac’s plot according to Fig. 2e. The obtained band gaps are 5.0-5.5 eV which are in good agreement with the DFT calculation of 5.7 eV for Iα and 5.4 eV for Iβ [59]. Thus, adding MgAl-LDH NS did not modify the general optical properties of BC.
The morphology of the BC/MgAl-LDH NS composites at 0.5, 1.5 and 5% v/v were analyzed by SEM. As depicted in Fig. 3a, nanofibers of BC with a width of ~ 50 nm and a length of > 1µm are evident. Also, the solid particles assigned as the MgAl-LDH NS were observed, and such particles increased as the loading increased. Moreover, Fig. 3b shows the EDS mapping of the BC/MgAl-LDH NS at 0.5, 1.5 and 5% v/v. The red and green dots are due to oxygen (O) and carbon (C), which are the main elements in the BC matrix. Notably, the homogeneous distribution of Mg and Al (white and blue dots, respectively) confirms the existence of the filler in the films. The corresponding results of Mg and Al contents in wt%
according to EDX analyses for the BC/MgAl-LDH NS samples at conditions 0.5, 1.5, and 5%v/v are shown in Table 1, confirming the increased loading. The 3D distribution of the MgAl-LDH NS filler in the BC matrix (0.5 and 1.5%v/v) was further visualized by SR-XTM. The tomographic images in Fig. 3c depict the BC matrix in yellow and the MgAl-LDH NS dispersive phase in red. The BC/MgAl-LDH NS 1.5%v/v appears more dispersed and homogeneous than BC/MgAl-LDH NS 5%v/v.
Table 1
The percentage of elements determined by EDS analysis.
| Samples | Weight percentage (wt%) of elements |
| O | C | Mg | Al | Total |
| BC/MgAl-LDH NS 0.5%v/v | 52.26 | 47.50 | 0.24 | 0.002 | 100 |
| BC/MgAl-LDH NS 1.5%v/v | 50.81 | 48.86 | 0.34 | 0.06 | 100 |
| BC/MgAl-LDH NS 5.0%v/v | 49.87 | 48.29 | 1.47 | 0.37 | 100 |
3.3 Dielectric properties, electrical output signals, and practical applications of BC/MgAl-LDH NS C-TENG
Basically, the dielectric properties relate to the efficiency of storing electrical energy under the applied electric field via generating polarization. In AC fields, the complex relative permittivity consists of the real (\({\epsilon }_{r}\)) and imaginary (\({\epsilon }_{i}\)) parts. The \({\epsilon }_{r}\) indicates the degree of polarization while \({\epsilon }_{i}\) signifies the loss of electrical energy to heat, i.e., the dielectric loss (tan \(\delta\) = \(\frac{{\epsilon }_{i}}{{\epsilon }_{r}}\)). BC exhibits a certain value of \({\epsilon }_{r}\) because of the abundant OH groups and their alignment. However, the intermolecular hydrogen bonds and the hydrophilicity mostly restrict its application [60, 61]. For LDH, the polarized interlayer species such as H2O (or H+/OH−) and nitrate ions could respond to the electric field, thereby generating electric dipoles [62].
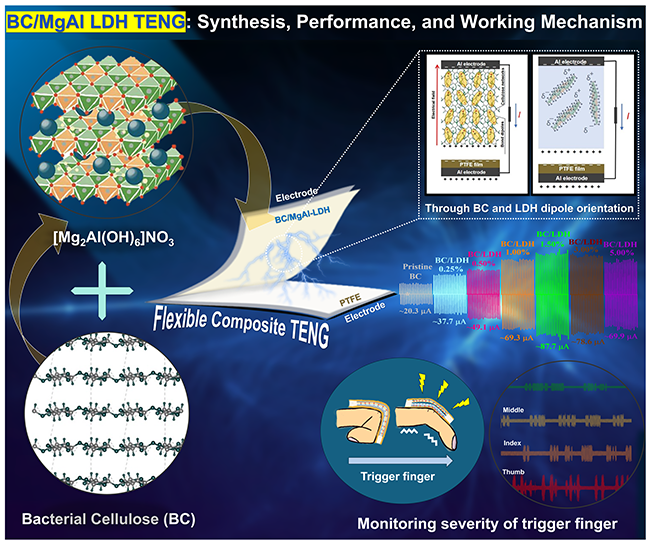
Figure 4a-b display the \({\epsilon }_{r}\) and tan \(\delta\) of BC and BC/MgAl-LDH NS composite films at room temperature as a function of frequency (f = 103-106 Hz). It is found that the \({\epsilon }_{r}\) of pristine BC film is low (~ 8.3 at 1300 Hz) and is weakly dependent on f. Upon adding the MgAl-LDH NS, the f dependence of \({\epsilon }_{r}\) can be observed. All the composite films showed similar behavior of decreased \({\epsilon }_{r}\) with increasing f. This finding can be explained using the anomalous low-frequency dispersion typical for heterogeneous solids containing low mobility charge carriers [62]. At high f, the diploes do not have enough time to align with respect to the rapid alternating electric field [63]. Therefore, \({\epsilon }_{r}\) decreases at high f and cis, which is consistent with BC composite with other fillers such as titanate nanosheets [33–35]. Notably, \({\epsilon }_{r}\) increases significantly with the addition of the MgAl-LDH NS filler. The maximum \({\epsilon }_{r}\) up to ~ 110 at f = 30 Hz could be reached at 1.5%v/v MgAl-LDH NS, attributing to the increasing polarization characteristic of the nanosheets. The f-dependent tan \(\delta\) is illustrated in Fig. 4b the pristine BC displays a low, f-independent tan \(\delta\) of 0.01. Meanwhile, all BC/MgAl-LDH NS composites clearly show the decreasing tan \(\delta\) with increasing f. All composites show a low loss with tan \(\delta\)< 0.15 at f = 30 Hz. Similar characteristics of f-dependent \({\epsilon }_{r}\) and tan \(\delta\) were reported previously by others [61, 64]. The VOC and ISC signal waveforms of BC with- and without the MgAl-LDH NS filler are depicted in Fig. 4c-d. Loading 0.25%v/v of MgAl-LDH NS generated higher VOC and ISC compared to the pristine BC, ascribed to the improved charge generation/storage [equation (5) and (6)] where the increased \({\epsilon }_{r}\)would increase \({E}^{{\prime }}\). The VOC and ISC signals were optimized at 1.5%v/v to ~ 88.5 V and ~ 87.7 µA respectively. Meanwhile, adding 3%v/v MgAl-LDH NS dropped both VOC and ISC, consistent with the well-known percolation point beyond which filler’s agglomeration and poor distribution would occur [65, 66].
For practical applications, TENG is usually applied on external loads with matched resistance to provide maximum output power (Pmax). Hence, the instantaneous Pmax at different load resistances was systematically studied by connecting the device to the full-bridge rectifier and resistor. Upon changing the resistor one by one, the specific V could be collected using an oscilloscope, where P was indirectly obtained following P = V × I. The variation of Pmax with different load resistances (1kΩ to 15MΩ) for pristine BC and 1.5%v/v BC/MgAl-LDH composite film are displayed in Fig. 4e-f. In accordance with Ohm’s law, the DC output voltage (VDC) increases with the increasing external resistance, and the DC output current (IDC) is reversed. The BC/MgAl-LDH NS C-TENG provided Pmax of ~ 1,250 µW at the resistance of 2 MΩ, higher than that of the pristine BC by 36 times. The power density was also calculated and reached ~ 138 µW/cm2. Notably, 1.5%v/v MgAl LDH NS has a relatively low filler content, which is used to achieve improved electrical output performance, as tabulated in Table 2.
Table 2
Comparison of cellulose/dielectric nanosheets-based C-TENG under contact-separation mode in the literature.
| Refs | Tribo-positive layer | Tribo-negative layer | VOC (V) | ISC (µA) | Output Power (µW/cm2) | Size (cm2) | Electrode material | Filler’s amount |
| [17] | CFP/Ti0.8O2NS/AgNP | PDMS | 42.0 | 7.5 | 25 | \(3\times\) 3 | Al | 5%wt |
| [37] | Al/ZnAl-LDH | PVDF | 231 | 5.6 | 450 | - | ITO | 20%wt |
| [67] | ZnO NS/Cellulose paper | PTFE | 77 | 0.17 | - | 3 \(\times\) 3 | gold | 16.3%wt |
| [19] | BC/ZnO NS | PTFE | 57.6 | 5.78 | 420 | 4 \(\times\) 5 | ITO glass | 10%wt |
| [68] | Cellulose/Ti3C2X | FEP | 84 | 10 | 25 | 4 \(\times\) 1 | Cu | - |
| [69] | CNF film/MXene NS | PDMS | 25 | 0.95 | 184 | - | Ag,PDMS | 10%wt |
| [70] | Cu; MoS2 NS/CFP | PVDF | 50 | 0.03 | 180 | 3\(\times\) 3 | Kapton | - |
| [71] | BC/Sr0.7Bi0.2TiO3 | PTFE | 600 | 20 | 140 | - | Al | 1 wt% |
| This work | BC/MgAl-LDH NS | PTFE | 88.5 | 87.7 | 138 | 3 \(\times\) 3 | Al tape | 1.5%v/v |
To further utilize TENG in real applications, the AC output signal needs to be converted to the DC waveform. By connecting TENG with a rectifier bridge, VDC and IDC could be measured. The DC output signals from the BC/MgAl-LDH NS (1.5%v/v) C-TENG are VDC of ~ 34 V and IDC of ~ 47 µA, as illustrated in Fig. 4g. The DC output was stable enough for charging the capacitors of 0.22 and 0.33 µF at around ~ 6.6 and ~ 5.8 V within a short time of 10 s, according to the capacitor charging test in Fig. 4h. The corresponding charge-discharged curve is also shown in Fig. 4i, confirms its use as a power supply, although the 2.2 and 3.3 µF capacitors could not be fully charged within 10 seconds (but they probably be charged by prolonging the charging time further). The charged Q could be calculated from V = Q/C. Hence, Q = 1.5 and 1.9 µC for a 0.22 and 0.33 µF capacitor, corresponding to charge density of about 167 nC/cm2 and 211 nC/cm2, respectively, after one cycle of charging. Furthermore, a real-time power supply testing was carried out by connecting the BC/MgAl-LDH NS C-TENG directly with LEDs. The 200 LEDs (Fig. 4j) could be brightened upon prolonging mechanical force to the C-TENG.
We also demonstrate the use of the BC/MgAl-LDH NS composite as a self-power sensor, specifically to monitor finger movements typically executed in e.g., physical therapy and exercise. As shown in Fig. 5a, the present C-TENG was attached to the finger joint, thanks to its flexibility and stretchability. It can be seen in Fig. 5b that the finger bending test (pressing-to-releasing at 90o angle) provides a similar amplitude of positive and negative VOC. The signal waveforms could also be distinguished between 5 different hand fingers, as shown in Fig. 5c-d. The thumb finger presented a maximum voltage of 680 mV, while the little finger showed a maximum voltage of 80 mV. In addition, different signals could be detected depending on the bending angle. For example, VOC = 0.1 V at the bending angle of 30o was obtained from the thumb, compared with 0.6 V at 90o. Figure 5e shows the stability of the present C-TENG devices. At normal state (without finger bending), the output signal was stable at nearly 0 V through the whole 100 sec. After briefly bending each finger at 90o and pausing repeatedly, the output signal rises and reaches the same maximum value for all cycles. Similar results were obtained for the finger bending (30o)-to-stopping experiment as shown in Fig. 5f, where the device provided the signal only when bending and with a stable electrical output throughout every cycle. Accordingly, the differentiation of signals between with- and without tremors could be possible, indicating a promising application as a self-powered sensor to track finger movements. The output voltage signal is directly proportional to the bending angle (Fig. 5g), and this might be further used as a comparison of the severity of symptoms or even to monitor finger physical therapy, as shown in Fig. 5h.
3.4 The role of BC and MgAl-LDH and the operating mechanism of BC/MgAl-LDH C-TENG
What is the role of BC in this C-TENG? Cellulose contains abundant OH groups (Fig. 6a) with the network formed via H-bond as illustrated in Fig. 6b. In their original state, there is no permanent dipole moment (µd = 0) as they are oriented randomly such that the polarization is cancelled. The triboelectrification and electrostatic induction during operation generates electric field, allowing dipoles to orient, giving a net value µd ≠ 0, and providing a decent dielectric constant [72] as illustrated in Fig. 6c. Adding the dielectric MgAl-LDH NS generates additional permanent dipole moments which can be explained by the Maxwell–Wagner–Sillars interfacial polarization (MWS-IP) where a large number of charges accumulated at the interface [73]. As mentioned above, two charge carriers of H+/OH− and NO3− in LDH are responsible for the dielectric response [62]. During triboelectrification, a small electric field is created between the tribo-material surfaces and electrodes to induce the orientation dipoles of the LDH layers along the electric field. This state is illustrated in Fig. 6d-e depicting the proton hopping of water and the movement of nitrate ions. At the optimized, uniformly dispersed BC/MgAl LDH NS (1.5%v/v), sufficiently free spaces allow the dipole's orientation to be suitable for electron transportation. Below this point, there are limited dipoles [39]. On the other hand, above this point, LDH agglomeration occurs.
The operating mechanism of TENG to generate electricity can be typically explained by the coupling of the triboelectric effect and electrostatic induction during the contact and separation process. The electron-cloud potential-well (ECPW) theory is used to describe the behavior of different insulating, dielectric materials [74] when they come into contact. The proposed ECPW-based electron transfer in this work is illustrated in Fig. 7a where the dielectric A is PTFE, and dielectric B is BC/MgAl-LDH NS. The dielectric A is assumed to contain a higher energy potential well (En) than that of the dielectric B, which corresponds to Eg = 5.3 eV of PTFE [75] and Eg = 4.8 eV of BC/MgAl-LDH NS 1.5%v/v. At the initial state shown in Fig. 6a, the highest occupied energy level vs the electron clouds remain separated by the distance d. Electrons cannot be transferred because of the potential barrier. During the contracting process, atoms of two friction materials come close enough such that their electron clouds collide and overlap, thereby shortening d (dx < d) in a nonequilibrium dynamic process shown in Fig. 7b. The initial potential well of each material becomes an asymmetric double-well potential to allow the spontaneous electrons to transport from low- to high-electronegativity materials, as shown in Fig. 7b (i). Accordingly, electrons located at high energy states in BC/MgAl-LDH NS will jump to lower energy states of the PTFE’s surface states. As atoms come closer, more electrons can be transferred and reach the maximum equilibrium position dx = d0, according to Fig. 7b (ii). The increased charge transfer can be induced immediately when the materials pair is scrubbed tighter or harder (i.e., increasing contact). Upon prolonging time further, the overlapped electron cloud is maximized at dx = dmin (Fig. 7b) (iii)). Here, electrons located at higher energy in the BC/MgAl-LDH NS can transit to PTFE, and some transferred electrons can simultaneously jump back to high energy state of BC/MgAl-LDH NS. The repulsion between two atoms would occur. Then, after releasing the applied force, the BC/MgAl-LDH NS and the PTFE pair are separated by the original d. The transferred electrons remain in PTFE, while the positive charges occur on the BC/MgAl-LDH NS’s surface, as shown in Fig. 7c. However, during a continuous time of contact-separation of TENG, the partial electrons can be lost from the PTFE surface (Fig. 7d) because of thermionic emission [76] and air breakdown [77]. The created thermal energy can be a driving force for charge carriers to overcome the work function, leading to partial loss of charged carriers. Also, a part of electrostatic induction can promote electron dissipation by an interaction between surface charge and air. With a certain atmospheric environment and dielectric parameter, the surface charge density is limited by the air-breakdown effect. A larger dielectric constant can help improve a higher maximum surface charge density [78].
The electrical signal waveform of TENG operation can be provided within the four states of contact-separation (I-IV) while the external forces are applied in the cycle, as illustrated in Fig. 7e. PTFE film represents the tribe-negative layer, while the BC/MgAl-LDH NS composite film represents the tribe-positive layer. Initially, there is no electrical output because there is no contact/friction of the pair. At contact (state I), triboelectrification occurs. The BC/MgAl-LDH NS (with abundant electron-donating OH groups) gives its electrons to PTFE, which contains the highly electronegative F atoms. However, the surface charges are still balanced by continuous contact at the interface, such that a current does not flow. At separation (state II), a small air gap will be formed on two surfaces. The static charges are, therefore, induced in the electrode on both sides of TENG, i.e., electrostatic induction. Consequently, PTFE will be negatively charged while the BC/MgAl-LDH NS film will be positively charged. The generation of this small electrostatic field is essential, transferring electrons from the bottom to the top Al electrodes through the external load. Simultaneously, the current flows in the opposite direction. Dielectric materials can significantly improve charge accumulation and enhance the efficiency of electrical output signals. In this work, the dipole moments inside the MgAl-LDH NS will be arranged in the same direction under an electric field (net polarization ≠ 0), thereby inducing more charges to flow through the load until achieving its maximum output where the charges are balanced (state III). After the triboelectric layer starts to be continuously compressed, a free electron that accumulates at the electrodes will flow back in the opposite direction to provide the opposite sign of output signals (state IV) to complete the cycle. The mechanical rubbing or contacting in TENG’s operation occurs repeatedly to generate the pulsed AC waveforms ultimately.
Figure 7f represents a detailed structure of dielectric-to-dielectric TENG at separation. It consists of two dielectric layers (DLs) of BC/MgAl-LDH NS composite and PTFE films. Both of them are attached to Al tape as their metal electrodes, which are located at the top and bottom. The surface charge densities of BC/MgAl-LDH and PTFE are denoted as σSC. The separation of the two materials results in electrostatic induction, activating the potential difference (V) between two metal electrodes, which is driven by the transferred surface charge (\({Q}_{SC}\)). The repelled electrons in the PTFE side flow toward its Al electrode, to the BC/MgAl-LDH side. Upon connecting the device with electric wires, the VOC and ISC can be obtained [79].
During TENG operation, one needs to consider the separation distance (x) and DL thickness (d) according to the V-Q-x relationship theory. Previous models assume that Q = 0 under open-circuit conditions; thus, the ideal VOC is expressed by VOC = \(\frac{\sigma x\left(t\right)}{{\epsilon }_{0}}\), where \({\epsilon }_{0}\) is the vacuum permittivity. In real operation, Q = 0 is not satisfied. So, the actual VOC can be given by [80]:
V OC = \(-\frac{{Q}_{SC}}{{S\epsilon }_{0}}\left(\frac{{d}_{BC/MgAl-LDH }}{{\epsilon }_{rBC/MgAl-LDH}}+\frac{{d}_{PTFE}}{{\epsilon }_{rPTFE}}+x\left(t\right)\right)+\frac{\sigma x\left(t\right)}{{\epsilon }_{0}}\) (4)
, where QSC and σ are the surface charge and surface charge density; \({\epsilon }_{r}\) represents the dielectric permittivity of DL; and x(t) is the device’s separation with respect to time. At V = 0, QSC is defined as follows (where g denotes the total air gap thickness between two metal plates and S is the surface of electrodes):
Q SC = \(\sigma xS\left[\frac{\frac{{d}_{BC/MgAl-LDH }}{{\epsilon }_{rBC/MgAl-LDH }}}{(g+\frac{{d}_{BC/MgAl-LDH }}{{\epsilon }_{rBC/MgAl-LDH }})(g+\frac{{d}_{BC/MgAl-LDH }}{{\epsilon }_{rBC/MgAl-LDH }}-x)}+\frac{1}{x+\frac{{d}_{PTFE}}{{\epsilon }_{rPTFE}}}\right]\) (5)
The ISC follows Eq. (6),
$${I}_{SC}=\frac{1}{S}\frac{d}{dt} \left({Q}_{SC}\right)= \frac{1}{S}\frac{d}{dt}\left[\frac{S\sigma x\left(t\right)}{{d}_{0}+x\left(t\right)}\right]= \frac{\text{S}{\sigma }{\text{d}}_{0}v\left(\text{t}\right)}{{{(\text{d}}_{0}+x\left(\text{t}\right))}^{2}}$$
6
, where d0 = d/\({\epsilon }_{r}\), and v(t) is the relative velocity of friction materials with respect to time. Once the separation occurs (Fig. 7e, state II), the generated electric field between the BC/MgAl-LDH surface and its electrodes will induce the dielectric polarization (PD) inside MgAl-LDH. This results in increasing QSC, which provides a higher electrical output of VOC and ISC.