3.1 The m6A levels are downregulated in RCC tissues and cell lines
Recent advancements reveal that m6A methylation is involved in the onset and progression of many human cancers. Hence, we detected the m6A levels in RCC tissues and cell lines. The colorimetry assay was applied to detect the overall m6A levels in RCC tissues and adjacent normal renal tissues, normal renal tubular epithelial cells (HK-2), and RCC cell lines (Caki-1, 786-O and ACHN). The results showed that the overall m6A levels in RCC tissues and cell lines were significantly lower than those in adjacent normal renal tissues and HK-2 cells (Fig. 1A-B). Then, the mRNA expressions of METTL3, METTL14, WTAP, FTO, ALKBH5, and other key m6A regulatory factors were detected in RCC tissues and adjacent normal renal tissues by qRT-PCR. The results showed that the mRNA expression of METTL14 in RCC tissues was significantly lower than that in adjacent normal renal tissues (Fig. 1C). Subsequently, we examined the expression of METTL14 in HK-2 and RCC cell lines. The results indicated that METTL14 mRNA expression in RCC cell line was significantly lower than that in HK-2 cell (Fig. 1D). Similar results were obtained in both RCC tissues and cell lines by western blot assay (Fig. 1E-F). Concurrently, METTL14 overexpressed plasmid were transfected into Caki-1 cells (Fig. 1G). The results suggested that the m6A levels were significantly increased after METTL14 overexpression in Caki-1 cells (Fig. 1H).
The above results demonstrate that the downregulated m6A levels in RCC tissues and cell lines may be a key factor in regulating the occurrence and development of RCC.
3.2 LHX1-DT is a key target gene regulated by m6A modification and related to poor prognosis in RCC patients
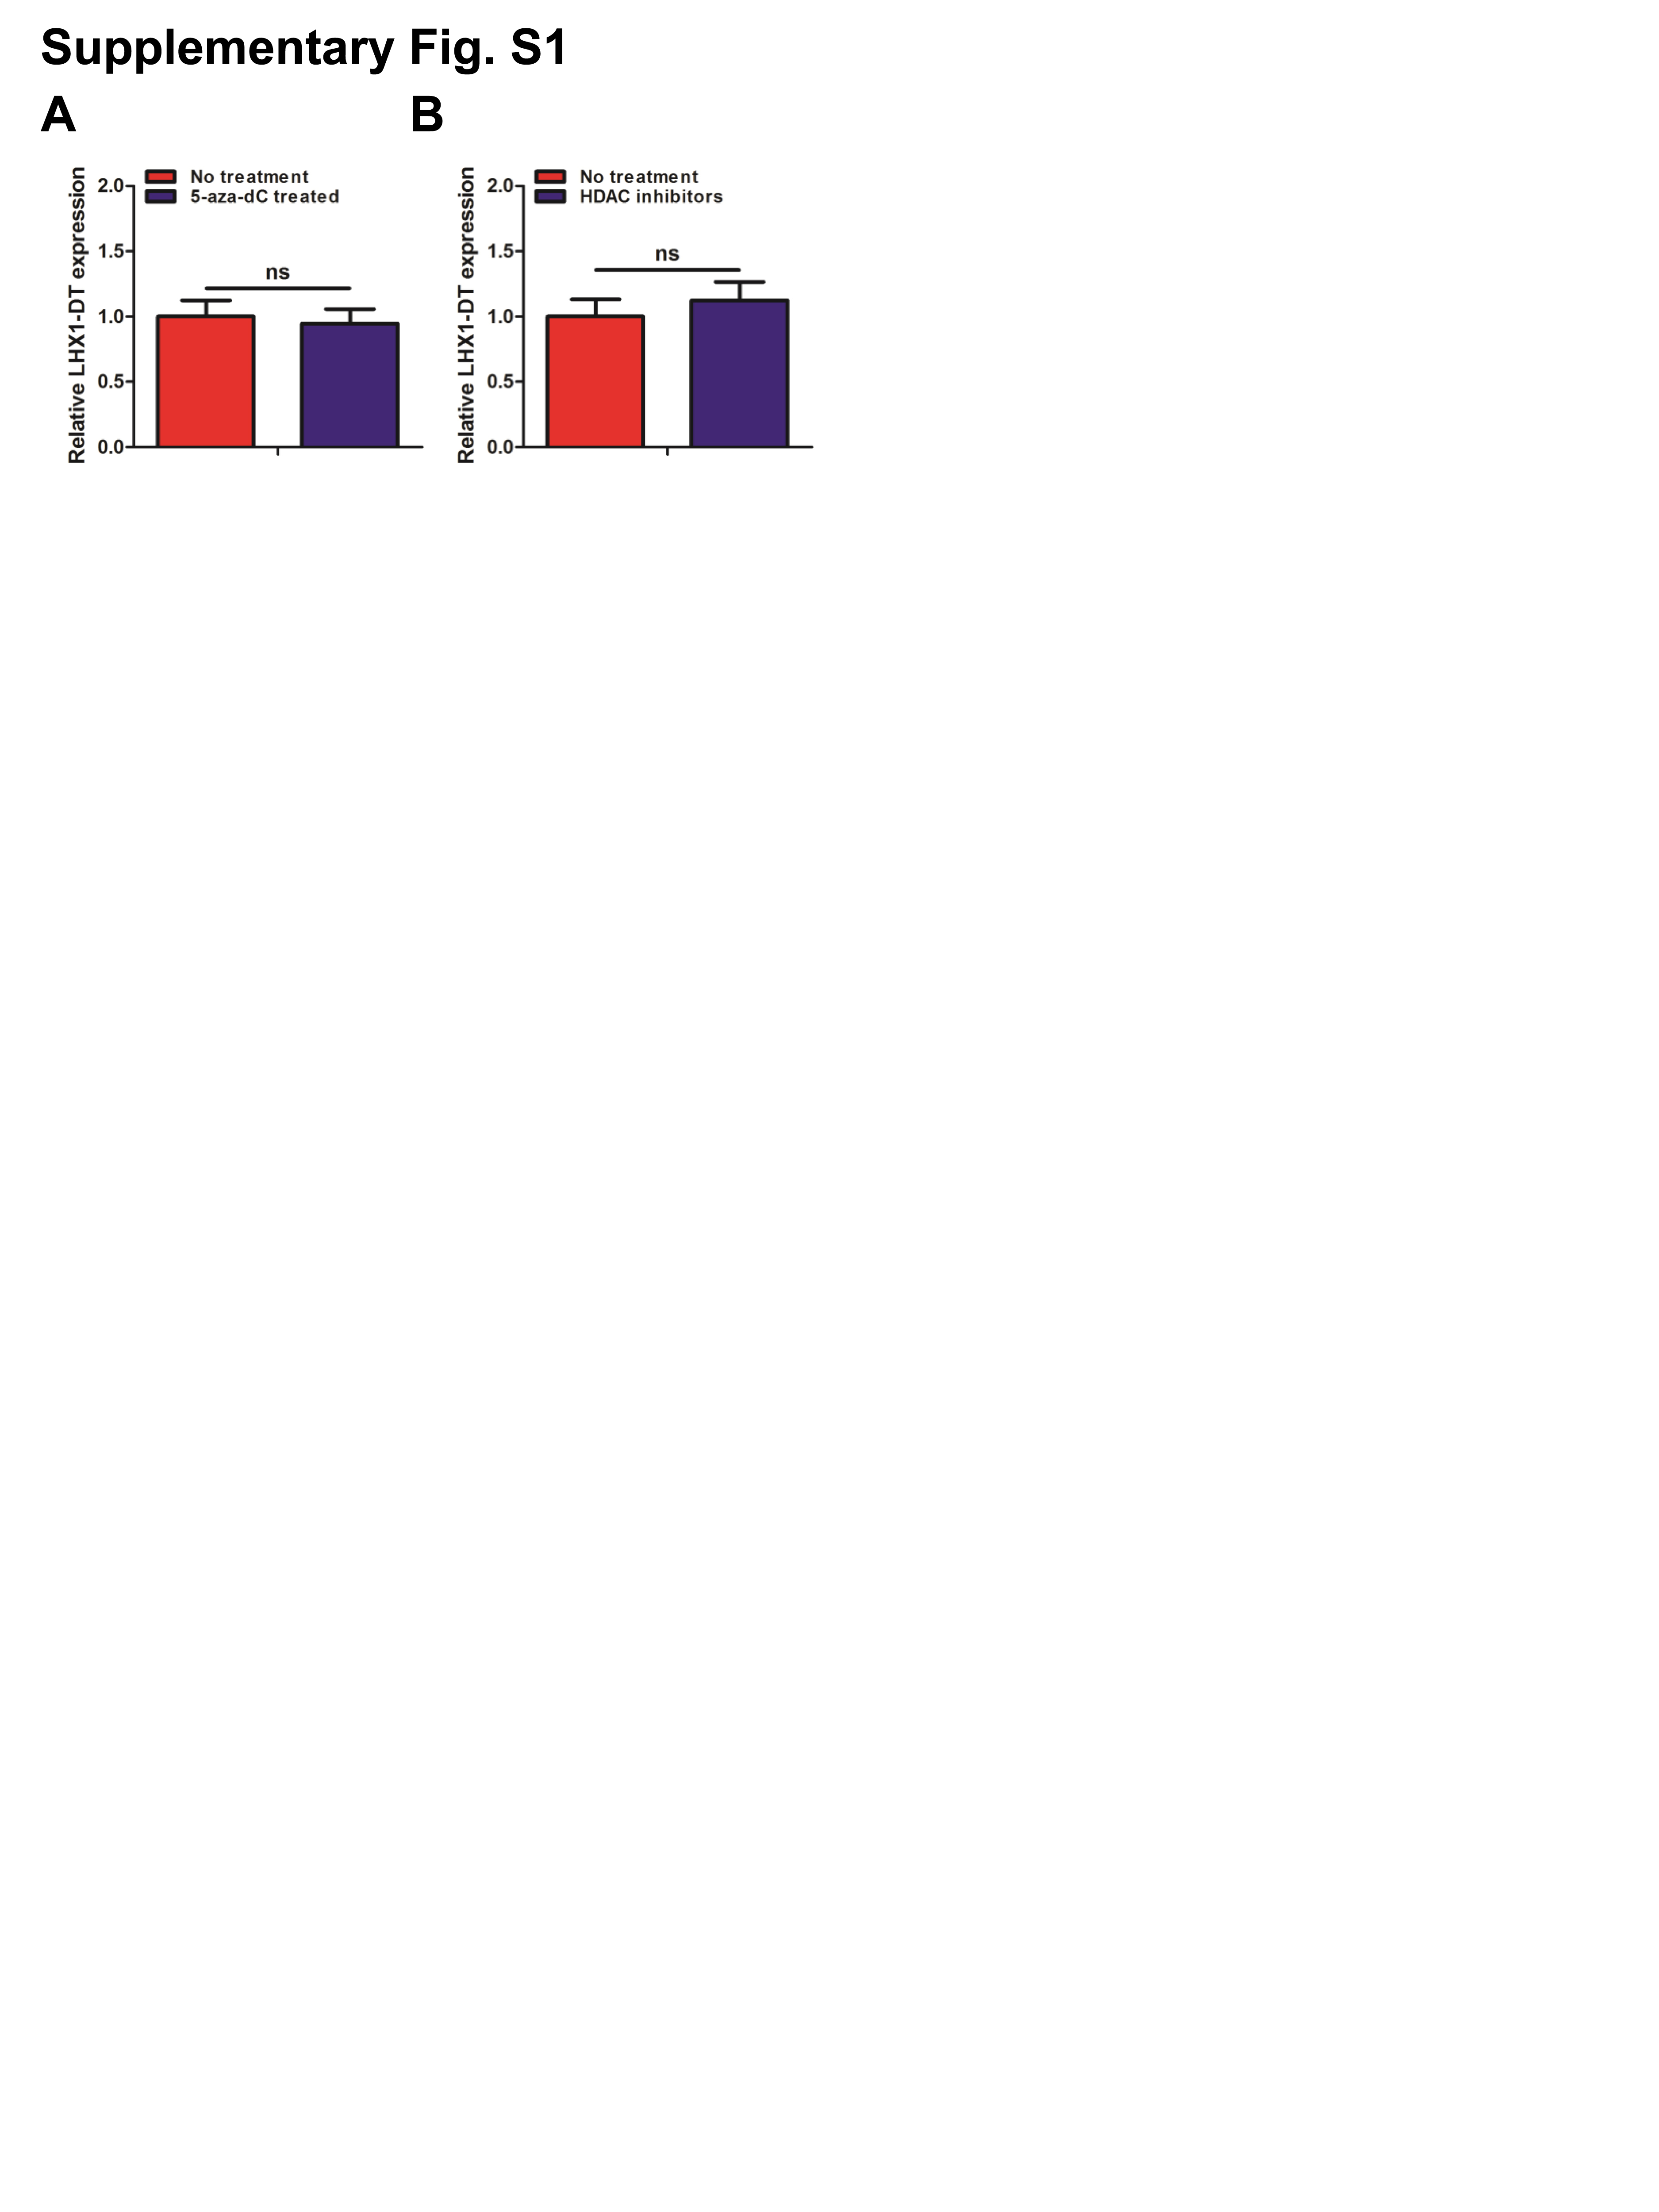
Recent studies have revealed that m6A modification is closely related to lncRNA expression. Some research groups have found that m6A modification can regulate lncRNA expression by affecting lncRNA stability [18–21]. Hence, we conducted m6A-mRNA and lncRNA epitranscriptomic microarray analysis in 3 paired RCC tissues and adjacent normal renal tissues. The results showed that the m6A levels were up-regulated in 2,290 lncRNAs and down-regulated in 1,660 lncRNA. The top 10 up-regulated and 15 down-regulated m6A levels of lncRNAs were listed in Fig. 2A, among which LHX1-DT m6A level was the most obviously down-regulated one. The variation of the two groups were showed in volcano plots (Fig. 2B). Meanwhile, another microarray analysis was performed to distinguish lncRNA expression profiles in the above 3 pairs of samples. The results showed that 1,688 up-regulated and 2,931 down-regulated lncRNAs were found in those two groups, respectively. The top 15 up-regulated and 15 down-regulated lncRNAs were listed in Fig. 2C. Notably, the expression of LHX1-DT in RCC tissues was significantly lower than that in paired adjacent normal renal tissues. The variation of the two groups were showed in volcano plots (Fig. 2D). Simultaneously, LHX1-DT expression changed little after treated with 5-aza-dC, a DNA methyltransferase inhibitor (Supplementary Fig. S1A), implying that DNA methylation doesn't participate in LHX1-DT modulation. Similarly results verified that the broad-spectrum histone deacetylase (HDAC) inhibitors (SAHA and NaB) also had no effect on LHX1-DT expression (Supplementary Fig. S1B), revealing that histone acetylation doesn't involve in LHX1-DT regulation in RCC cells. Therefore, LHX1-DT might be a target gene regulated by m6A modification in RCC.
However, the biological and clinical function of LHX1-DT in RCC progression remain unclear. Hence, we assessed the m6A level of LHX1-DT in RCC samples and cell lines. The m6A level of LHX1-DT was detected by methylated RNA immunoprecipitation (meRIP) using m6A antibody to pull down the m6A modified RNA in RCC tissues and adjacent normal renal tissues, HK-2 cells and RCC cell lines (Caki-1, 786-O, and ACHN). The results showed that the m6A level of LHX1-DT in RCC tissues and cell lines were significantly lower than those in the paired adjacent normal renal tissues and HK2 cells (Fig. 2E-F). As expected, the expression of LHX1-DT in RCC tissues (52 paired) and cell lines were significantly lower than those in the paired adjacent normal renal tissues and HK2 cells (Fig. 2G-H). Low level of LHX1-DT was found to be positively related to advanced Fuhrman grade (Table 1). The results of Kaplan-Meier analyses revealed that high LHX1-DT expression indicated a better OS (Fig. 2I).
Table 1
The relationship between LHX1-DT expression and clinicopathologic characteristics in 52 RCC patients.
| Parameters | Total | Low LHX1-DT | High LHX1-DT | P value |
| Age (years) | | 34 | 18 | 0.3224 |
| ≤50 | 28 | 20 | 8 | |
| >50 | 24 | 14 | 10 | |
| Gender | | | | 0.4445 |
| Male | 28 | 17 | 11 | |
| Female | 24 | 17 | 7 | |
| Fuhrman grade | | | | 0.0386 |
| Low grade | 11 | 4 | 7 | |
| moderate grade | 16 | 10 | 6 | |
| High grade | 25 | 20 | 5 | |
| T-stage | | | | 0.3126 |
| T1-T2 | 39 | 24 | 15 | |
| T3-T4 | 13 | 10 | 3 | |
| N-stage | | | | 0.8521 |
| N0 | 44 | 29 | 15 | |
| N1-N2 | 8 | 5 | 3 | |
| M-stage | | | | 0.7179 |
| M0 | 45 | 29 | 16 | |
| M1 | 7 | 5 | 2 | |
The above results indicate that LHX1-DT is an independent prognostic factor regulated by m6A modification and related to good prognosis of RCC patients.
3.3 LHX1-DT inhibits RCC cell proliferation and invasion in vitro and in vivo
To identify the biological function of LHX1-DT in RCC, we performed the cell proliferation assay and invasion assay. First, 786-O and Caki-1 cells were transfected with functional LHX1-DT-cDNA and LHX1-DT-shRNA. The qRT-PCR results confirmed that LHX1-DT expression was effectively regulated (Fig. 3A-B). The results of cell proliferation assay revealed that LHX1-DT overexpression dramatically inhibited cell proliferation, whereas LHX1-DT knockdown significantly promoted cell proliferation in 786-O and Caki-1 cells (Fig. 3C-D). As expected, similar results were obtained in 786-O and Caki-1 cells by a transwell invasion assay (Fig. 3E-F). These data demonstrate that LHX1-DT inhibits RCC cell proliferation and invasion in vitro.
To further explore the effect of LHX1-DT in vivo, orthotopic xenograft mouse models were established to verify the anti-tumorigenic role of LHX1-DT. Caki-1 cells were labeled with luciferase expression and transfected with functional LHX1-DT-cDNA. Then, these transfected cells were injected into the renal capsule of nude mice. Tumor size was monitored by an In Vivo Imaging System (IVIS). After 6 weeks, the results showed a significant reduction in terms of tumor growth, size, and weight in the LHX1-DT overexpression group compared to the control group (Fig. 3G-I). Meanwhile, Ki67 was decreased in the LHX1-DT overexpression group compared to the control group by IHC staining (Fig. 3J). LHX1-DT expression was increased in the LHX1-DT overexpression group detected by the qRT-PCR assay (Fig. 3K). In all, the above data indicate that LHX1-DT inhibits RCC cells proliferation and invasion in vivo.
3.4 LHX1-DT acts as a ceRNA to absorb miR-590-5p
To explore how LHX1-DT exerts its function, we forecasted the subcellular localization through online lncATLAS (http://lncatlas.crg.eu/). LHX1-DT was forecasted to be localized principally in the cytoplasm (Fig. 4A). The results of nuclear-cytoplasmic fractionation assay confirmed that LHX1-DT was localized in the cytoplasm (Fig. 4B), which was also verified by FISH assay (Fig. 4C). Recent investigations have reported that cytoplasmic lncRNA could become a tumor suppressor or an oncogene in human cancers, functioning as a miRNA sponge [22–24]. Therefore, we wondered whether LHX1-DT inhibited RCC cell proliferation and invasion by sponging some miRNAs. The RNA immunoprecipitation (RIP) assay was conducted by a specific anti-AGO2 antibody, which represented a complex component that took part in miRNA-mediating mRNA translational repression or destabilization (Fig. 4D). The results showed that endogenous LHX1-DT was more enriched in AGO2 compared to the control (Fig. 4E). These data demonstrate that LHX1-DT may act as a ceRNA to inhibit RCC cell development.
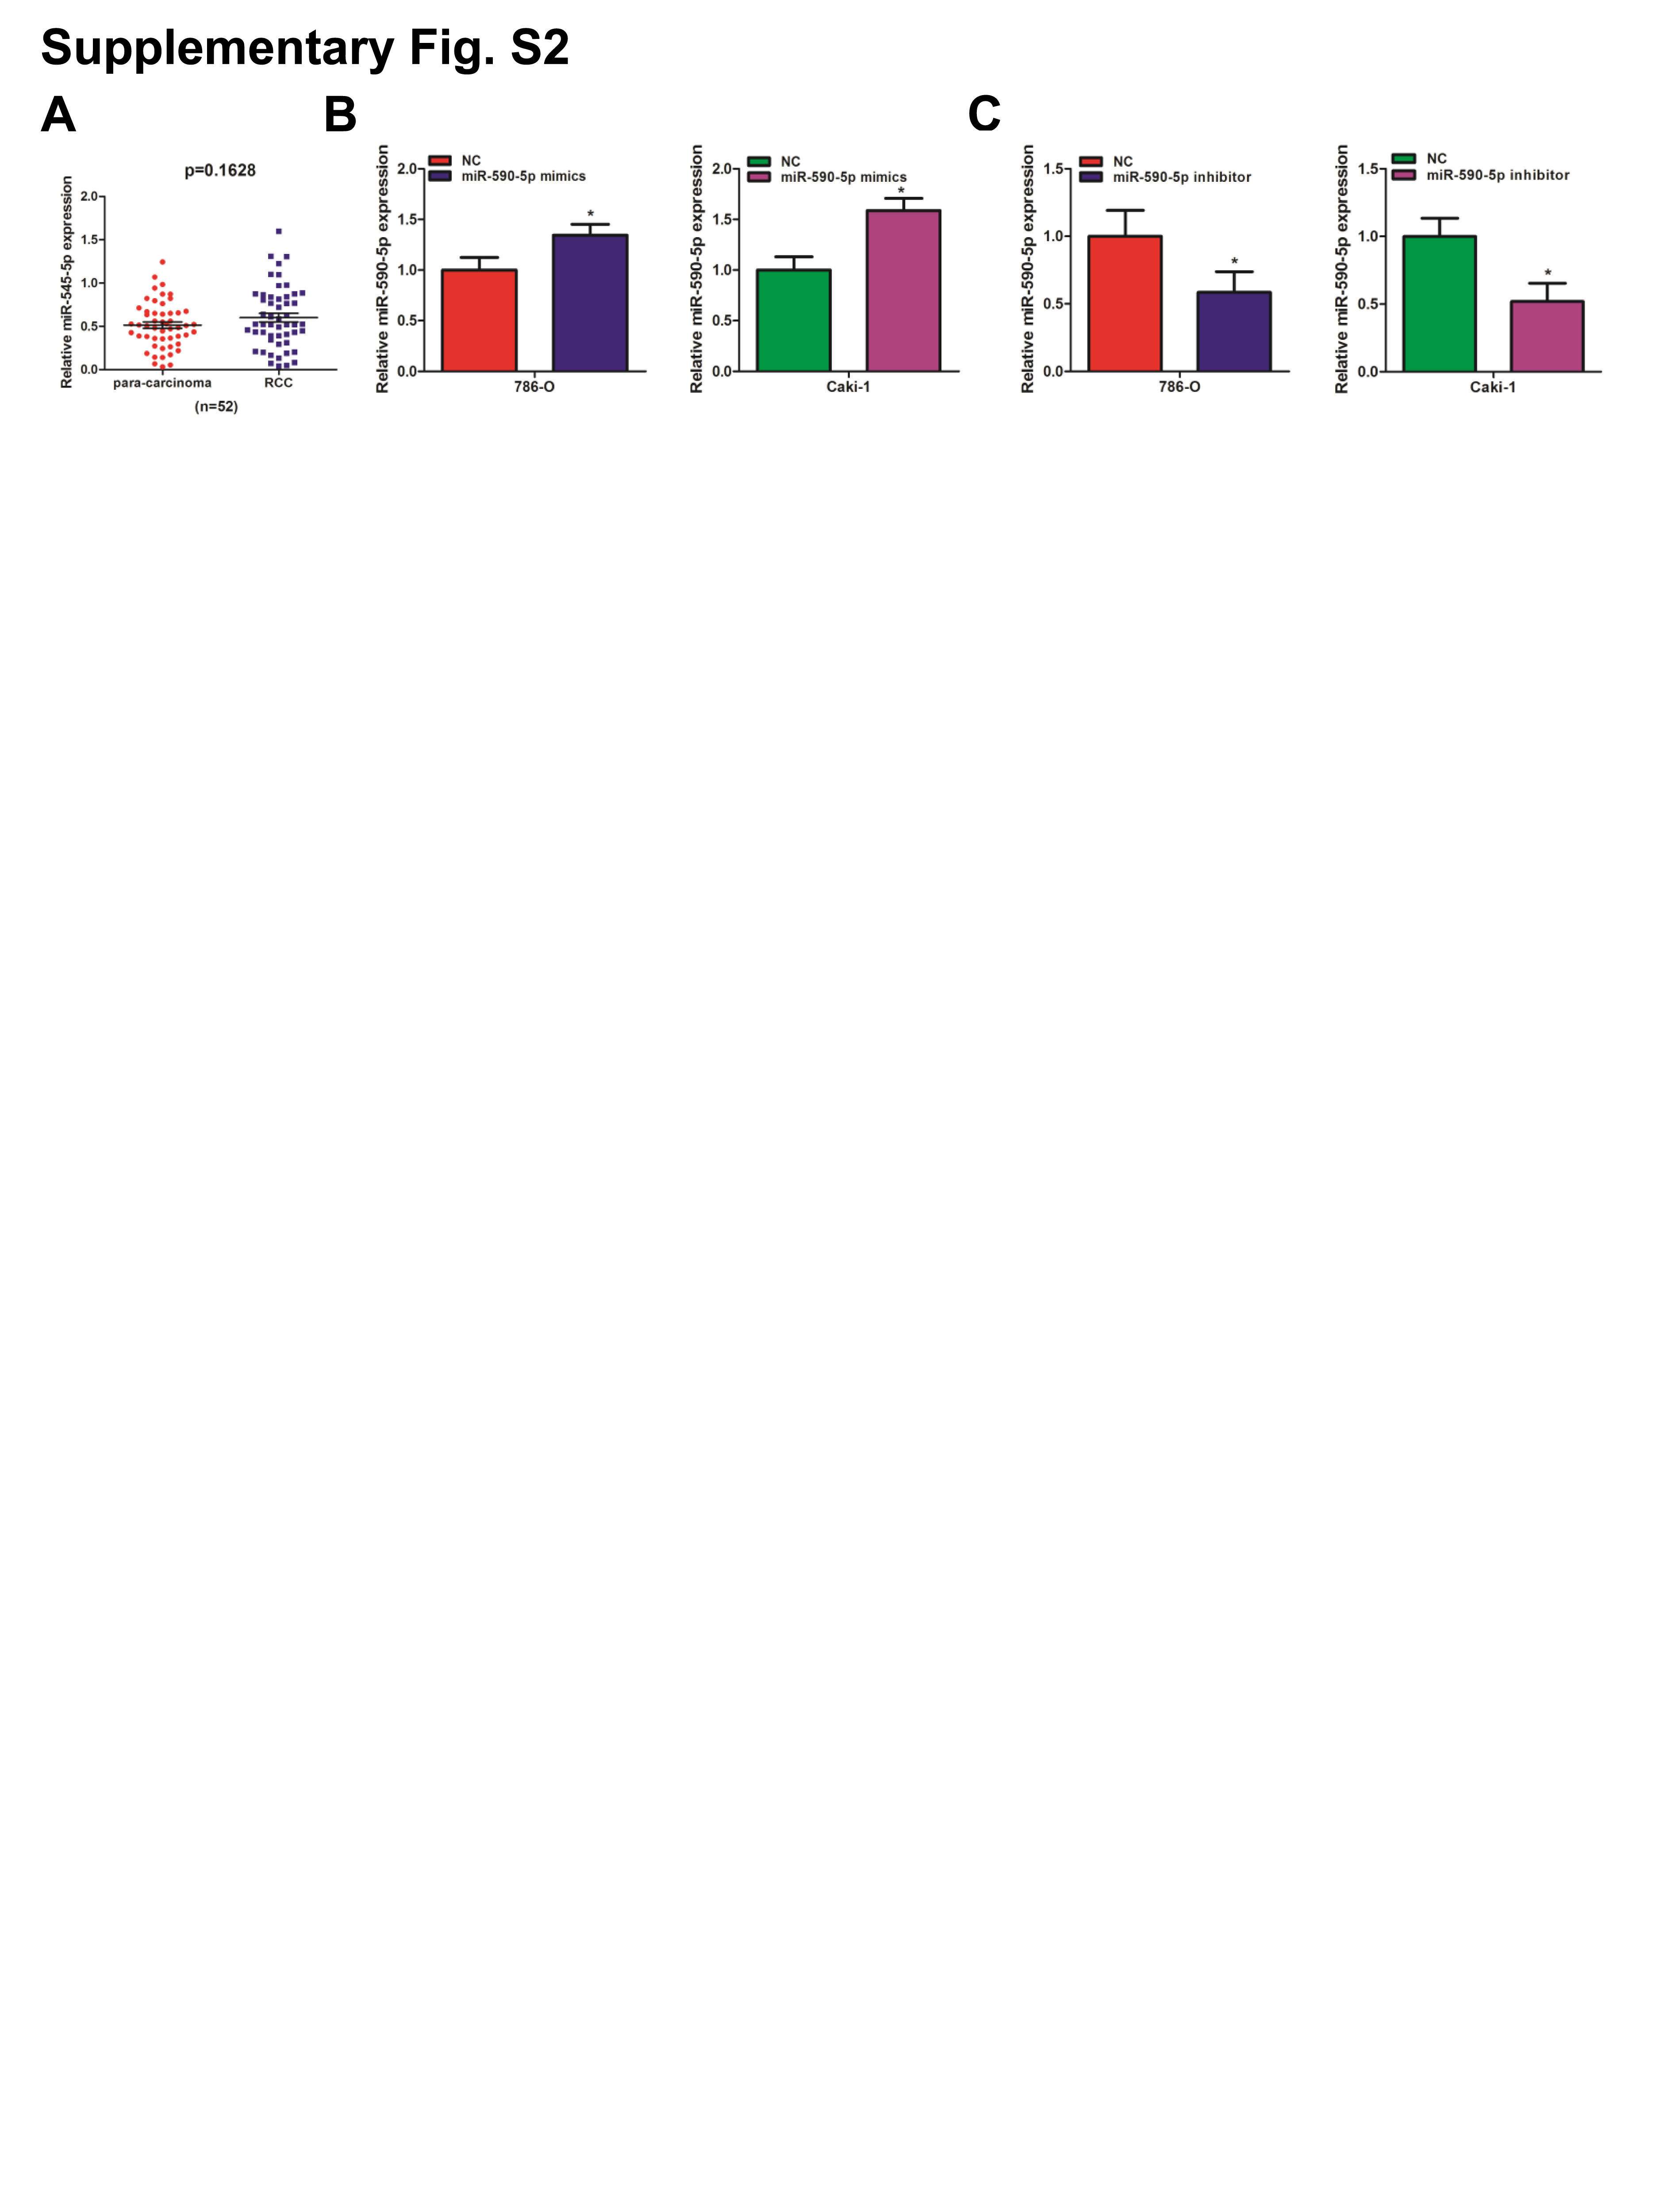
Then, we searched for the potential miRNAs that could bind with LHX1-DT. Fifty-one miRNAs that might interact with LHX1-DT were predicted by DIANA Tools, and forty miRNAs that were differentially expressed in RCC tissues compared to adjacent normal renal tissues were analyzed by GEO database (GSE12105). miR-590-5p and miR-545-5p was found in the intersection of two datasets (Fig. 4F). The qRT-PCR results revealed that miR-590-5p was significantly increased in 52 paired RCC tissues compared to adjacent normal renal tissues, while miR-545-5p was not (Fig. 4G and Supplementary Fig. S2A). Hence, miR-590-5p was selected for further investigation. AGO2 assay was conducted to detect whether LHX1-DT functioned as a part for AGO2 and miR-590-5p complex. The results confirmed that LHX1-DT was more enriched in miR-590-5p mimics group (Fig. 4H). Next, we found that miR-590-5p level was negatively related to the LHX1-DT level in RCC tissues (Fig. 4I). Overexpression of LHX1-DT resulted in a prominent downregulation of miR-590-5p, whereas LHX1-DT silencing led to an upregulation of miR-590-5p (Fig. 4J-K). Then, luciferase reporter assay was designed containing wild-type (LHX1-DT-WT) and mutated miR-590-5p binding sites (LHX1-DT-MUT) (Fig. 4L). The results indicated that the luciferase activities of wild-type group was significantly decreased after adding miR-590-5p mimics, but the luciferase activities of mutant-group had no change, which concluded that LHX1-DT may target miR-590-5p in a sequence-specific manner (Fig. 4M-N). Moreover, biotin-coupled miR-590-5p successfully pulled down the binding of LHX1-DT, while biotin-coupled LHX1-DT successfully pulled down the binding of miR-590-5p in 786-O and Caki-1 cells (Fig. 4O). These findings verify that LHX1-DT acts as a ceRNA for miR-590-5p in RCC.
Subsequently, a rescue assay was performed to detect the role of miR-590-5p in RCC cell proliferation and invsion. The expression of miR-590-5p was upregulated and downregulated by miR-590-5p mimics or inhibitor in 786-O and Caki-1 cells, respectively (Supplementary Fig. S2B-C). miR-590-5p overexpression promoted cell proliferation and invasion, while upregulation of LHX1-DT partially reversed the promotive effect of miR-590-5p on cell proliferation and invasion in 786-O and Caki-1 cells (Fig. 4P-Q). Conversely, ablation of miR-590-5p inhibited cell proliferation and invasion, while LHX1-DT silencing partially reversed the inhibitory effect of miR-590-5p on cell proliferation and invasion in 786-O and Caki-1 cells (Fig. 4R-S). The above data demonstrate that LHX1-DT acts as a miRNA sponge for miR-590-5p in the modulation of RCC progression.
3.5 IGF2BP2 binds to LHX1-DT and regulates its expression in a m6A dependent manner
We found that lncRNA might be a target regulated through an m6A modification approach, but the exact mechanism is complicated [18, 20]. Based upon, we studied the m6A modification of LHX1-DT. As previously mentioned that METTL14 expression was decreased in RCC. Hence, we explored the effect of METTL14 on LHX1-DT expression. The qRT-PCR results indicated that METTL14 overexpression obviously increased m6A and expression of LHX1-DT in 786-O and Caki-1 cells (Fig. 5A-B). There existed a positive relationship between METTL14 and LHX1-DT levels in RCC tissues (Fig. 5C). These data demonstrate that m6A modification is indeed involved in the downregulation of LHX1-DT.
We then investigated the stability of LHX1-DT after manipulation of METTL14. The results showed that METTL14 knockdown dramatically decreased the half-life of LHX1-DT in 786-O and Caki-1 cells which were treated with actinomycin-D (Fig. 5D-E), manifesting that METTL14 regulated LHX1-DT expression by modulating LHX1-DT stability. Hence, we explored the possible m6A reader which could recognize methylated LHX1-DT and regulate its stability. Recent studies revealed that IGF2BPs family could recognize m6A and increase RNA stability [21, 25]. RIP assay revealed that LHX1-DT was dramatically enriched in IGF2BP2 instead of IGF2BP1 and IGF2BP3 (Fig. 5F). The deletion of METTL14 decreased the enrichment of LHX1-DT in IGF2BP2 protein (Fig. 5G), suggesting that METTL14-induced m6A modification regulated the recognition of methylated LHX1-DT by IGF2BP2. Meanwhile, inhibition of IGF2BP2 reduced the half-life of LHX1-DT in 786-O and Caki-1 cells (Fig. 5H-I), which was similar with METTL14 knockdown. These data indicated that IGF2BP2 functioned as an m6A reader for LHX1-DT. Next, IGF2BP2 was identified to be downregulated according to the GEPIA2 dataset (http://gepia2.cancer-pku.cn/#index) (Fig. 5J). In addition, to investigate whether the potential m6A modification sites predicted by SRAMP are associated with the interaction between LHX1-DT and IGF2BP2, we mutated all the m6A modification sites (Fig. 5K). The results of RIP assay indicated that the direct binding between LHX1-DT and IGF2BP2 was disrupted by mutations of the m6A modification sites (Fig. 5L). METTL14 or IGF2BP2-mediated modulation of LHX1-DT was impaired after mutation of the m6A modification sites (Fig. 5M). To identify which m6A modification site is responsible for m6A-mediated LHX1-DT stabilization, three LHX1-DT mutants were designed (Fig. 5N). The data of luciferase reporter assay showed that site 1 (‘UUGGACU’) was participatded in the regulation of LHX1-DT stability (Fig. 5O).
In all, the above data demonstrate that IGF2BP2 binds to LHX1-DT and enhances the stability of LHX1-DT in a m6A dependent manner.
3.6 LHX1-DT inhibits RCC progression by targeting miR-590-5p/PDCD4 axis
It is well known that miRNAs can perform multiple biological functions through targeted mRNAs [26, 27]. To investigate the mechanism of LHX1-DT/miR-590-5p in RCC progression, we searched three online analysis softwares and found that 11 mRNAs might be the possible targets of miR-590-5p including PDCD4 (Fig. 6A), which was identified to be a tumor suppressor in RCC [28–30]. The qRT-PCR results revealed that the expression of PDCD4 and BTG2 were lower in RCC tissues than those in adjacent normal renal tissues, while PDCD4 decreased more significantly (Fig. 6B). Using our 52 paired RCC samples, we confirmed that PDCD4 was significantly decreased in RCC tissues compared to adjacent normal renal tissues (Fig. 6C). The result of Kaplan-Meier analysis showed that low PDCD4 level indicated poorer OS according to the GEPIA2 dataset (http://gepia2.cancer-pku.cn/#index) (Fig. 6D). The miR-590-5p level was negatively correlated with PDCD4 level in RCC (Fig. 6E). We also observed that both the mRNA and protein levels of PDCD4 were downregulated or upregulated by adding miR-590-5p mimics or inhibitor in 786-O and Caki-1 cells, respectively (Fig. 6F-G). Next, luciferase reporter assay was carried out to validate the predicted binding site of miR-590-5p and PDCD4 3’-UTR (Fig. 6H). The results revealed that the luciferase activities of PDCD4-WT was significantly decreased after adding miR-590-5p mimics, but the luciferase activities of PDCD4-MUT had no change (Fig. 6I-J). Overexpression of PDCD4 partially reversed the promotive effect of miR-590-5p mimics on cell proliferation and invasion (Fig. 6K-L), while PDCD4 knowdown partially reversed the inhibitory effect of miR-590-5p inhibitor on cell proliferation and invasion in 786-O and Caki-1 cells (Fig. 6M-N). The above data demonstrate that PDCD4 is a target of miR-590-5p.
We further found that the PDCD4 level was positively related to the LHX1-DT level in RCC tissues (Fig. 6O). The results indicated that both the protein and mRNA levels of PDCD4 were upregulated or downregulated by transfecting functional LHX1-DT-cDNA or LHX1-DT-shRNA in 786-O and Caki-1 cells, respectively (Fig. 6P-Q). Overexpression of LHX1-DT partially reversed the inhibitory effect of miR-590-5p mimics on PDCD4 expression (Fig. 6R-S), while LHX1-DT knowdown partially reversed the promotive effect of miR-590-5p inhibitor on PDCD4 expression both in the protein and mRNA levels (Fig. 6T-U). In all, these data suggest that the inhibition effect of LHX1-DT on RCC progression is mainly depent on the miR-590-5p/PDCD4 axis.
3.7 PDCD4 is responsible for LHX1-DT-mediated inhibition of cell proliferation and invasion
To detect whether LHX1-DT inhibits RCC progression in a PDCD4-dependent manner, we transfected functional LHX1-DT-cDNA and PDCD4-knockdown vector in 786-O and Caki-1 cells. The results revealed that downregulation of PDCD4 partially reversed the inhibitory effect of LHX1-DT overexpression on RCC cell proliferation (Fig. 7A). As expected, we got similar results in 786-O and Caki-1 cells using a transwell invasion assay (Fig. 7B). Conversely, the results manifested that upregulation of PDCD4 partially reversed the promotive effect of LHX1-DT knockdown on RCC cell proliferation and invasion (Fig. 7C-D). These findings show that LHX1-DT is a tumor suppressor lncRNA that inhibits RCC cell proliferation and invasion through miR-590-5p/PDCD4 signaling pathway (Fig. 8A).