A total of 102 participants, 39 from the supervised and 63 from the semi-supervised exercise training program, were included in this study (47 ± 13 years; 58.8% females; 29.1 ± 6.0 kg/m2; smokers/ex-smokers: 21.6%). Approximately half of them had post-secondary education (49%) and were receiving 1–3 minimum wages (51%). The majority were employed or studying (74.5%), while 11.8% were retired. The prevalence of hypertension, diabetes, and multimorbidity (≥2 chronic conditions) was 28.4%, 15.7%, and 21.6%, respectively. Half of the participants had mild cases (not hospitalized), 19.6% had moderate cases (requiring hospital oxygen therapy), and 30.4% had severe cases (requiring ICU admission) of acute COVID-19. Those who were hospitalized had an average length of stay of 22 ± 18 days, including 16 ± 14 days in the ICU and 13 ± 11.0 days on mechanical ventilation. On average, the participants had been experiencing adverse physical symptoms of Long COVID for 15 ± 10 months. The most prevalent adverse physical symptoms were fatigue (87.1%), dyspnea (81.2%), post-exertional malaise (58.5%), and myalgia (49.5%). Additionally, the participants reported insomnia (35.5%), memory problems (29.4%), cough (12.7%), anosmia/ageusia (10.8%), mental health issues (anxiety/depression; 7.8%), and hair loss (4.9%). Regarding vaccination status, 67.0% were fully vaccinated.
Movement behaviors revealed that participants spent 10.2 ± 2.0 h/day in sedentary time, 4.8 ± 1.5 h/day in light physical activity, and 113.7 ± 87.2 min/week in MVPA; 29.5% (n = 26) met the current physical activity guidelines, i.e., at least 150 min/week of MVPA. Additionally, their average step count was 7496 ± 4309 steps/day. Regarding functional capacity, participants covered 518 ± 83 m on the 6MWT, with 72.4% classified as below the estimated value for age, sex, and body mass index. They also performed 13.3 ± 3.1 repetitions on the 30-s CST and completed the TUG in 6.6 ± 1.0 seconds. All participants successfully completed the 6MWT, 30-s CST, and TUG without experiencing any serious adverse events. However, one participant was unable to complete the 6MWT due to dyspnea.
Table 1 details movement behaviors and functional capacity in individuals with Long COVID, categorized according to the presence of different adverse symptoms. Those with fatigue (no = 12050 ± 5636 steps/day; yes = 6707 ± 3570 steps/day) and post-exertional malaise (no = 9271 ± 5630 steps/day; yes = 5993 ± 2500 steps/day) exhibited a lower number of steps per day compared to their counterparts without these adverse physical symptoms (p < 0.05). Additionally, individuals experiencing dyspnea performed worse on the TUG (no = 6.1 ± 0.8 seconds; yes = 6.7 ± 1.0 seconds) and had a lower functional score (no = 1.1 ± 1.5 a.u..; yes = 0.1 ± 1.7 a.u.) compared to those without this specific symptom (p < 0.05).
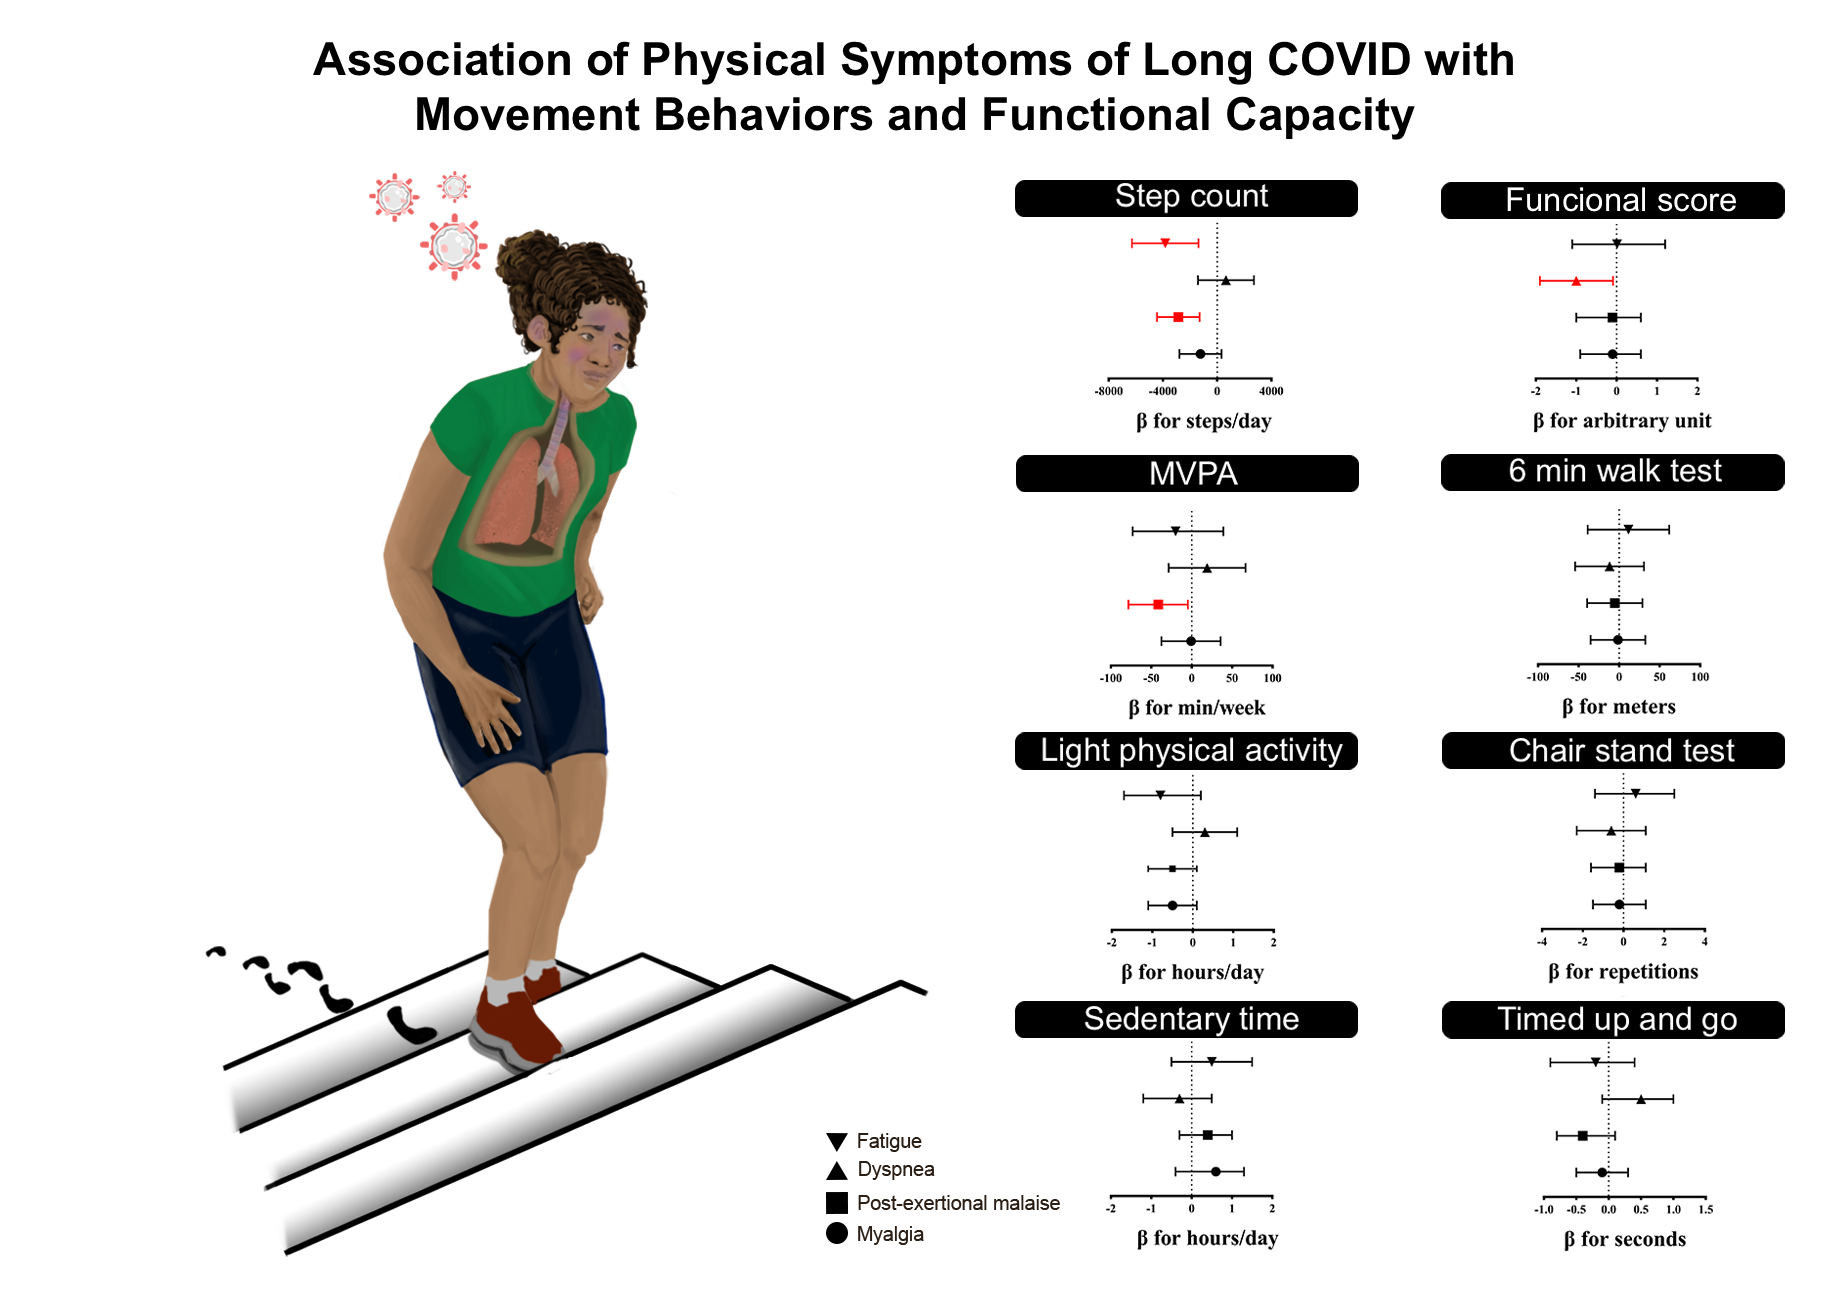
Table 2 displays the adjusted associations of adverse physical symptoms and movement behaviors in individuals with Long COVID. Fatigue (β = -3827 steps/day; 95% CI = -6280 to -1375) and post-exertional malaise (β = -2864 steps/day; 95% CI = -4434 to -1294) showed a negative association with the number of steps per day (p < 0.05), while post-exertional malaise (β = -41.4 min/week; 95% CI = -78.2 to -4.6) was also negatively associated with MVPA (p < 0.05). No association was found between dyspnea and myalgia with sedentary time, light physical activity, MVPA or steps count (p > 0.05).
Table 3 displays the adjusted associations of adverse physical symptoms and functional capacity in individuals with Long COVID. Only dyspnea (β = -0.1 steps/day; 95% CI = -1.0 to -0.6) showed a negative
Table 1
Movement behaviors and functional capacity of individuals with Long COVID, categorized according to the presence of different adverse symptoms
| Physical symptoms | Sedentary time (h/day) | Light PA (h/day) | MVPA (min/week) | Step Count (steps/day) | 6MWT (meters) | CST (repetitions) | TUG (seconds) | Functional score (a.u.) |
| Fatigue | | | | | | | | |
| No (n = 12 *; 13 #) | 9.3 ± 1.8 | 5.0 ± 1.6 | 126.5 ± 112.7 | 12050 ± 5636 | 538.6 ± 110.5 | 13.5 ± 2.5 | 6.5 ± 1.2 | 0.6 ± 2.2 |
| Yes (n = 77 *; 83 #) | 10.4 ± 2.0 | 4.7 ± 1.5 | 112.1 ± 83.7 | 6707 ± 3570 | 514.2 ± 77.9 | 13.3 ± 3.2 | 6.6 ± 1.0 | 0.1 ± 1.8 |
| Dyspnea | | | | | | | | |
| No (n = 14 *; 14 #) | 10.4 ± 1.4 | 4.2 ± 1.4 | 97.3 ± 90.6 | 7247 ± 3162 | 533.0 ± 99.2 | 14.2 ± 2.5 | 6.1 ± 0.8 | 1.1 ± 1.5 |
| Yes (n = 72 *; 80 #) | 10.3 ± 2.1 | 4.9 ± 1.5 | 117.9 ± 85.5 | 7321 ± 4180 | 516.3 ± 78.9 | 13.2 ± 3.2 | 6.7 ± 1.0 | 0.1 ± 1.7 |
| Post-exertional malaise | | | | | | | | |
| No (n = 34 *; 36 #) | 10.0 ± 2.3 | 5.1 ± 1.7 | 138.1 ± 100.1 | 9271 ± 5630 | 525.2 ± 85.4 | 13.4 ± 3.4 | 6.8 ± 1.2 | 0.2 ± 2.0 |
| Yes (n = 49 *; 51 #) | 10.6 ± 1.8 | 4.5 ± 1.4 | 103.1 ± 78.6 | 5993 ± 2500 | 509.4 ± 84.3 | 13.3 ± 3.0 | 6.5 ± 1.0 | 0.1 ± 1.8 |
| Myalgia | | | | | | | | |
| No (n = 43 *; 41 #) | 10.1 ± 2.1 | 5.1 ± 1.6 | 116.2 ± 95.4 | 8086 ± 5090 | 516.4 ± 80.5 | 13.6 ± 3.5 | 6.7 ± 1.1 | 0.3 ± 2.1 |
| Yes (n = 39 *; 43 #) | 10.7 ± 1.9 | 4.6 ± 1.5 | 109.9 ± 78.9 | 6966 ± 3365 | 512.3 ± 89.7 | 13.2 ± 3.0 | 6.7 ± 1.0 | -0.1 ± 1.5 |
| Note: PA = physical activity; MVPA = moderate-to-vigorous physical activity; 6MWT = six-minute walk test; CST = chair stand test; TUG = timed up and go; Values are expressed as mean ± standard deviation. Bold values indicate statistical difference when compared to individuals without symptoms (p < 0.05; independent t-test). Functional score was calculated by summing the z-scores of all tests, adjusted for sex. * = Individuals with movement behaviors data; # = Individuals with functional capacity data. |
association with the functional score (p < 0.05). Finally, no association was found between fatigue, post-exertional malaise and myalgia with six-minute walk test, 30-s chair stand test and timed up and go (p > 0.05).
Table 2
Adjusted associations between adverse physical symptoms and movement behaviors in individuals with Long COVID
| Physical symptoms | Sedentary time (h/day) | Light PA (h/day) | MVPA (min/week) | Step Count (steps/day) |
| Fatigue | | | | |
| No (n = 12) | Reference | Reference | Reference | Reference |
| Yes (n = 77) | 0.5 (-0.5; 1.5) | -0.8 (-1.7; 0.2) | -19.9 (-73.0; 39.2) | -3827 (-6280; -1375) |
| Dyspnea | | | | |
| No (n = 14) | Reference | Reference | Reference | Reference |
| Yes (n = 72) | -0.3 (-1.2; 0.5) | 0.3 (-0.5; 1.1) | 19.1 (-28.5; 66.6) | 649 (-1416; 2714) |
| Post-exertional malaise | | | | |
| No (n = 34) | Reference | Reference | Reference | Reference |
| Yes (n = 49) | 0.4 (-0.3; 1.0) | -0.5 (-1.1; 0.1) | -41.4 (-78.2; -4.6) | -2864 (-4434; -1294) |
| Myalgia | | | | |
| No (n = 43) | Reference | Reference | Reference | Reference |
| Yes (n = 39) | 0.6 (-0.4; 1.3) | -0.5 (-1.1; 0.1) | -0.7 (-37.4; 35.9) | -1226 (-2780; 328) |
| Note: PA = physical activity; MVPA = moderate-to-vigorous physical activity. Values are expressed in β and its 95% confidence interval. Bold values indicate statistical difference when compared to the reference group (p < 0.05). The analyses were adjusted for age, sex, income, multimorbidity, length of stay in the ICU, study center, and accelerometer wear time. VIF < 3.5 for all variables. |
Table 3
Adjusted associations between adverse physical symptoms and functional capacity in individuals with Long COVID
| Physical symptoms | 6MWT (meters) | CST (repetitions) | TUG (seconds) | Functional score (a.u.) |
| Fatigue | | | | |
| No (n = 13) | Reference | Reference | Reference | Reference |
| Yes (n = 83) | 11.6 (-38.7; 61.9) | 0.6 (-1.4; 2.5) | -0.2 (-0.9; 0.4) | < 0.0 (-1.1; 1.2) |
| Dyspnea | | | | |
| No (n = 15) | Reference | Reference | Reference | Reference |
| Yes (n = 80) | -11.8 (-54.4; 30.8) | -0.6 (-2.3; 1.1) | 0.5 (-0.1; 1.0) | -1.0 (-1.9; -0.0) |
| Post-exertional malaise | | | | |
| No (n = 36) | Reference | Reference | Reference | Reference |
| Yes (n = 51) | -5.3 (-39.4; 28.7) | -0.2 (-1.6; 1.1) | -0.4 (-0.8; 0.1) | -0.1 (-1.0; 0.6) |
| Myalgia | | | | |
| No (n = 41) | Reference | Reference | Reference | Reference |
| Yes (n = 43) | -1.4 (-35.1; 32.3) | -0.2 (-1.5; 1.1) | -0.1 (-0.5; 0.3) | -0.1 (-0.9; 0.6) |
| Note: 6MWT = six-minute walk test; CST = chair stand test; TUG = timed up and go; a.u. = arbitrary units. Values are expressed in β and its 95% confidence interval. Functional score was calculated by summing the z-scores of all tests, adjusted for sex. Bold values indicate statistical difference when compared to the reference group (p < 0.05). The analyses were adjusted for age, sex, income, multimorbidity, length of stay in the ICU, study center, and accelerometer wear time. VIF < 3.5 for all variables. |