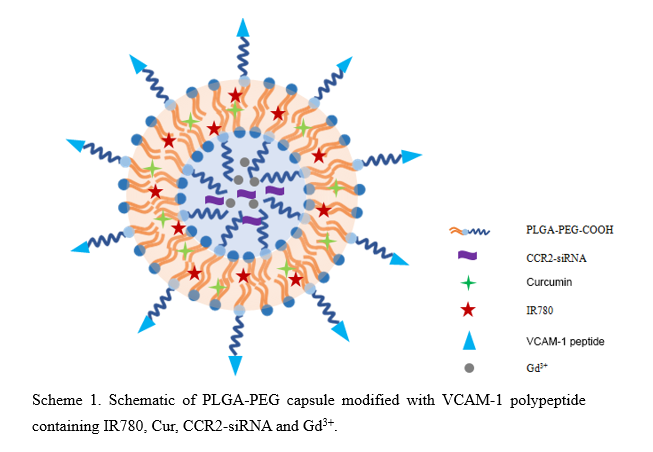
Fabrication and characterization of vesicles
Efficient solubilization is critical for hydrophobic Cur to reach a sufficient dose in the atherosclerotic lesion [15, 16]. We, therefore, generated PCSV by encapsulating the hydrophobic Cur into the hydrophobic capsule of PLGA using a micro-emulsion method. In contrast to the saturation solubility of Cur in water (only ≈ 6 µg / mL), we were able to load 117 µg of Cur into 1 mL of PLGA aqueous solution (117 µg / mL), thereby dramatically increasing its solubilization (more than 15 times greater than in water). As shown in Table S2, DLE and DLC of PCSV were 0.9% and 58.5%, respectively. For CCR2-siRNAs, DLE and DLC of PCSV were 0.228% and 100%, respectively.
Next, we first examined the hydrodynamic diameters (Dh) of BPC, PCS and PCSV by DLS. As shown in Fig. 1, encapsulating IR780, CCR2-siRNA, Cur, and Cd3+ increased the mean Dh from 172.5 ± 8.6 nm (BPC, Polydispersity index (PDI): 0.208) to 191.4 ± 11.3 nm (PCS, PDI: 0.125). This increase in Dh was consistent with the embedding of the particles with inner water phase. The Dh of PCSV was close to that of PCS, suggesting that the peptide coupling the surface of particles had little effect on particle size. Moreover, PCSV showed a relatively constant hydrodynamic diameter after long-term storage at room temperature, indicating its favorable stability properties (Fig.S3). This good stability of nano-carrier in physiological condition was important and beneficial for their in vivo application and intravenous injection [17–19]. In addition, surface zeta potential analysis showed that BPC had a zeta potential of − 20.8 ± 0.8 mV, whereas PCS (− 25.4 ± 1.5 mV) and PCSV (− 38.8 ± 1.7 mV) have lower values (Fig. 1d, e, f). The targeting polypeptide conjugated nano-carriers further decreased the zeta potential, enabling long circulation to the plaque sessions. Since the physiochemical properties of all the nano-carriers in this study were similar, it was reasonable to presume that their ability to target atherosclerotic plaque would be dominated by the targeting ligand.
We further analyzed the morphologies of BPC, PCS and PCSV using TEM. Both nanoparticles showed a uniform sphere morphology. Moreover, they displayed a clear capsule nanostructure without conspicuous interconnection (Fig. 1g, h, i), which confirmed that the W/O/W emulsion nanostructure was successfully prepared. To verify the IR780 encapsulated in the nano-carrier, fluorescent images of BPC, PCS and PCSV was displayed as Fig. 2a. This fluorescent intensity suggested that IR780 were strongly retained on the inside of PCS and PCSV.
We designed drug and siRNA codelivery system, loading drug and siRNA by emulsion methods, which was a classic method for the preparation of nanoparticles [20, 21]. The in vitro release of Cur from the nanoparticles was investigated in PBS (pH 7.4) solution to simulate the physiological environment (Fig. 2b). A fast release of Cur from both nanoparticles was observed in the initial 24 h (> 20%). After 60 h incubation in PBS, 44.2% of Cur was released from PCS nanoparticle, while 39.8% of Cur was released from the PCSV nanoparticle. When compared with the PCS nanoparticles, PCSV nanoparticles showed a slightly slower Cur release profile, which may be ascribed to the additional polypeptide in the outer sphere acting as a diffusion barrier [21].
The release curves of siRNA from PCS and PCSV nanoparticles were similar, and these were because the siRNA were encapsulated in the inner layer of the capsules, which could be extended released readily [22]. In contrast to Cur release profiles, there was a considerable delay in the release of siRNA from the PCS and PCSV, especially during the first 4 h, during which almost none of the loaded siRNA was released (Fig. 2c). After 60 h, only 18.9% and 17.8% of siRNA loaded in the PCS and PCSV had been released, respectively. This delayed release of siRNA was likely due to the fact that siRNA was loaded only in inner aqueous phase. These results demonstrated that the design of nanoparticles with spatially segregated Cur in the outer oil layer and siRNA in the aqueous core was verified for successfully prepared.
In vitromacrophage inhibition and endothelial cell adhesion of nanoparticles
The cytotoxicity of the nanoparticles was evaluated in the macrophages. As shown in Figure 2d, all nanoparticles showed a dose-dependent cytotoxicity in RAW264.7 cells. To evaluate the in vitro cytotoxicity quantitatively, we calculated the IC50 of the nanoparticles, defined as the drug concentration required to kill 50% of the incubated cells. BPC, which was not loaded with Cur, did not show any cytotoxic effect (with an IC50 of >100 μg/mL) (Fig.S4). As expected, the cytotoxic effect of PCV (IC50: 6.35 μg/mL) did not differ from that of PCSV (6.87 μg/mL). These results suggested that PCV and PCSV were comparable in inhibition of macrophage proliferation. In contrast, at the same dose, the slightly more potent antiproliferative activity of free Cur (IC50: 4.60 μg/mL) might be ascribed to the slower Cur release from PLGA of PCV or PCSV [23].
Moreover, bEnd.3 cells were used to develop the in vitro inflammatory cell model by stimulating with appropriate concentration of TNF-α. The expression level of VCAM-1 was gradually increased with the increase in TNF-α concentration [13, 24]. In order to examine the targeting adhesion of these nanoparticles to the inflammatory cells, bEnd.3 cells were pre-incubated with TNF-a at a concentration of 3 ng / mL for 12 h then further incubated with PCSV for an additional 1 h. Fig.3 showed representative bright-field micrographs of these nanoparticles bound to cells, revealing that these targeted nanoparticles can bind the TNF-α-stimulated cells. Importantly, the number of nanoparticles bound to the stimulated cells increased with the addition of TNF-α, which indicated that the cell affinity of nanoparticles to the stimulated cells can infer the cell inflammation degree.
Organ-level distribution of PCV and PCSV
As silencing of CCR2, the monocytic chemokine receptor responsible for migration of the inflammatory monocyte subset to sites of inflammation can be realized by using siRNA technology, siRNA silencing of CCR2 (siCCR2) significantly can attenuate receptor protein expression in circulating and splenic monocytes [14]. We investigated the in vivo MRI efficacy of PCV and PCSV via comparison of scans obtained pre-injection and at treatment with agent injected into the tail vein of atherosclerotic mice on day 4. MRI revealed pronounced and heterogeneously distributed hyper-intense areas throughout plaque-rich regions in the abdominal aorta after administration of nanoparticles. A representative example of the results of imaging ApoE-/- mice with PCV and PCSV were shown in Fig.4a. A clear and significant enhancement of image density was observed in the aorta wall post-injection in PCV and PCSV, indicating that nanoparticles attached with VCAM1 binding peptide was successful in targeting the plaques and enhancing them in MR images [25-27]. By comparison, the MR signal of PCSV was lowered than that of PCV after administration of nanoparticles. It indicated that intervention of siRNA lowered the MRI signal in association with attenuated monocyte recruitment. Therefore, the aortic section of siCCR2 treated ApoE-/-mice had decreased MR signal. Adoption of the medical image-analysis software package eFilm allowed the signal intensity to be ascertained and the percent change in normalized enhancement ratio post-injection to be calculated. The results of this analysis were displayed in Fig.4b. The data confirmed the visual impression that PCV was an effective agent for the enhancement of images of the wall of the aorta of ApoE-/- mice, giving an enhancement of 11%, while that of PCSV was only 6%, which showed that the PCV was targeted more effectively to atherosclerotic lesions [28].
We also monitored the organ-level distribution of PCV and PCSV by utilizing IR780-labeled capsules. ApoE-/- mice received treatment of PC and PCV on day 4, followed by the performance of in vivo NIRF imaging of the animals (Fig.4c) and ex vivo NIRF imaging of the excised organs (Fig.4d). For PCSV group, we observed stronger signals in the liver and lung and ex vivo imaging analysis revealed the most-intense IR780 fluorescence in the liver among all of the organs. Other organs with a noticeable accumulation of PC were the lung, kidney, spleen. For the PCV group, in vivo and ex vivo NIRF imaging data also showed strong fluorescence in the liver, lung, and spleen. Our NIRF imaging data suggested the more accumulation of PCV in heart and aorta than that of PCSV (Fig.4e), which reconfirmed decrease of VCAM1 in the PCSV group. As VCAM1-binding peptide conjugation enabled high targeting capability of the nanoprobe to the inflamed endothelium expressing VCAM1 in a high plaque regions [29], the decreased endothelium expressing VCAM1 attenuated targeting of peptide, thus lowered the intensity of NIRF imaging. The results of MR and FI all implied that there was a more favorable therapeutic effect in PCSV compared with PCV group in the process of treatment.
In Vivo target atheroprotective effect
We detected the composition of atherosclerotic plaque in aortic root sections by immunohistochemistry staining. The results showed that the atherosclerosis plaque in the PCV and PCSV group disappeared on the whole, and no plaque rupture was observed. In contrast, other groups (control and Cur) displayed obvious atherosclerosis plaque and plaque rupture was observed in saline-treated groups (Fig.5a).
The necrotic areas in the aortic roots were detected by toluidine blue staining. As shown in Fig.5b, the control group exhibited large necrotic areas with substantial cholesterol crystals, indicating advanced lesions. After treatment with Cur, PCV and PCSV, the necrotic area was significantly decreased. Quantitative analysis revealed that, compared to the control group, the average necrotic area was decreased to 14.5%, 7.3%, and 5.2% in response to free Cur, PCV, and PCSV treatment, respectively (Fig.5c). The increased collagen produced by hyperplasia smooth muscle cells leads to the enlargement of the plaque areas, which could further narrow the vascular lumen [30, 31]. We tested the content of collagen in plaque areas using Masson’s trichrome staining (Fig.5d). Compared to the control, free Cur, PCV, and PCSV effectively decreased the content of collagen. Quantitative analysis revealed that, compared to the control group, the average content of collagen was decreased to 20.5%, 14.3%, and 11.2% in response to free Cur, PCV, and PCSV treatment, respectively (Fig.5e). Therefore, PCV and PCSV all exhibited preferable therapy on the plaque in ApoE-/-mice by reducing necrotic area and collagen deposition. Due to intervention of siRNA, PCSV can achieve more favorable therapeutic effect, leading to a more decreased plaque index [32].
Biosafety Assessment
To assess biosafety, adverse effects were studied after treatment for one month. There was less 10% body weight loss in free Cur, while no significant difference in body weight of mice was observed in PCV and PCSV groups (Fig.6a). The mice receiving various treatments showed no significant change in the weight compared to that of untreated control, which showed that mice exhibited tolerance to all the treatments. Moreover, as the nano-capsules accumulated in the liver, the effect of liver was needed to be verified. No obvious difference in the liver index of suggested no significant toxicity, and the liver index of the group treated with PCV gradually returned, which was closed to normal level. The blood biochemical assays of alanine aminotransferase (ALT) and aspartate aminotransferase (AST), were at normal levels, which indicated that the functions of the liver were not impaired by the treatment (Fig.6b,c) [24, 31]. Therefore, PCSV did not induce significant adverse effects in long-term treatment, indicating its potential as a safe candidate for chronic vascular disease therapy. The results of hematoxylin-eosin (H&E) staining showed that no noticeable pathological changes could be found in the main organs, which further confirmed their biocompatibility (Fig.6d).
