3.1 Participants and characteristics
A total of 117 patients, with a mean age of 54 ± 14 years and 84% (98 of 117) being male, were analyzed in this study. Among the patients, 32.5% (n=28) had a BMI of <24, whereas 64.9% (n=76) had a BMI of≥24. The BMI data of 3 patients were lost and not included in the statistics. Furthermore, 62.4% of patients had a history of hypertension, with 49.6% having a BMI of ≥24 and 11.1% having a BMI of <24. AD was present in 78 (67%), IHM in 28 (24%), and AA in 11 (9%) patients. The baseline characteristics of the study cohort are detailed in Table S1.
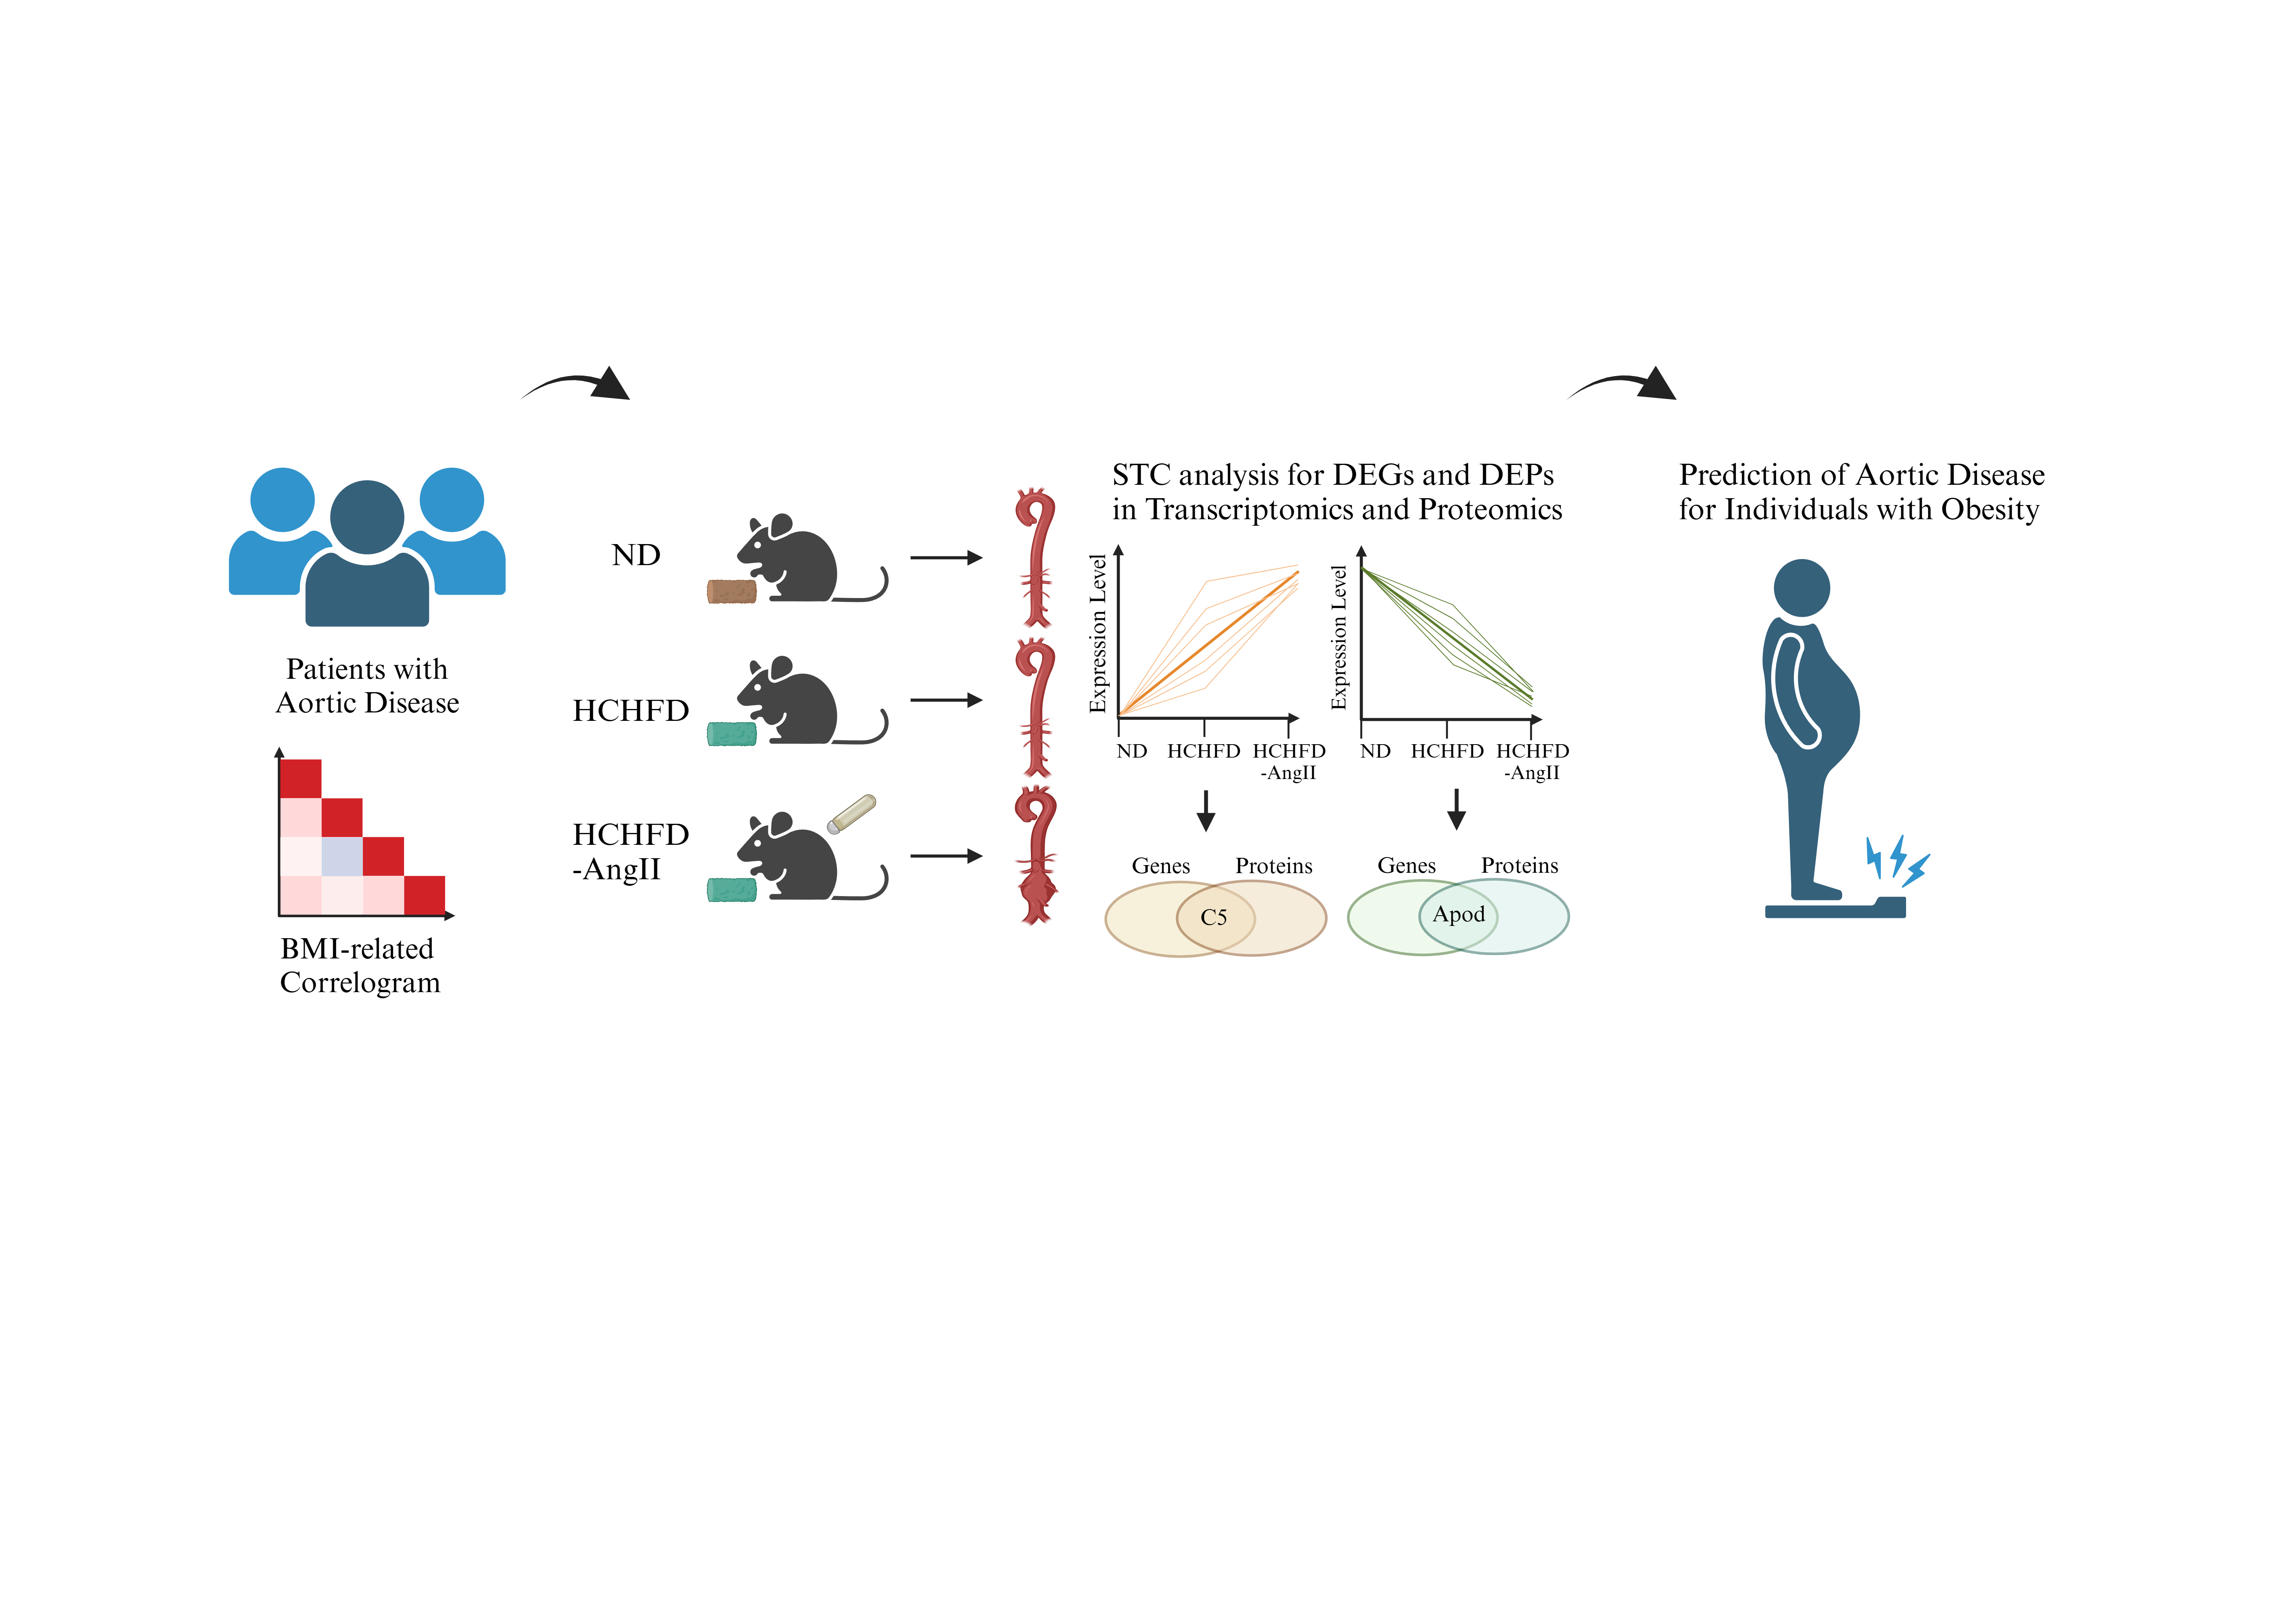
A correlation analysis was performed on general characteristics in patients with aortic disease (Fig. S1; positive correlations in red and negative correlations in blue) for significant associations between variables (P<0.05). BMI exhibited a significant positive correlation with gender, SBP, DBP, postoperative hospitalization stay, and death, whereas BMI showed a significant negative correlation with age.
3.2 BMI-related changes
After excluding three patients with missing BMI data and one patient classified as emaciated (BMI<18.5), the remaining 113 patients were categorized into different BMI groups. The clinical data (Table 1 and Table S2) were subsequently analyzed.
Significant differences were observed in the proportion of males, males, SBP, DBP, and age among the groups. In the normal BMI group, patients were older with a mean age of 61 years. As the BMI increased, the age of onset tended to be younger, with the average age of the obese group being 47 years (Table 1). There were no significant differences in the proportion of patients with diabetes, smoking, and drinking. Deaths occurred in both overweight and obese groups, but not in the normal BMI group (Table S2).
Variables with significant differences, including leukocyte, neutrophil, monocyte, lymphocyte, globulin, albumin-globulin ratio, triglyceride, high-density lipoprotein cholesterol, hemoglobin, creatinine, and uric acid are shown in Table 1. Other variables are included in Table S2.
To summarize the predictors associated with clinical outcomes in the patient cohort, a multiple linear stepwise regression analysis was conducted. The number of days spent in the hospital post-surgery was considered the dependent variable, and general data and clinical test indicators served as independent variables. The results of the regression analysis revealed a significant positive correlation with BMI (B = 1.646, P < 0.05) and a negative correlation with A/G (B = -24.320, P < 0.05), as depicted in Table 2.
3.3 Effects of obesity-hypertension on behaviors and vascular morphology of mice
Clinical data indicated that 64.9% of patients with aortic disease were overweight or obese, a factor strongly linked to poor clinical outcomes. To investigate the direct impact of obesity on aortic disease, we established three mouse models: one for obesity, one for obesity-related hypertension, and one for hypertension alone. At the end of the experiment, the weight, blood pressure, serum lipid profiles, and aortic diameters of mice were measured.
Mice in the HCHFD or HCHFD-AngII groups exhibited a significant increase in body weight compared to the ND group (Fig. 1a). Treatment with AngII did not lead to noticeable changes in food intake or body weight. Additionally, HCHFD contributed to elevated blood pressure levels in the mice, with SBP and DBP slightly higher in model mice than the control ND-fed mice (Fig. 1b and 1c). Blood pressure increased more in the HCHFD-AngII group than in the HCHFD alone group. Moreover, subcutaneous infusion of AngII significantly increased the SBP and DBP.
The serum lipid profiles of mice were significantly influenced by HCHFD. In comparison to the ND group, TC levels were notably elevated in both the HCHFD and HCHFD-AngII groups (Fig. 1i). Conversely, the TG level decreased in the HCHFD-AngII group compared to the HCHFD and ND-AngII groups (Fig. 1j). Interestingly, there were no significant differences in LDL-C and HDL-C levels among all groups (Fig. 1k and 1l).
The AngII infusion model is commonly used for studying AA[14]. To investigate the effects of obesity on aortic injury, echocardiography was performed to measure the diameter of the thoracic and abdominal aorta. Subsequently, the aortas were isolated and fixed for HE and EVG staining to assess aortic elastic fiber tears and dilation. After 4 weeks of AngII treatment, there was an increase in the maximal diameters of the ascending and abdominal aorta (Fig. 1d and 1e). AAAs only developed under HCHFD-AngII treatment (Fig. 1g and 1h). Representative macroscopic histological images of the aorta demonstrated the induction of AAAs by HCHFD-AngII treatment (Fig. 2a). HE staining of the abdominal aorta revealed thickening of the aortic media and infiltration of inflammatory cells in the arterial adventitia. EVG staining showed disruption of the elastic lamina (Fig. 2b and 2c).
3.4 Identification of DEGs in obesity-hypertension mice
A non-target global gene expression analysis was conducted to investigate the impact of obesity and hypertension on aortic tissue mRNA expression in mouse models. DEGs were identified, and Principal Component Analysis demonstrated distinct variations among the three experimental model groups (Fig. S2a). Genes meeting the criteria of log2|FC|>1 and P<0.05 were considered significantly differentially expressed between groups, with detailed information provided in Fig. S2b. Heatmap analysis based on normalized Z score was performed to assess the clustering patterns among samples (Fig. S3).
A progressive trend toward compounded injury due to obesity and hypertension was observed across the ND, HCHFD, and HCHFD-AngII groups. Trend analysis (STC) was employed to identify profiles in gene abundance across gradient-based samples, revealing eight distinct trends in gene expression (Fig. 3a).
Various genes were included in these significant profiles. Genes exhibiting continuous increase or decrease in profile 0 (51 genes) or profile 7 (522 genes) were further analyzed for functional enrichment using KEGG to elucidate their properties and potential biological relevance. Notably, two common pathways related to complement and coagulation cascades and prion disease were among the top 20 enrichment pathways (Fig. 3b, 3c, and Table S3).
3.5 Proteomics analysis
To investigate differences in serum protein expression in response to obesity or hypertension, we adopted a DIA-MS-based quantitative proteomics approach to analyze changes in ND, HCHFD, or HCHFD-AngII groups. A total of 611 quantified proteins were identified across all three groups for differential abundance analysis. Applying a screening threshold for DEPs, we found 123 DEPs (53 upregulated and 70 downregulated) in HCHFD and 171 DEPs (51 upregulated and 120 downregulated) in HCHFD-AngII compared to the ND group. Additionally, 69 DEPs (54 upregulated and 15 downregulated) were identified in HCHFD-AngII compared to HCHFD (Fig. S2c).
Trend analysis revealed eight distinct patterns in protein abundance (Fig. 3d). Further analysis focused on proteins in profile 0 (48 proteins) and profile 7 (22 proteins) for functional enrichment using KEGG. Notably, two common pathways i.e., African trypanosomiasis and estrogen signaling pathway, were among the top 20 enrichment pathways (Fig. 3e, 3f, and Table S4).
3.6 Integrated KEGG pathway enrichment analysis of aortic DEGs and serum DEPs
To investigate the molecular markers in the aortic tissue and serum of mice, we analyzed the top 20 enrichment pathways from transcriptomics profile 0 and proteomics profile 0, revealing 16 common DEGs/DEPs involved in complement and coagulation cascade signaling. These included genes such as C5, C6, C8a, and F7 (Table 3). Subsequent integrated analysis of transcriptomics profile 7 and proteomics profile 7 identified 4 shared enrichment KEGG pathways, such as hematopoietic cell lineage and chemokine signaling pathway (Fig.6b and Table 4). Further examination of the intersection of DEGs and DEPs in the aorta and serum led to the identification of 4 common genes with similar expression trends: C5, PIGR, apoD, and RIKEN cDNA 2610524H06 gene (env) (Figure 4a).
3.7 Validation of the candidate marker proteins in serum
To evaluate the clinical relevance of common DEPs, C5, PIGR, and apoD expression levels were analyzed in serum samples from individuals with obesity, AD, and healthy controls using ELISA. Env, a group of predictive genes, has not yet been studied in humans. Serum C5 levels were significantly elevated in both obese and AD patients compared to healthy controls, with no significant difference between obese and AD groups (Figure 4b). apoD levels were lower in obese and AD patients than in healthy controls and slightly higher in AD patients than in obese patients (Figure 4c). PIGR levels did not show significant differences across the groups (Figure 4d).
Receiver operating characteristic (ROC) curve analysis was performed to assess the predictive value of C5 and apoD for AD. The optimal cut-off for C5 was determined to be 369.0, with a sensitivity of 94.59% and specificity of 95% (AUC = 0.9608, 95% CI 0.9129–1.000, P < 0.0001) (Figure 4e). apoD had a cut-off of 38.83, with a sensitivity of 51.35% and specificity of 100% (AUC = 0.7162, 95% CI 0.5857-0.8467, P = 0.0075) (Figure 4f). Both C5 and apoD serum levels showed promising clinical predictive value and potential applications.