3.1. Synthesis of ZnONPs
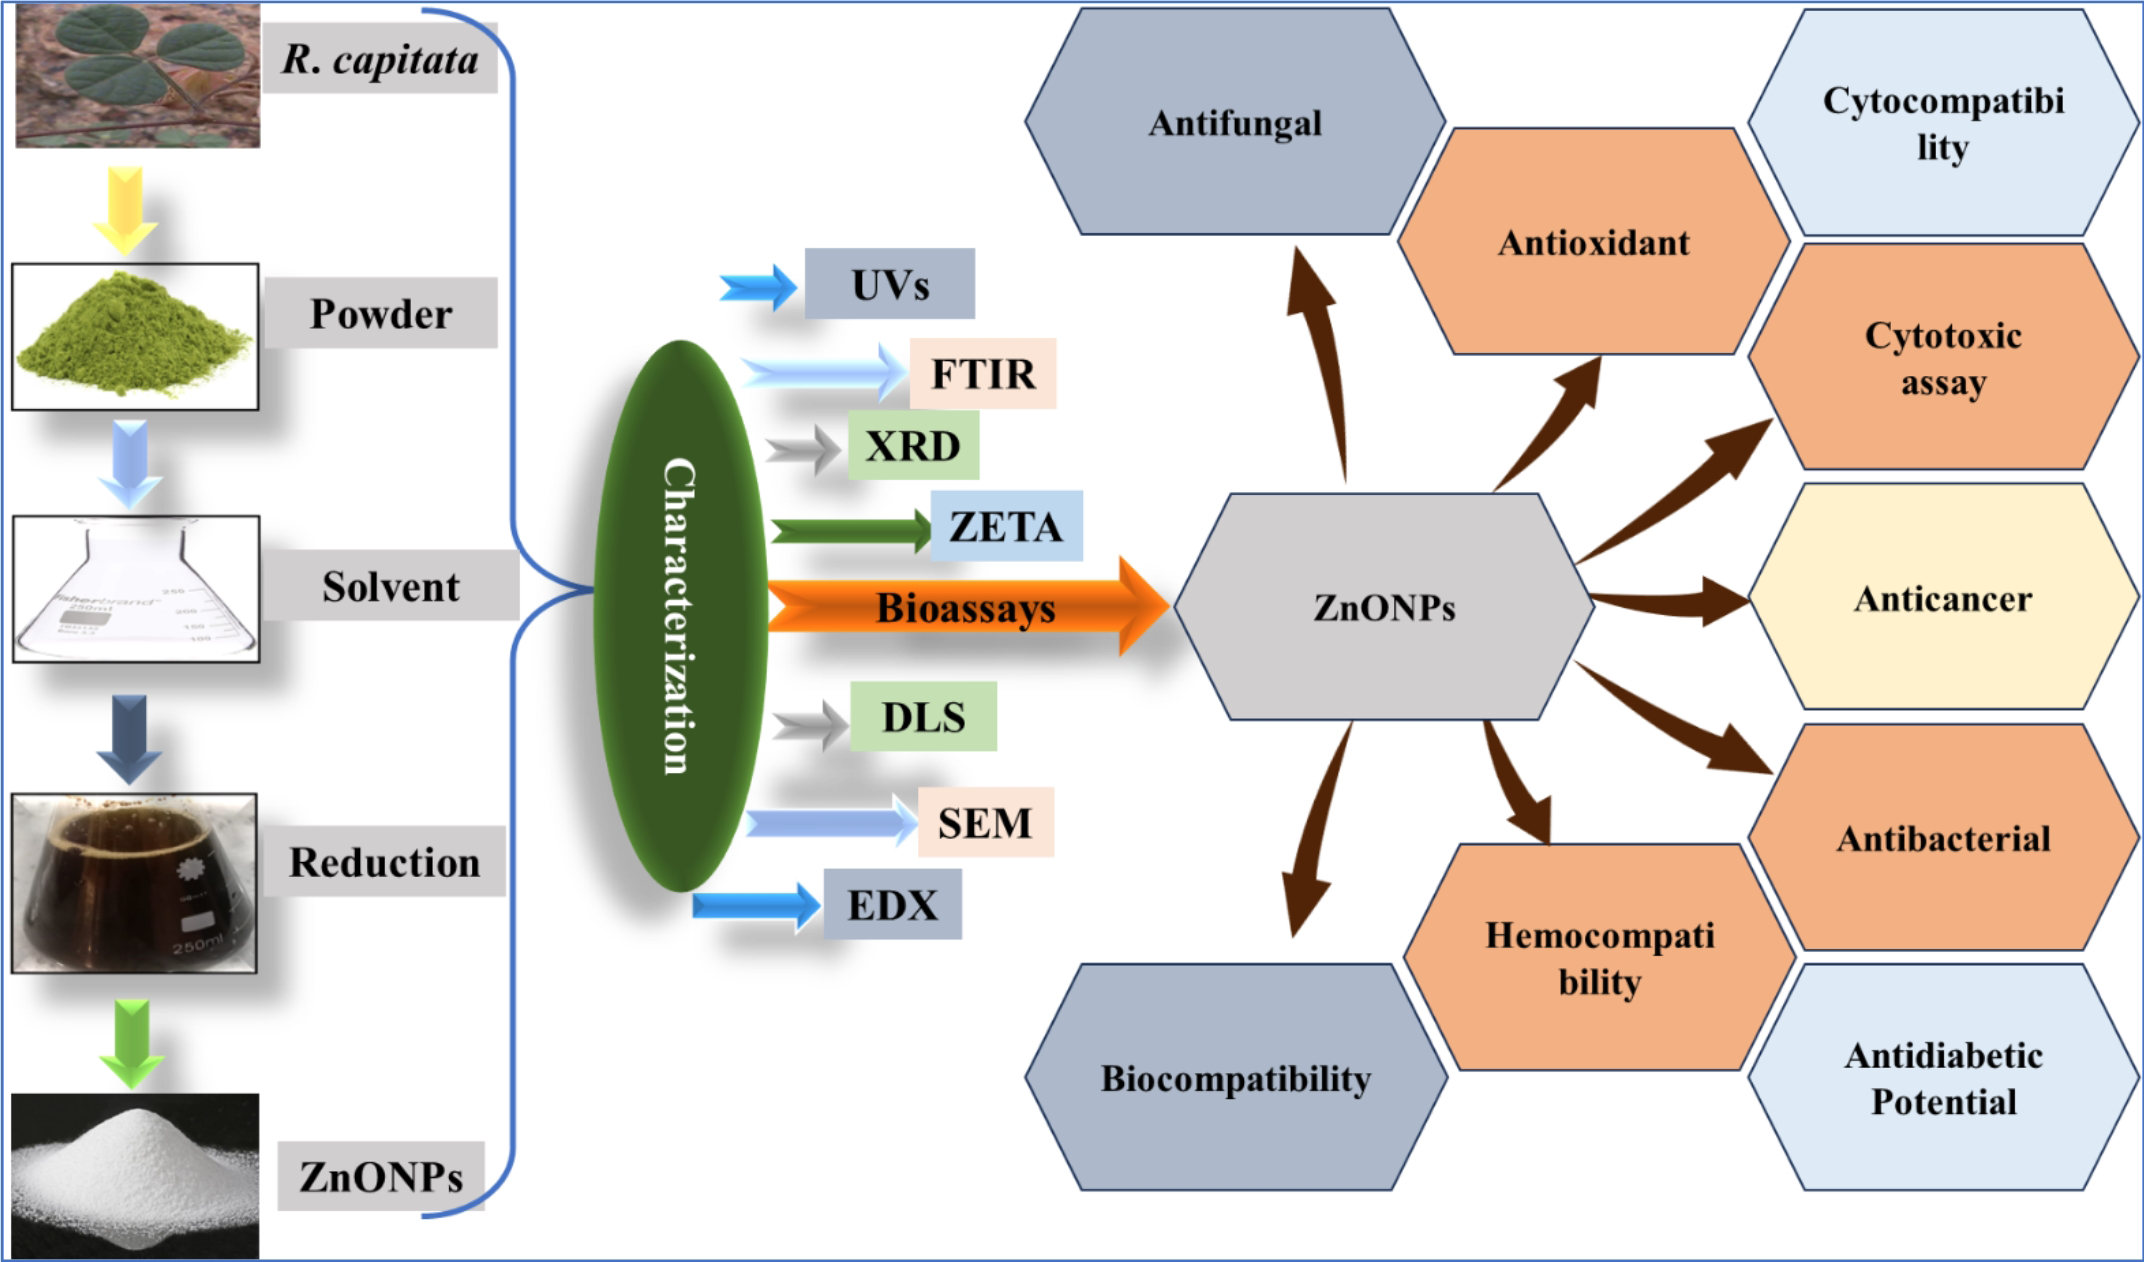
In the present research, extracts from RC leaves were used as stabilizing agents and bio-reductants to produce ZnONPs. In the extracts of R. capitata, various Biomolecules (Figure.2) were screened out (Table 1). The observable shift in color from light brown to yellow white serves as a clear indicator of ZnONPs production. This color alteration is a consequence of specific optical properties, primarily arising from surface plasmon vibrations. A broad spectrum of characterization approaches, including UV spectroscopy, FT-IR, XRD, SEM, EDX DLS, and Zeta potential analysis, were used to thoroughly assess the biocompatible nature of the yielded ZnONPs.
Table. 1. The basic phytochemical evaluation of R. capitata.
|
S/No
|
Secondary Metabolites
|
Indicators
|
|
1
|
Phenol
|
+++
|
|
2
|
Flavonoids
|
+++
|
|
3
|
Terpenoids
|
+++
|
|
4
|
Saponins
|
+++
|
|
5
|
Tannins
|
+++
|
|
6
|
Steroids
|
+++
|
|
7
|
Glycosides
|
_
|
|
8
|
Phytosterol
|
++
|
|
9
|
Coumarins
|
+
|
|
10
|
Proteins
|
++
|
|
11
|
Carbohydrates
|
+++
|
|
12
|
Anthocyanin&
BetaCyanin
|
_
|
|
13
|
Phlobatannins
|
_
|
|
14
|
Quinone
|
++
|
|
15
|
Fats and Fixed Oils
|
+++
|
3.2. UV-Vis Spectrophotometry of RC@ZnONPs
A significant aspect of our study involved the utilization of UV-Vis spectrophotometry to monitor and characterize the bioreduction process. The effective reduction of the precursor solution to ZnONPs was evident through observable changes in color as the aqueous extracts were introduced. A visible transition from a lighter brown hue to a whiter brown shade indicated a pronounced increase in the efficiency of the bioreduction process. By scanning the reaction mixture over a range of wavelengths (200 to 700 nm), Particularly noteworthy were the absorbance peaks detected within the 377 nm wavelength. These peaks aligned well with the characteristic Surface Plasmon Resonance (SPR) range associated with ZnONPs confirming the successful synthesis of ZnONPs (Figure. 3 (A). Importantly, the absence of any apparent blue or red shifts at the peak point emphasized that the nanoparticles exhibited a consistent and steady SPR behavior. Remarkably, our research outcomes, as derived from the understandings provided by UV-Vis spectroscopy, were found to align agreeably with the conclusions drawn from an earlier study [30,34,35]. This consistency across studies underscores the strength and validity of our findings.
3.3. X-ray diffraction spectroscopy of RC@ZnONPs
XRD was used to assess the crystalline properties of ZnONPs. A thorough X-ray diffraction study was incorporated on annealed biogenic ZnONPs at a temperature of 100 °C. The resulting XRD pattern exhibited distinct Bragg peaks that precisely matched the expected crystalline reflections from the JCPDS pattern 00-036-1451, illustrated in Figure 3 (B). These peaks were observed at specific angles: 22.62 (012°), 018 (60.16°), 024 (55.07°), 030 (65.54°), 104 (36.08°), 110 (40.33°), 113 (50.91°), 116 (57.81°), and 214 (62.63°), as elaborated in Table 2. The size of the ZnONPs was determined to be approximately 32.15 nm using Debye Scherrer's equation. These findings align with previous research conducted by [36,37], reinforcing the reliability of the results. It is noteworthy that the presence of Bragg peaks consistent with the pure phase of ZnO signifies the complete crystallinity of the biogenic ZnONPs.
Table: 2. (2 theta) value and Bragg peak of RC@ZnONPs
|
S. No
|
2 theta value
|
Bragg peak
|
|
1
|
22.62
|
012
|
|
2
|
36.08
|
104
|
|
3
|
40.33
|
110
|
|
4
|
50.91
|
113
|
|
5
|
55.07
|
024
|
|
6
|
57.81
|
116
|
|
7
|
60.16
|
018
|
|
8
|
62.63
|
214
|
|
9
|
65.54
|
030
|
3.4. FTIR of RC@ZnONPs
The molecular vibrations and the existence of functional groups or biomolecules that are essential to the synthesis and stability of ZnONPs were examined using FTIR spectroscopy. Different absorption bands that correspond to different chemical vibrations and functional groups were seen in the FTIR spectra, as shown in Figure 4. The stretching vibrations of the OH plane bending were shown by the absorption bands seen at 662.2 cm-1. Similarly, the absorption bands at 839.93 cm-1, which correlate to the bending and rocking vibrations of molecules containing carbon and hydrogen, were used to determine the presence of a C-H bond. The absorption bands at 927.43 cm-1 were used to identify the stretching vibrations of C-O. Moreover, the absorption bands at 1013.93 cm-1, which correlate to the stretching vibrations of carbon-oxygen bonds, clearly showed the presence of a C-O-C bond in the sample. The C-O-C bond was linked to the absorption band at 1107.77, and the peak indicated the stretching vibrations of the CN amide III bond at 1253.30 cm-1. Additionally, the stretching of C-O inorganic carbonate was found at 1422.90 and the CH aliphatic bending group was observed at 1370.21 cm-1. Furthermore, the Diketones functional groupings have been determined at 1535.24–1640.78. In the same way at 2865 C-H alkane medium to strong, at 3027.24 C=C bond and 3629.2 O-H strong bond of alcohol were observed. This absorption feature provides an understanding of the presence of compounds containing variant functional groups. The information gathered from these FTIR absorption bands was summarized in Table 3, allowing for a comprehensive absorption of the molecular components and functional groups present in the sample under investigation. Our findings are also in good agreement with the earlier reported studies [33,34,35,36,37].
Table. 3. Functional group associated with the surface area of the RC@ZnONPs
|
S. NO
|
Wavenumber cm -1
|
Functional groups capped up on NPs
|
|
1
|
662.2
|
OH plane bending
|
|
2
|
839.93
|
C-H bond
|
|
3
|
927.43
|
C-O stretching
|
|
4
|
1013.93
|
C-O-C bond
|
|
5
|
1107.77
|
C-O-C bond
|
|
6
|
1253.30
|
CN amide III bond
|
|
7
|
1370.21
|
CH aliphatic bending group
|
|
8
|
1422.90
|
Stretching C-O inorganic carbonate
|
|
9
|
1535.24-1640.78
|
Diketones
|
|
10
|
2865
|
C-H alkane medium to strong
|
|
11
|
3027.24
|
C=C bond
|
|
12
|
3629.2
|
O-H strong bond of alcohol
|
3.5. Zeta Potential of RC@ZnONPs
In the case of ZnONPs, mediated by RC, their size and charge characteristics were evaluated using two techniques: Dynamic Light Scattering (DLS) and ζ potential. In this context, the ZnONPs produced using RC exhibited a negative charge in terms of zeta potential. This negative charge arises due to the high adsorption of phytochemicals on the surface of the nanoparticles. This charge plays a pivotal role in stabilizing the nanoparticles by creating electrostatic repulsions between them. As a result, the nanoparticles are less likely to aggregate or clump, ensuring their dispersion and maintaining their individuality in the solution. The polydispersity index (PDI) is a parameter that provides perceptions of the distribution of particle sizes within a sample. A lower PDI value, as indicated by the value of 0.428 in Figure 5(A), suggests a more uniform size distribution among the nanoparticles. This uniformity reveals the high-quality nanoparticles with consistent characteristics, making them suitable for various biological activities. Furthermore, the measured zeta potential value of -19.4 mV for the ZnONPs (Figure 5B) falls within the range of -30 mV to +30 mV, strongly considered anionic which is generally measured optimal for nanoparticle stability. This means that the ZnONPs negative charge is within the stable range, reinforcing their suitability for various applications. Interestingly, previous research involving [6,35,38,39,40,41], also yielded findings consistent with the results obtained in the present study.
3.6. Scanning Electron Microscopy of RC@ZnONPs
In this study, SEM analysis was conducted to examine the physical appearance of the ZnONPs that were produced with the assistance of RC. As illustrated in Figure 6 (A), the SEM images depict the ZnONPs synthesized through RC mediation. The images demonstrate that these nanoparticles possess a spherical morphology. Moreover, the mean crystal diameter of the nanoparticles is reported to be 32.15 nm, a measurement that was determined through the XRD analysis. This SEM analysis provides valuable insights into the physical characteristics of the nanoparticles. The spherical shape of the particles suggests that the synthesis process yielded uniform structures, which is essential for consistent properties and potential applications [42,43,44].
3.7. Energy-dispersive X-Ray Spectroscopy
In the case of the ZnONPs synthesized with the involvement of RC. Through EDS analysis, it was confirmed that the ZnONPs mainly consisted of zinc (Zn) and oxygen (O). Figure 6 (B) visually represents the EDS spectrum, highlighting strong signals corresponding to zinc and oxygen elements. Only zinc and oxygen in the spectrum reinforce the idea of single-phase purity, indicating that the nanoparticles were primarily composed of these two elements. The EDS spectrum also showed minute amounts of additional elements, such as chlorine (Cl), in addition to zinc and oxygen. These trace components may come from the synthesis process, or the sample being prepared for analysis, among other sources. However, the overall purity and quality of the ZnONPs are unaffected by their slight presence [43,44,45,46].
3. 8. Pharmacological assays
3.8.1. Brine-shrimp cytotoxicity assessment
The brine shrimp lethality assay (BSLA) was utilized to evaluate the potential detrimental impact of green ZnONPs on freshly hatched A. salina while estimating cytotoxicity [6]. The objective of the study was to examine ZnONP cytotoxicity at different concentrations, particularly between 50 μg/mL and 1200 μg/mL. The estimation's findings demonstrated a dose-dependent relationship between the ZnONPs' cytotoxic potential. 90% of the newly hatched A. salina died by the ZnONPs at the maximum dose tested (1200 μg/mL). On the other hand, 10% died at the lowest dose (50 μg/mL). The ZnONPs' capacity to produce cytotoxic effects was further supported by this concentration-dependent reaction. The calculated LC50 value for the ZnONPs was measured at 2.20 μg/mL, indicating the concentration at which 50% of the brine shrimp population exhibited mortality. As the nanoparticle concentration increased, so did their cytotoxic potential, a trend that was visually depicted in Figure 7. These findings are consistent with prior research on Zinc-mediated nanoparticles. Similar studies involving [6,32,45,46,47,48] have yielded results in alignment with our research, highlighting the reproducibility and validity of the observed effects. In the current study vincristine sulfate, used as a positive control, demonstrated an LC50 value of 1.975 μg/mL, indicating its higher cytotoxic potential in comparison to the ZnONPs.
3.8.2. Antidiabetic assessment (Alpha-amylase inhibition (AA)
The research examined how effective ZnONPs are at inhibiting Alpha-amylase activity at various concentrations: The inhibitory potential of ZnONPs was notable across a sort of concentrations, from 50-1100 μg/mL. As the concentration of ZnONPs decreased, the rate of Alpha-amylase inhibition slowed down (Figure 8). The highest inhibition (70%) was achieved at the maximum concentration (1100 μg/mL). Inhibition percentages were 42% at 700 μg/mL and 25% at 500 μg/mL. However, positive control (surfactin: ∼83%) showed greater inhibition than tested ZnONPs. The research findings regarding green ZnONPs from RC are confirmed by similar outcomes observed with ZnONPs derived from other plants: [6,21,33,38,39,47,48,49,50].
3.8.3. Antibacterial assay of RC@ZnONPs
The present study employed an antibacterial assay to evaluate the efficacy of biogenic ZnONPs against a range of bacterial strains, including Staphylococcus aureus (ATCC 23235), Lactobacillus acidophilus (ATCC 4356), Bacillus subtilis (ATCC 23857), R. jostii, Pseudomonas aeruginosa (ATCC 15442), and Escherichia coli (ATCC BAA-2471), at varied dosages. These bacterial strains were carefully chosen, with S. aureus, L. acidophilus, B. subtilis, and R. jostii representing gram-positive bacteria, while P. aeruginosa and E. coli are gram-negative bacteria. The results of the current investigation showed that B. subtilus was vulnerable to the effects of ZnONPs at 1500 μg/mL, which induced a ZOI that measured 24 mm. As the concentration was lowered to 100 μg/mL, the ZOI dropped to 6 mm. Similarly, strain L. acidophilus displayed a ZOI of 23.25 mm at 1500 μg/mL and 6 mm at 100 μg/mL. In the case of E. coli, ZOI was 22.70 mm when treated with 1500 μg/mL of ZnONPs, while at 100 μg/mL, the ZOI was 6 mm. Comparable trends were noted for other strains of P. aeruginosa, where a ZOI of 22.75 mm was observed at 1500 μg/mL, and this reduced to 6 mm at 100 μg/mL. The susceptibility of S. aureus to ZnONPs was evident, with a ZOI of 23 mm at 1500 μg/mL and 6 mm at 100 μg/mL. Similarly, R. jostii displayed vulnerability, exhibiting a ZOI of 23.78 mm at 1500 μg/mL and 8 mm at 100 μg/mL.
Incorporated in Table 4 are the recorded ZOI values, where a positive control involved the administration of 10 mg of pure oxytetracycline medication. Particularly, oxytetracycline displayed higher efficiency compared to any singular concentration of the test sample. In essence, our findings suggest a promising potential for biogenic ZnONPs in terms of antibacterial activity, aligning well with prior research in this area [2,6,7,19,40,49,50,51,52]. The potential efficiency of these ZnONPs might be attributed to the presence of bioactive functional groups associated with the nanoparticles. These functional groups play a pivotal role in capping and stabilizing the ZnONPs, and their presence correlates with a significant level of antibacterial activity, as depicted in Figure 9.
Table. 4. List of strains and their ZOI value at different concentrations.
|
Bacterial strains
|
ZOI (μg/ml)
|
|
B. subtilus
|
24
|
|
L. acidophilus
|
23.25
|
|
S. aureus
|
23
|
|
E. choli
|
22.7
|
|
P. aeruginosa
|
22.75
|
|
R. jostii
|
23.78
|
|
Oxytetracycline
|
30
|
3.8.4. Antifungal activity of RC@ZnONPs
The study aimed to evaluate the antifungal competence of ZnONPs synthesized using RC as a mediator. These ZnONPs were tested against multiple fungal strains, including Aspergillus flavus (Strain ID: FCBP:0064), Aspergillus niger (Strain ID: FCBP:0918), Candida albicans (Strain ID: FCBP:478), Mucor racemosus, and Fusarium solani (Strain ID: FCBP:0291) at different concentrations (1500 to 100 μg/mL). In this study, A. flavus emerged as a susceptible strain, revealing a ZOI measuring approximately 27 ± 0.71 mm at 1500 μg/mL. Furthermore, its Minimum Inhibitory Concentration (MIC) value was determined to be around 8.2 ± 1.4 mm at the lower concentration of 100 μg/mL. Similarly, A. niger demonstrated a ZOI of about 28.75 ± 0.71 mm at 1500 μg/mL, while M. racemosus displayed a ZOI of roughly 29 ± 0.71 mm at the same concentration. C. albicans exhibited constrained growth within a ZOI of approximately 28 ± 1.41 mm, and F. solani strains displayed a ZOI of 27.50 ± 0.71 mm (as indicated in Figure 10). It is important to note, however, that none of the tested samples showed a degree of inhibition greater than that of Amp-B, a known antifungal agent. This data is consistent with previous studies [2,5,7,21,32,39,41,42,50,51,52,53] that indicate ZnONPs interact with fungi and their hyphae to impede fungal growth and produce Reactive Oxygen Species (ROS). This current study's outcomes parallel those of previous investigations conducted which showcased a significant and dose-dependent antifungal activity, a correspondence that further encourages the credibility of the present findings.
Table. 5. ZOI of different fungal strains at various concentrations.
|
Fungal strains
|
ZOI (μg/ml)
|
|
A. flavus
|
27
|
|
F. solani
|
27.5
|
|
A. niger
|
28.75
|
|
C. albicans
|
28
|
|
M. racemosus
|
29
|
|
Ampicillin
|
38
|
3.8.5. Antihemolytic effects of RC@ZnONPs on Human RBC
The criteria for categorizing a biological substance's hemolytic activity were as: A substance is classified as hemolytic when its activity level reaches a minimum of 5%, while it is categorized as slightly hemolytic if the activity falls within the range of 2-5%, and non-hemolytic if the activity is less than 2% [2,6,24]. The current assessment involved subjecting human RBCs to varying concentrations of ZnONPs, ranging from 200-17 µg/mL. The data collected from this experiment revealed several important findings. The synthesized nanoparticles exhibited non-hemolytic behavior at lower concentrations, specifically at 17, 37, and 71 µg/mL. The concentration range 75–125 µg/mL, showed a somewhat hemolytic response. However, at above 125 µg/mL, the nanoparticles exhibited clear hemolytic activity. These outcomes align with earlier studies involving ZnONPs mediated by substances such as [2,5,53,54,55]. The current study's results contribute to the body of evidence indicating that the biosynthesized ZnONPs are biocompatible and non-hemolytic at lower concentrations (Figure 11 (A).
3.8.6. Antioxidant activities of RC@ZnONPs
This study examined RC@ZnONPs antioxidant properties (TAC, TRP, and DPPH free radical scavenging). The plant extract contains phenolic compounds known for their ability to scavenge ROS, complementing the properties of ZnONPs. Various Concentrations (5–100 μg/mL) were used in the current assay. A substantial capacity to scavenge DPPH radicals was evident at a concentration of 100 μg/mL, demonstrating a scavenging rate of 73% (depicted in Figure (11-B). This data suggests that a diverse range of antioxidant substances potentially contributes to stabilizing and reducing ZnONPs via the RC leaf extract involvement. Moreover, the highest recorded total antioxidant activity index was 88 ± 4.8% at 100 μg/mL of ZnONPs, whereas the lowest TAC activity observed was 3.0 ± 1.7%. Figure (11-C) graphically illustrates the TAC results, Showing the capacity of the compounds to scavenge ROS. The TRP was conducted to investigate deeper into the existence of antioxidant entities associated with ZnONPs. This inquiry aimed to elucidate reductones, molecules that contribute hydrogen atoms to enhance antioxidant potential, thereby serving as agents that mitigate potential chain damage induced by free radicals. The utilization of biogenic ZnONPs has provided considerable evidence of their vigorous antioxidant abilities. A proportional decline in reducing power was observed as the concentration of ZnONPs decreased. When the concentration hit 100 μg/mL, the reduction in the value was at 69 ± 1.77%. In contrast, the lowest result at a concentration in the 5 μg/mL range was measured at 12 ± 1.36% (as illustrated in Figure 11-D). Our findings align with prior research involving biogenic ZnONPs synthesized from sources such as [2,5,6,7,54,55,56,57]. This collective body of evidence underscores the significant potential of biogenic ZnONPs as potent antioxidants.
3.6. Biocompatibility assay of RC@ZnONPs
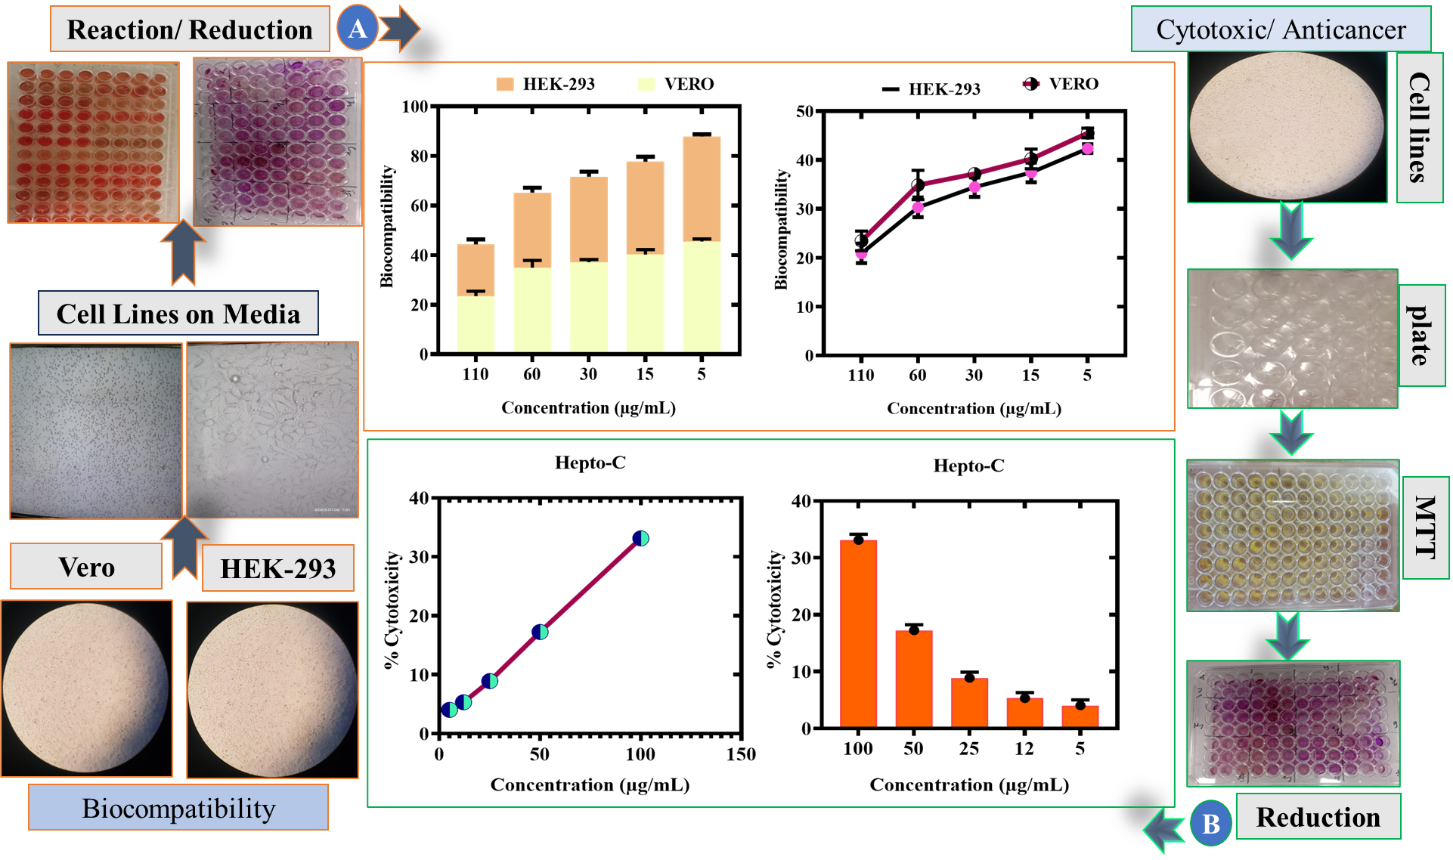
To measure the biocompatibility of ZnONPs, VERO and HEK293 cell lines were utilized in the assessment. Prior to being allowed to adhere to DMEM medium for 24 hours, cells were first seeded into a 96-well plate. Afterward, different concentrations of ZnONPs, ranging from 5 to 100 µg/mL, were added to the cells. The MTT cell viability assay, following the methodology established by Devanesan et al. in 2021 [58], was employed to measure the biocompatibility features of the ZnONPs. The cellular response to ZnONPs treatment displayed a dose-dependent pattern. The assay outcomes revealed that at a concentration of 100 µg/mL, ZnONPs hindered cell growth by approximately 46%, indicating the biologically safe nature of biogenically synthesized ZnONPs. Notably, both VERO and HEK293 cell lines possess inherent mechanisms to respond to ROS from external sources. Prior studies have indicated that lower concentrations of ROS are non-lethal to these cell lines. However, once ROS concentrations surpass a certain threshold, the viability of both cell types becomes compromised [58]. The IC50 values for ZnONPs were determined to be 208.14 µg/mL for VERO cells and 344.90 µg/mL for HEK293 cells, representing the concentrations at which ZnONPs inhibit cell growth by 50 (Figure.12). The findings regarding ZnONPs mediated by RC were consistent with previous studies of ZnONPs [58,59,60].
3.8.7. Anticancer activity of the RC@ZnONPs
In this study the impact of the nanoparticles on cancer cells, specifically Hep-2 cancer cell lines, was assessed by introducing varying doses of nanoparticles ranging (5-100 µg/mL), allowing them to incubate for 24 hours. The primary objective was to evaluate the antiproliferative effects of the ZnONPs. The study found that the viability of Hep-2 cells was inhibited in a dose-dependent manner. Results from the MTT test exhibited a gradual decrease in cell viability with rising quantities of ZnONPs, as depicted in Figure 13. Notably, the calculated IC50 for ZnONPs was determined to be 44.90 μg/mL. In addition to quantitative assessments, an inverted microscope was utilized to scrutinize cellular morphology across different ZnONPs concentrations. As shown in Figure 13, the results indicated that biosynthesized ZnONPs had a potent and substantial impact on Hep-2 cell lines, validating their antiproliferative properties. Collectively, these understandings suggest that green-synthesized ZnONPs possess noteworthy power versus Hep-2 cell lines. Our findings align with prior reports on biosynthesized ZnONPs [2,60,61,62,63,64,65,66]. This research has the potential to contribute significantly to the ongoing pursuit of innovative and effective approaches to combating cancer. Overall, the biocompatibility and anticancer analysis are shown in illustration (A).