3.1 Impact of N application rate on dry matter weight
The dry matter weight (DMW) of different cotton organs was significantly influenced by the N fertilizer treatments during the 2021 and 2022 growth seasons (Figs. 2, 3, and 4). At the seedling stage, the stems' DMW showed significant increases of 25.0%, 42.1%, 44.8%, and 43.4% in 2021 and 33.0%, 35.2%, 63.6%, and 75.0% in 2022 for the N150, N225, N300, and N450 treatments, respectively, compared to the N0 treatment (CK). Likewise, compared to CK, the leaves' DMW for the N150, N225, N300, and N450 treatments exhibited significant increases of 10.3%, 16.6%, 30.4%, and 15.2% in 2021 and 17.4%, 43.8%, 66.1%, and 78.5% in 2022, respectively. The root DMW of the N fertilizer treatments in 2022 was significantly higher than CK (with an average value of 61.6%). At the bud and peak boll stages, the maximum DMW in roots, stems, leaves, and reproductive organs was observed for the N300 treatment, followed by N225 and N450, during both experimental years (Figs. 3 and 4). The DMW of cotton organs and the total plant increased as the growth period progressed from seeding to bolling stages. Additionally, the DMW of cotton organs and the total plant were lower in 2021 compared to 2022.
The majority of the dry matter (DM) was allocated to the leaves (52.7% and 42.4%), followed by stems (34.9% and 39.6%), with the remaining DM distributed in roots (12.4% and 11.8%) and reproductive organs (6.2%) at the seedling and bud stages, respectively (Figs. 2 and 3). However, at the peak boll stage, the highest proportion of DM was allocated to reproductive organs (37.1%), followed by stems (28.1%) and leaves (27.1%), with roots accounting for the remaining portion (7.7%) (Fig. 4). The ratios of root, stem, leaf, and reproductive organ to the total plant biomass were influenced by the N fertilizer treatments during the growing season (Figs. 2, 3, and 4). For instance, the ratio of reproductive organ to total plant biomass for the N225 treatment at the peak boll stage in 2022 was 3.5% and 7.2% higher than that of the N300 and N450 treatments, respectively. Similarly, the ratio of leaf to total plant biomass for the N450 treatment at the bud stage in 2022 was 28.9% and 14.9% higher than that of the N225 and N300 treatments, respectively. Additionally, the ratio of stem to total plant biomass for the N300 treatment at the peak boll stage in 2021 was 5.8% higher than that of the N450 treatment.
3.2 Impact of N application rate on N uptake and distribution
Nitrogen uptake corresponded to DM accumulation patterns at the seedling, bud, and peak boll stages. The application of nitrogen fertilizers significantly increased nitrogen accumulation in various cotton organs throughout the 2021 and 2022 growing seasons (Figs. 5, 6, and 7). At the seedling stage, nitrogen content in stems exhibited substantial increments across N150, N225, N300, and N450 treatments, with increases of 34.4%, 64.1%, 71.0%, and 56.4% in 2021 and 44.4%, 58.2%, 112.2%, and 146.3% in 2022, respectively, when compared to the control (CK) (Fig. 5). Similarly, compared to CK, nitrogen content in leaves showed significant increases across N150, N225, N300, and N450 treatments, with increments of 11.7%, 26.6%, 59.3%, and 25.1% in 2021 and 28.5%, 85.9%, 119.1%, and 104.7% in 2022 (Fig. 5). The nitrogen content in roots among the N fertilizer treatments in 2022 was significantly higher than in the control (with an average increase of 126.1%).
At the bud and peak boll stages, the maximum N content in roots, stems, leaves, and reproductive organs was observed for the N300 treatment, followed by N225 and N450, during both experimental years (Figs. 6 and 7). The N content of cotton organs and the total plant increased progressively from the seedling to the bolling stages. At seedling, bud, and peak boll stages, the total N accumulation for each N treatment ranged from 45.7 kg/ha− 1 to 102.2 kg/ha− 1, 104.7 kg/ha− 1 to 173.1 kg/ha− 1, and 173.7 kg/ha− 1 to 427.8 kg/ha− 1, respectively. Notably, the N content of cotton organs and the total plant at seedling and peak boll stages were lower in 2021 compared to 2022.
The majority of N content was allocated to leaves (65.8% and 57.8%), followed by stems (27.6% and 28.3%), with the remaining portions distributed among roots (6.6% and 4.4%) and reproductive organs (9.5%) at seedling and bud stages, respectively (Figs. 5 and 6). However, at the peak boll stage, the majority of N content was allocated to reproductive organs (39.1%), followed by leaves (34.8%) and stems (22.5%), with roots accounting for the remaining proportion (3.6%) (Fig. 7). The ratios of root, stem, leaf, and reproductive organ N content to the total plant N content during the growing season were influenced by N fertilizer treatments (Figs. 5, 6, and 7). For instance, the ratio of reproductive organ nitrogen content to total plant nitrogen content for N225, N300, and N450 treatments at the peak boll stage in 2022 was 9.6%, 9.8%, and 27.4% higher than that of the control, respectively. Moreover, the ratio of leaf nitrogen content to total plant nitrogen content for the N450 treatment at the bud stage in 2022 was 21.5% and 22.4% higher than that of the N225 and N300 treatments, respectively. Similarly, the ratio of stem N content to total plant N content for N225, N300, and N450 treatments at the peak boll stage in 2021 was 21.8%, 29.1%, and 27.3% higher than that of CK.
3.3 Impact of N application rate on root morphological parameters
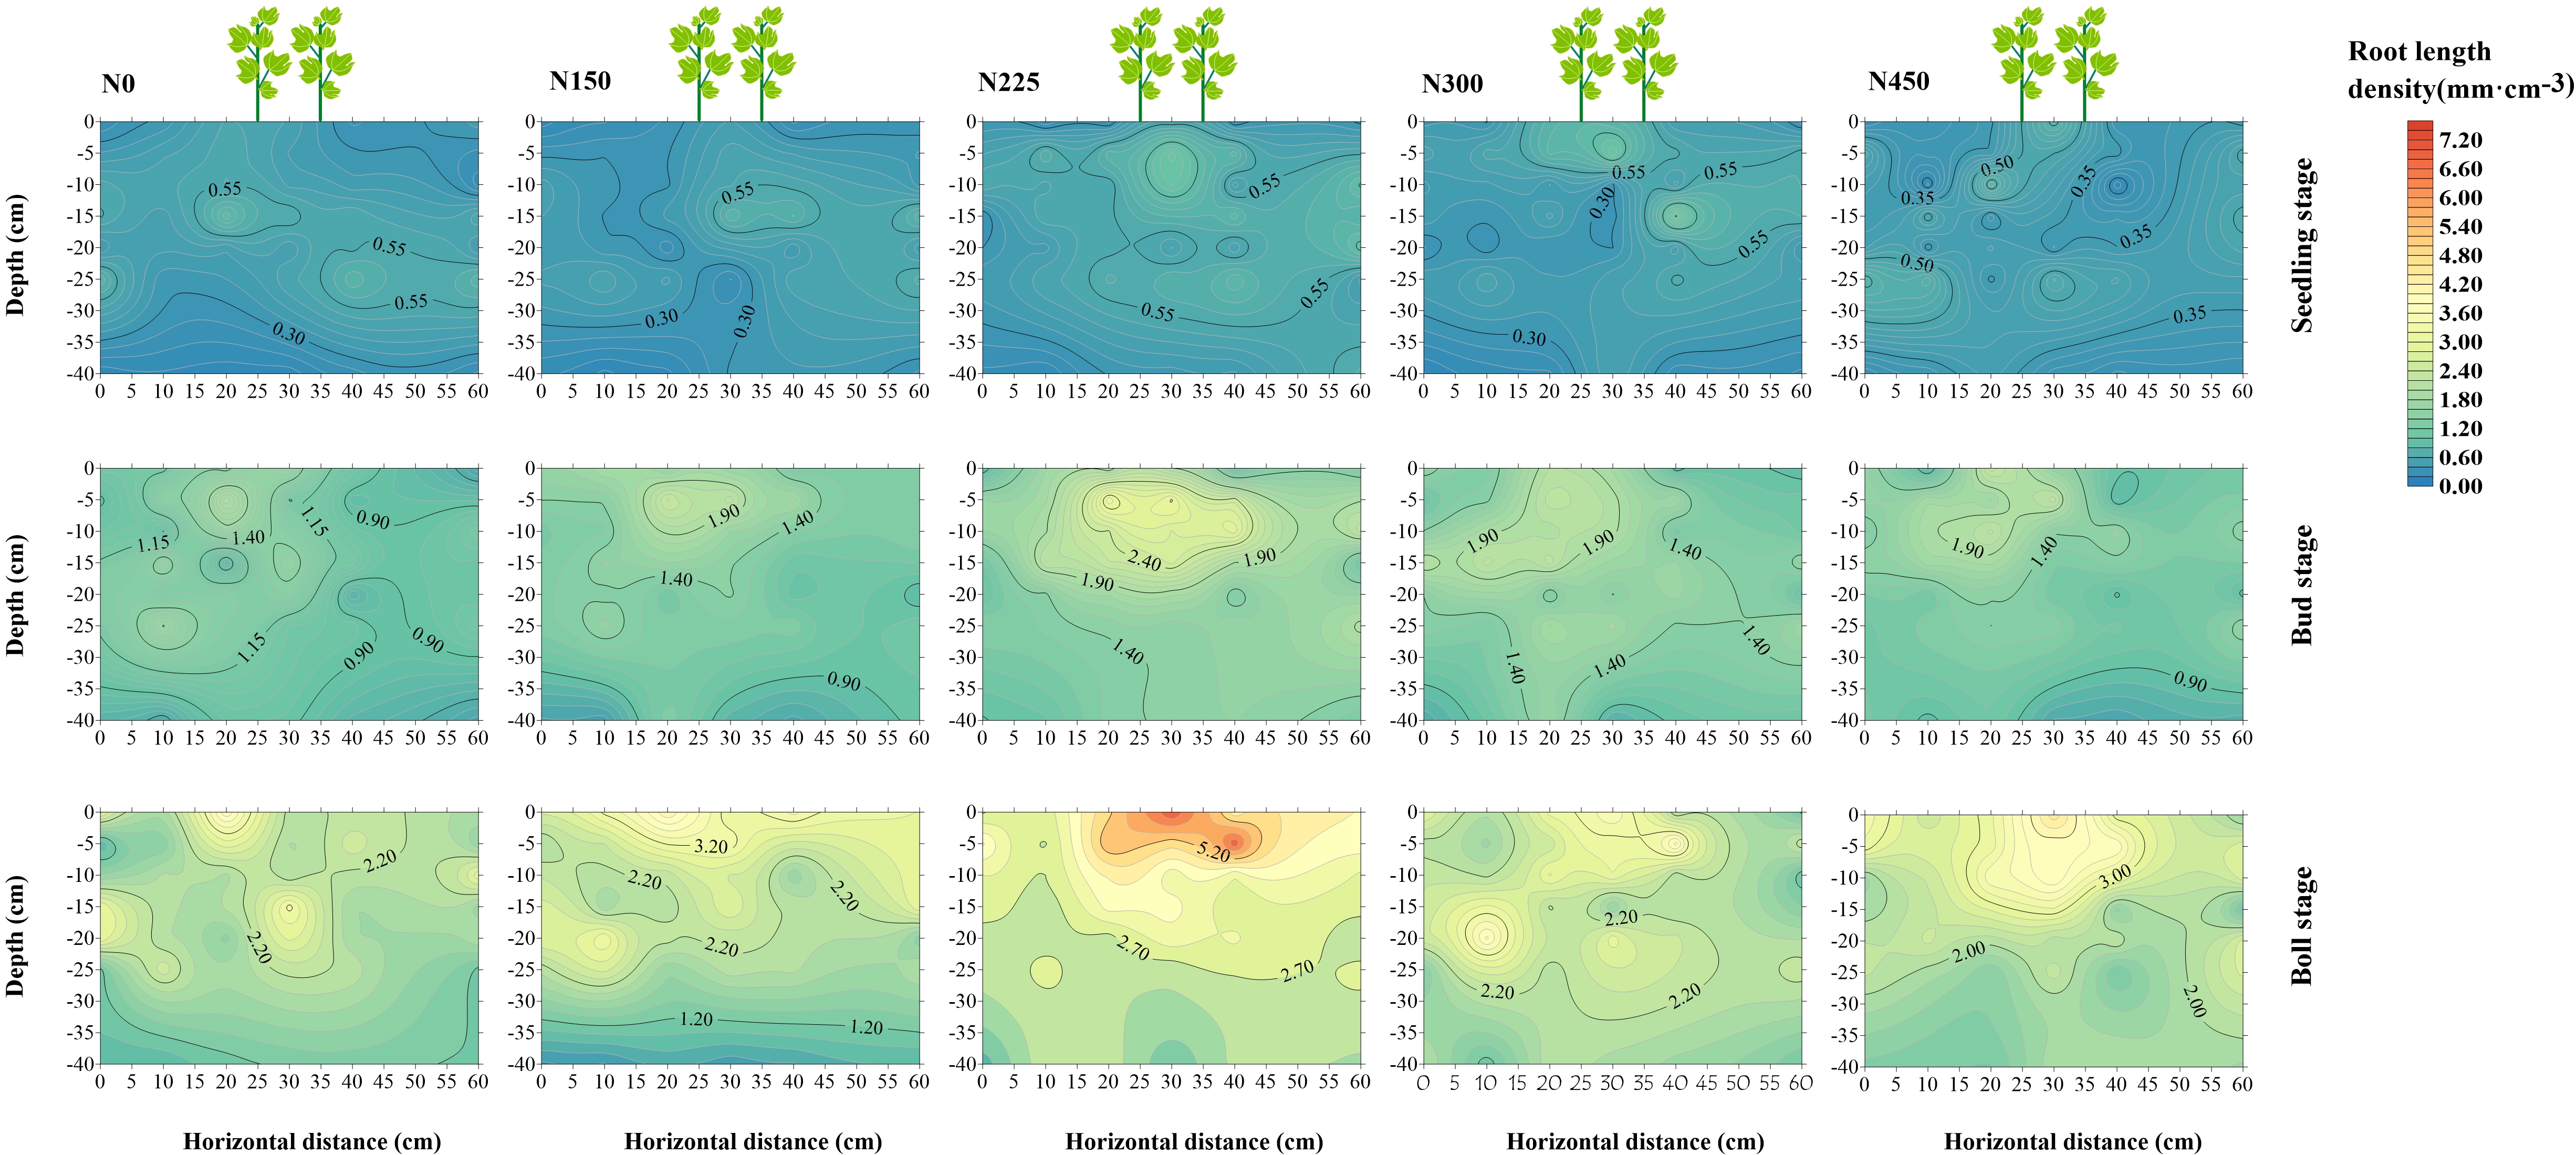
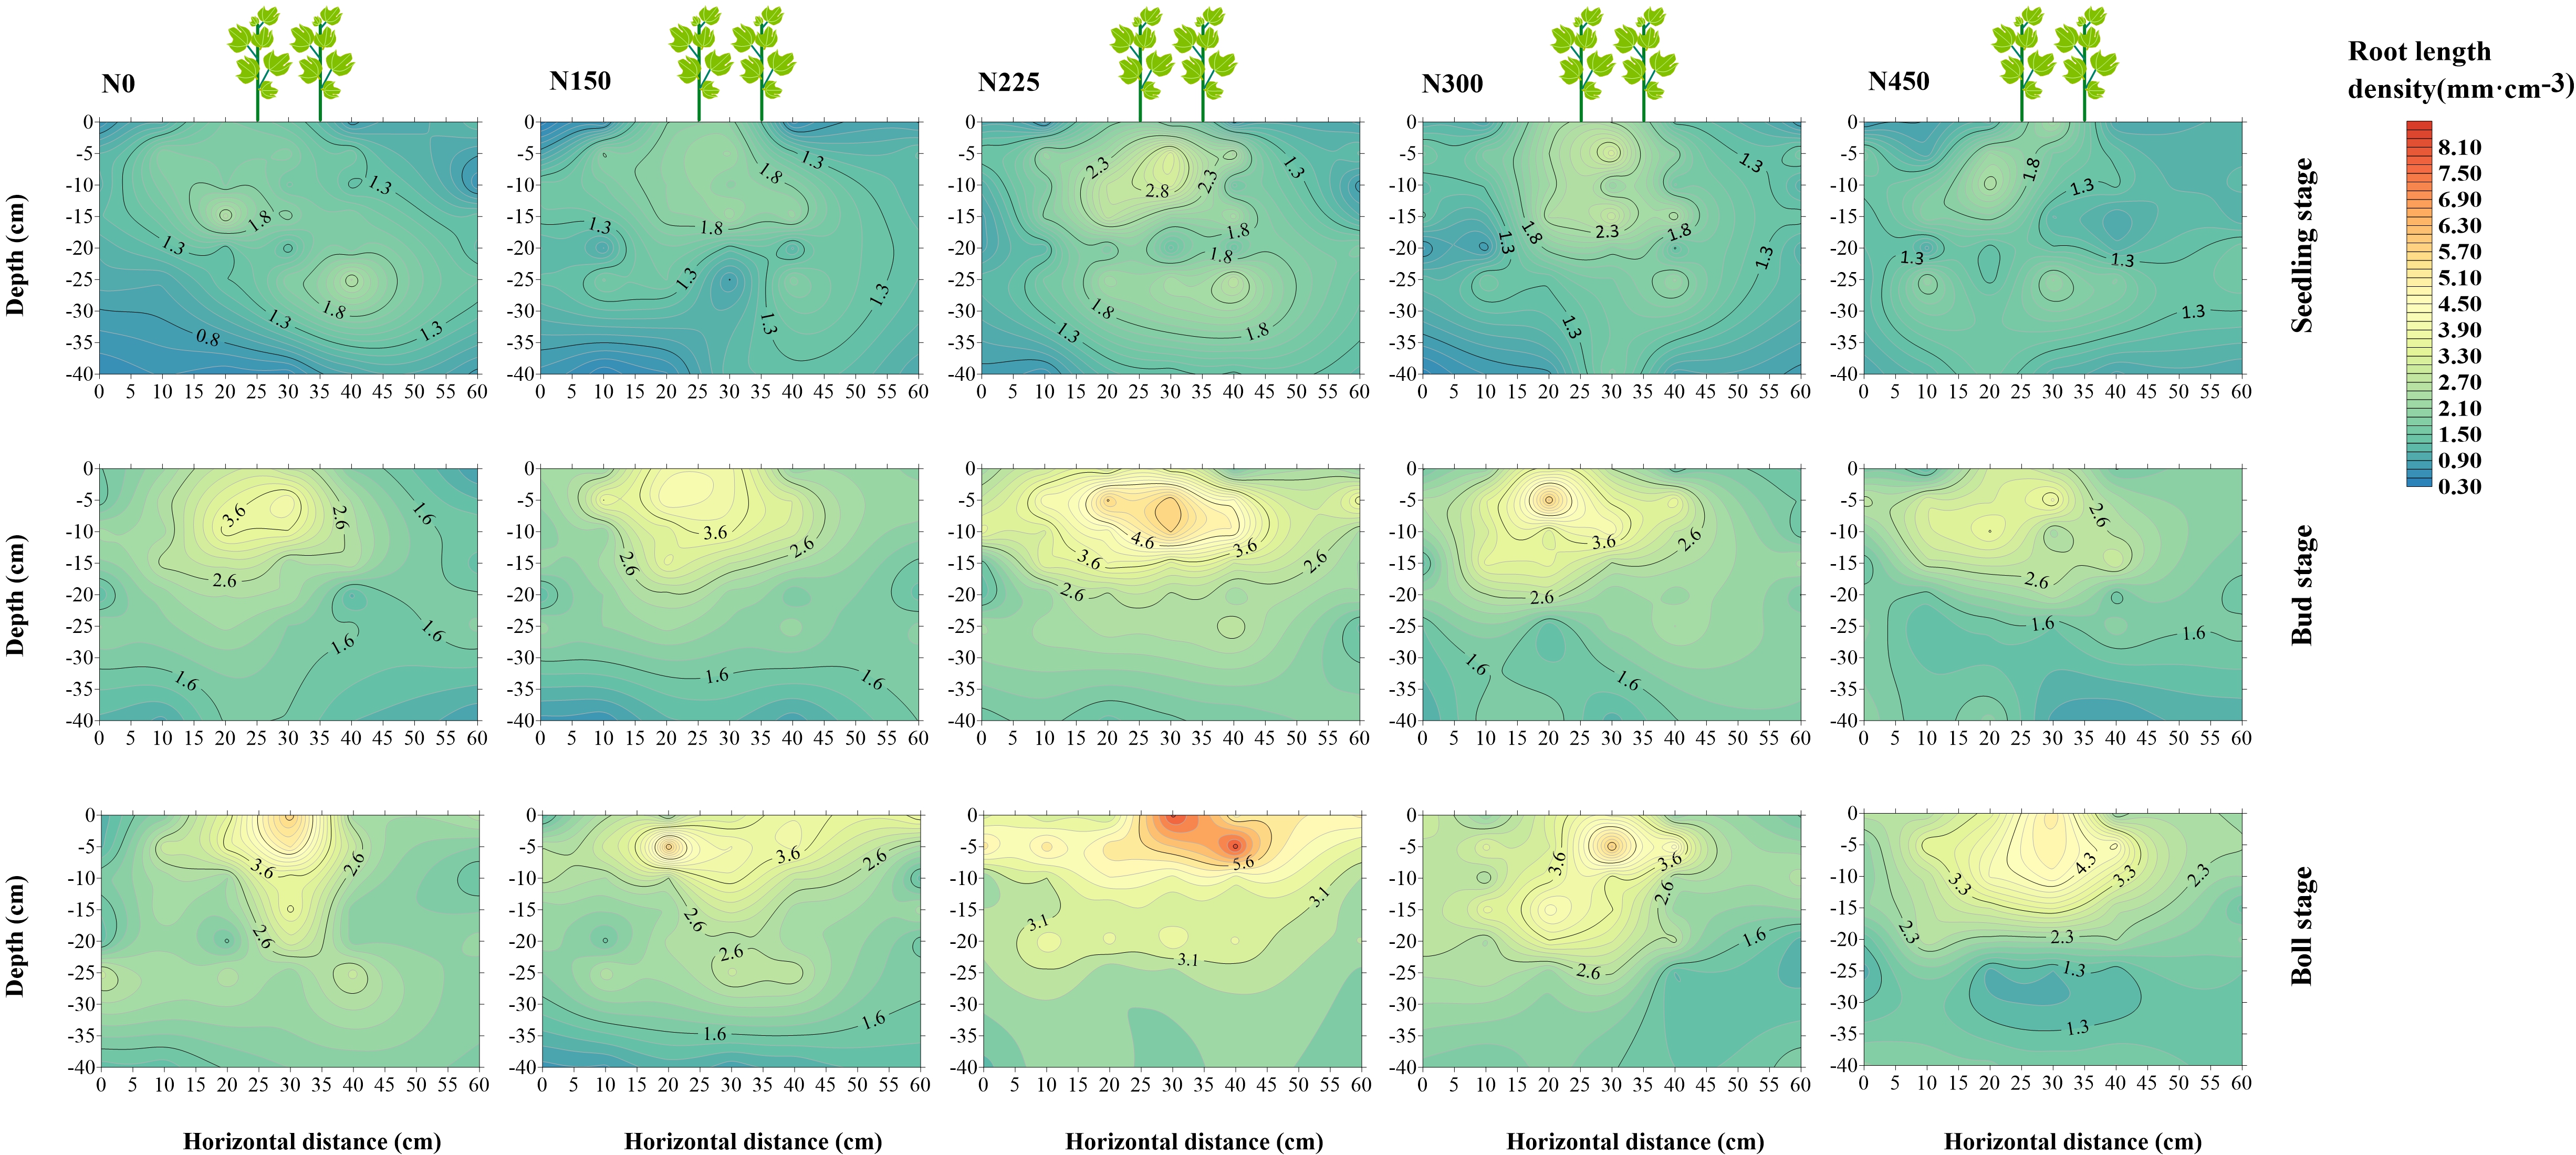
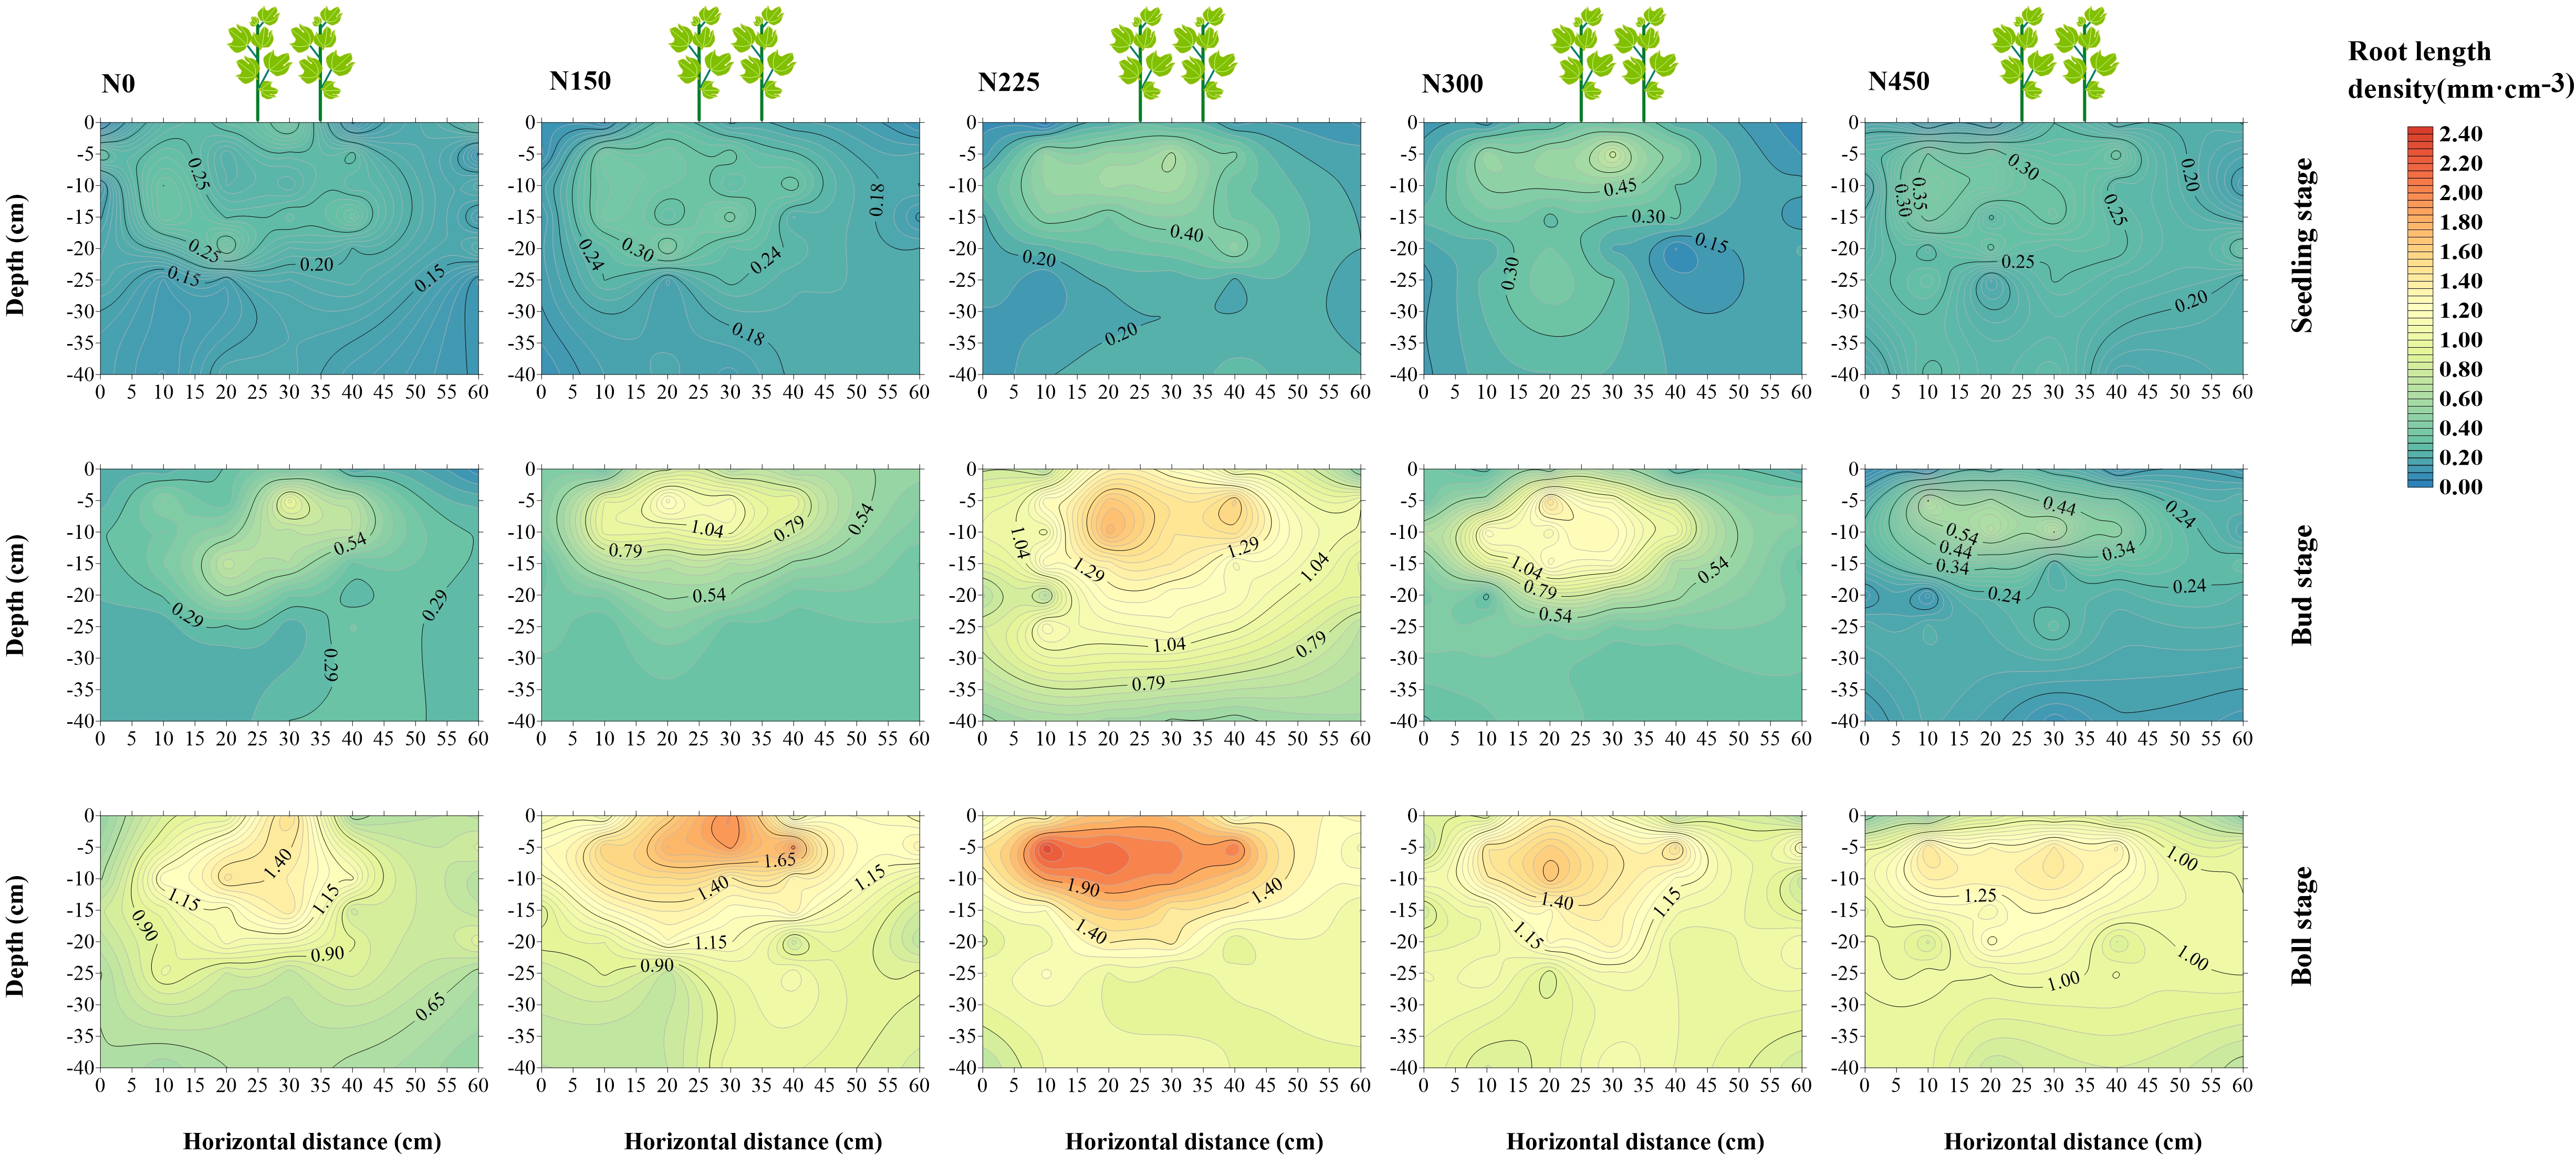
The total root length density exhibited a trend of initial increase followed by a decrease with increasing N application rates (Figs. 8 and 9). Notably, the maximum total root length density at depths of 0–40 cm soil was observed under the N225 treatment, reaching 1.02 mm cm− 3, 1.98 mm cm− 3, and 4.19 mm cm− 3 at the seedling, bud, and peak boll stages in 2021, and 3.31 mm cm− 3, 3.68 mm cm− 3, and 5.41 mm cm− 3 at the same stages in 2022, respectively. These values represented significant increases of 111.1%, 79.1%, and 54.7% in 2021 and 113.3%, 80.0%, and 49.6% in 2022 compared to the CK treatment. The majority of total root length density was concentrated in the 0–20 cm soil layer, accounting for more than 65.2%, 71.0%, and 66.2% at the seedling, bud, and peak boll stages in 2021, and 61.3%, 67.5%, and 62.9% at the same stages in 2022, respectively.
Moreover, the N225 treatment also resulted in the highest fine and middle root length density (FRLD and MRLD) in the 0–40 cm soil layer at all growth stages during both years. Relative to the CK treatment, the FRLD and MRLD under the N225 treatment showed notable increases ranging from 23.8–64.5% in 2021 and from 23.9–50.7% in 2022 (Figs S2, S3, S4, and S5).
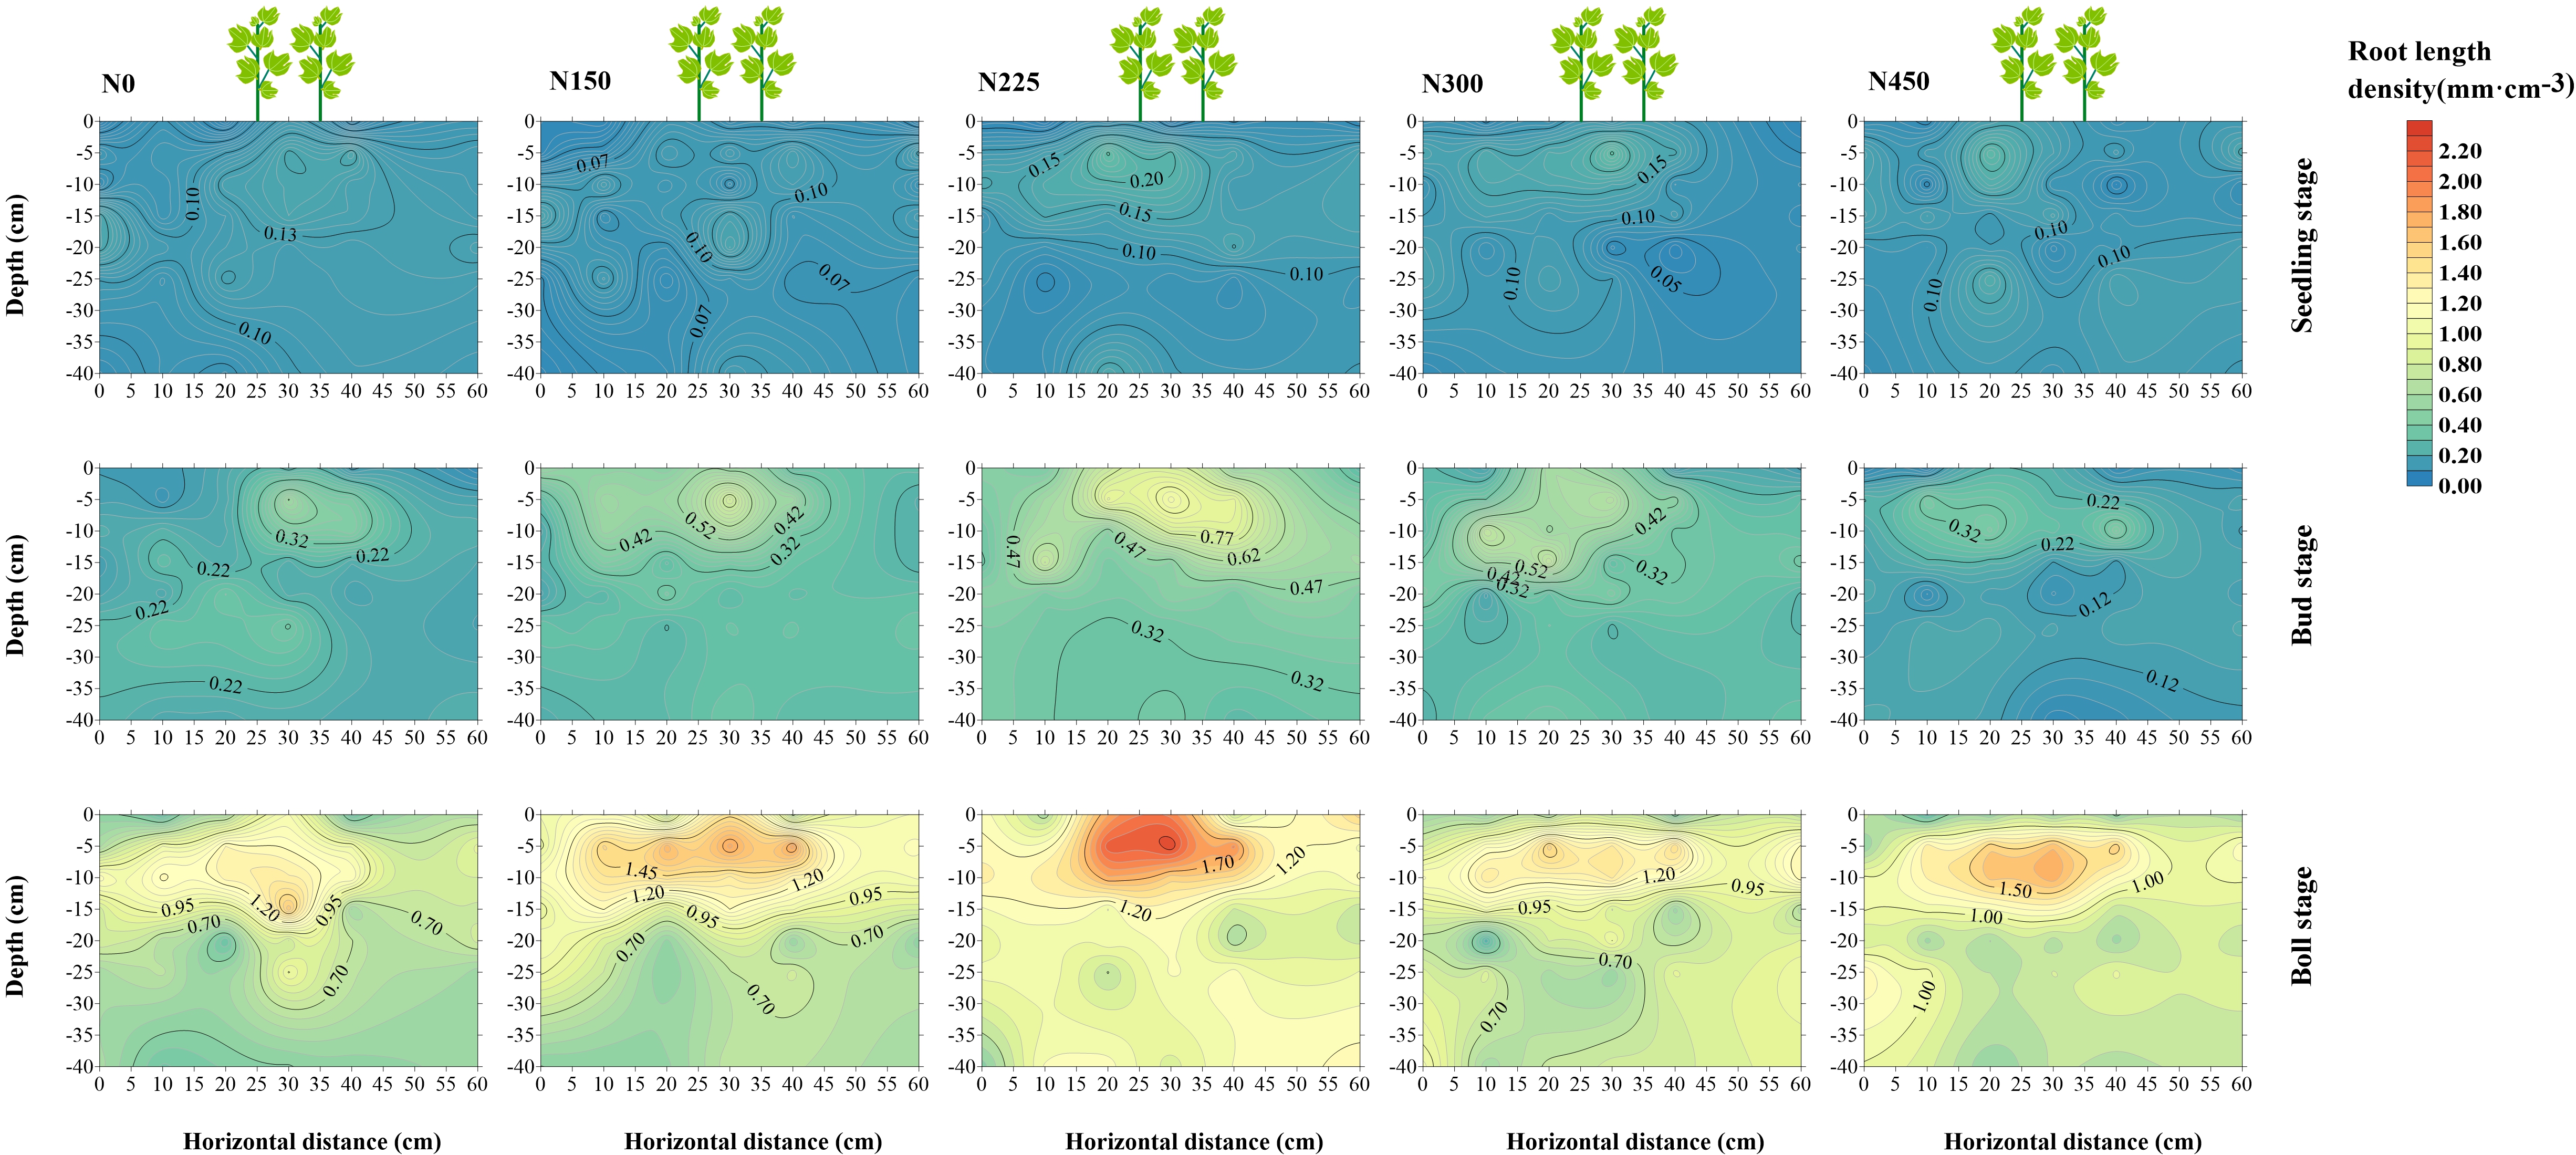
Similarly, the root surface area density in the 0–40 cm soil layers displayed an initial increase followed by a decrease with increasing N fertilization. The N225 treatment exhibited the highest root surface area density, surpassing that of the CK treatment by 29.1%, 95.1%, and 57.1% in 2021 and by 29.4%, 92.0%, and 57.3% in 2022 at the seedling, bud, and peak boll stages (Figs. 10 and 11).
With increasing N fertilization, root volume density initially increased and then decreased across most soil layers, with variations observed among treatments (Figs. 12 and 13). Under the N225 treatment, root volume density exceeded that of the CK treatment by 42.2–64.4% in 2021 and by 42.7–64.4% in 2022 at the seedling, bud, and peak boll stages, respectively.
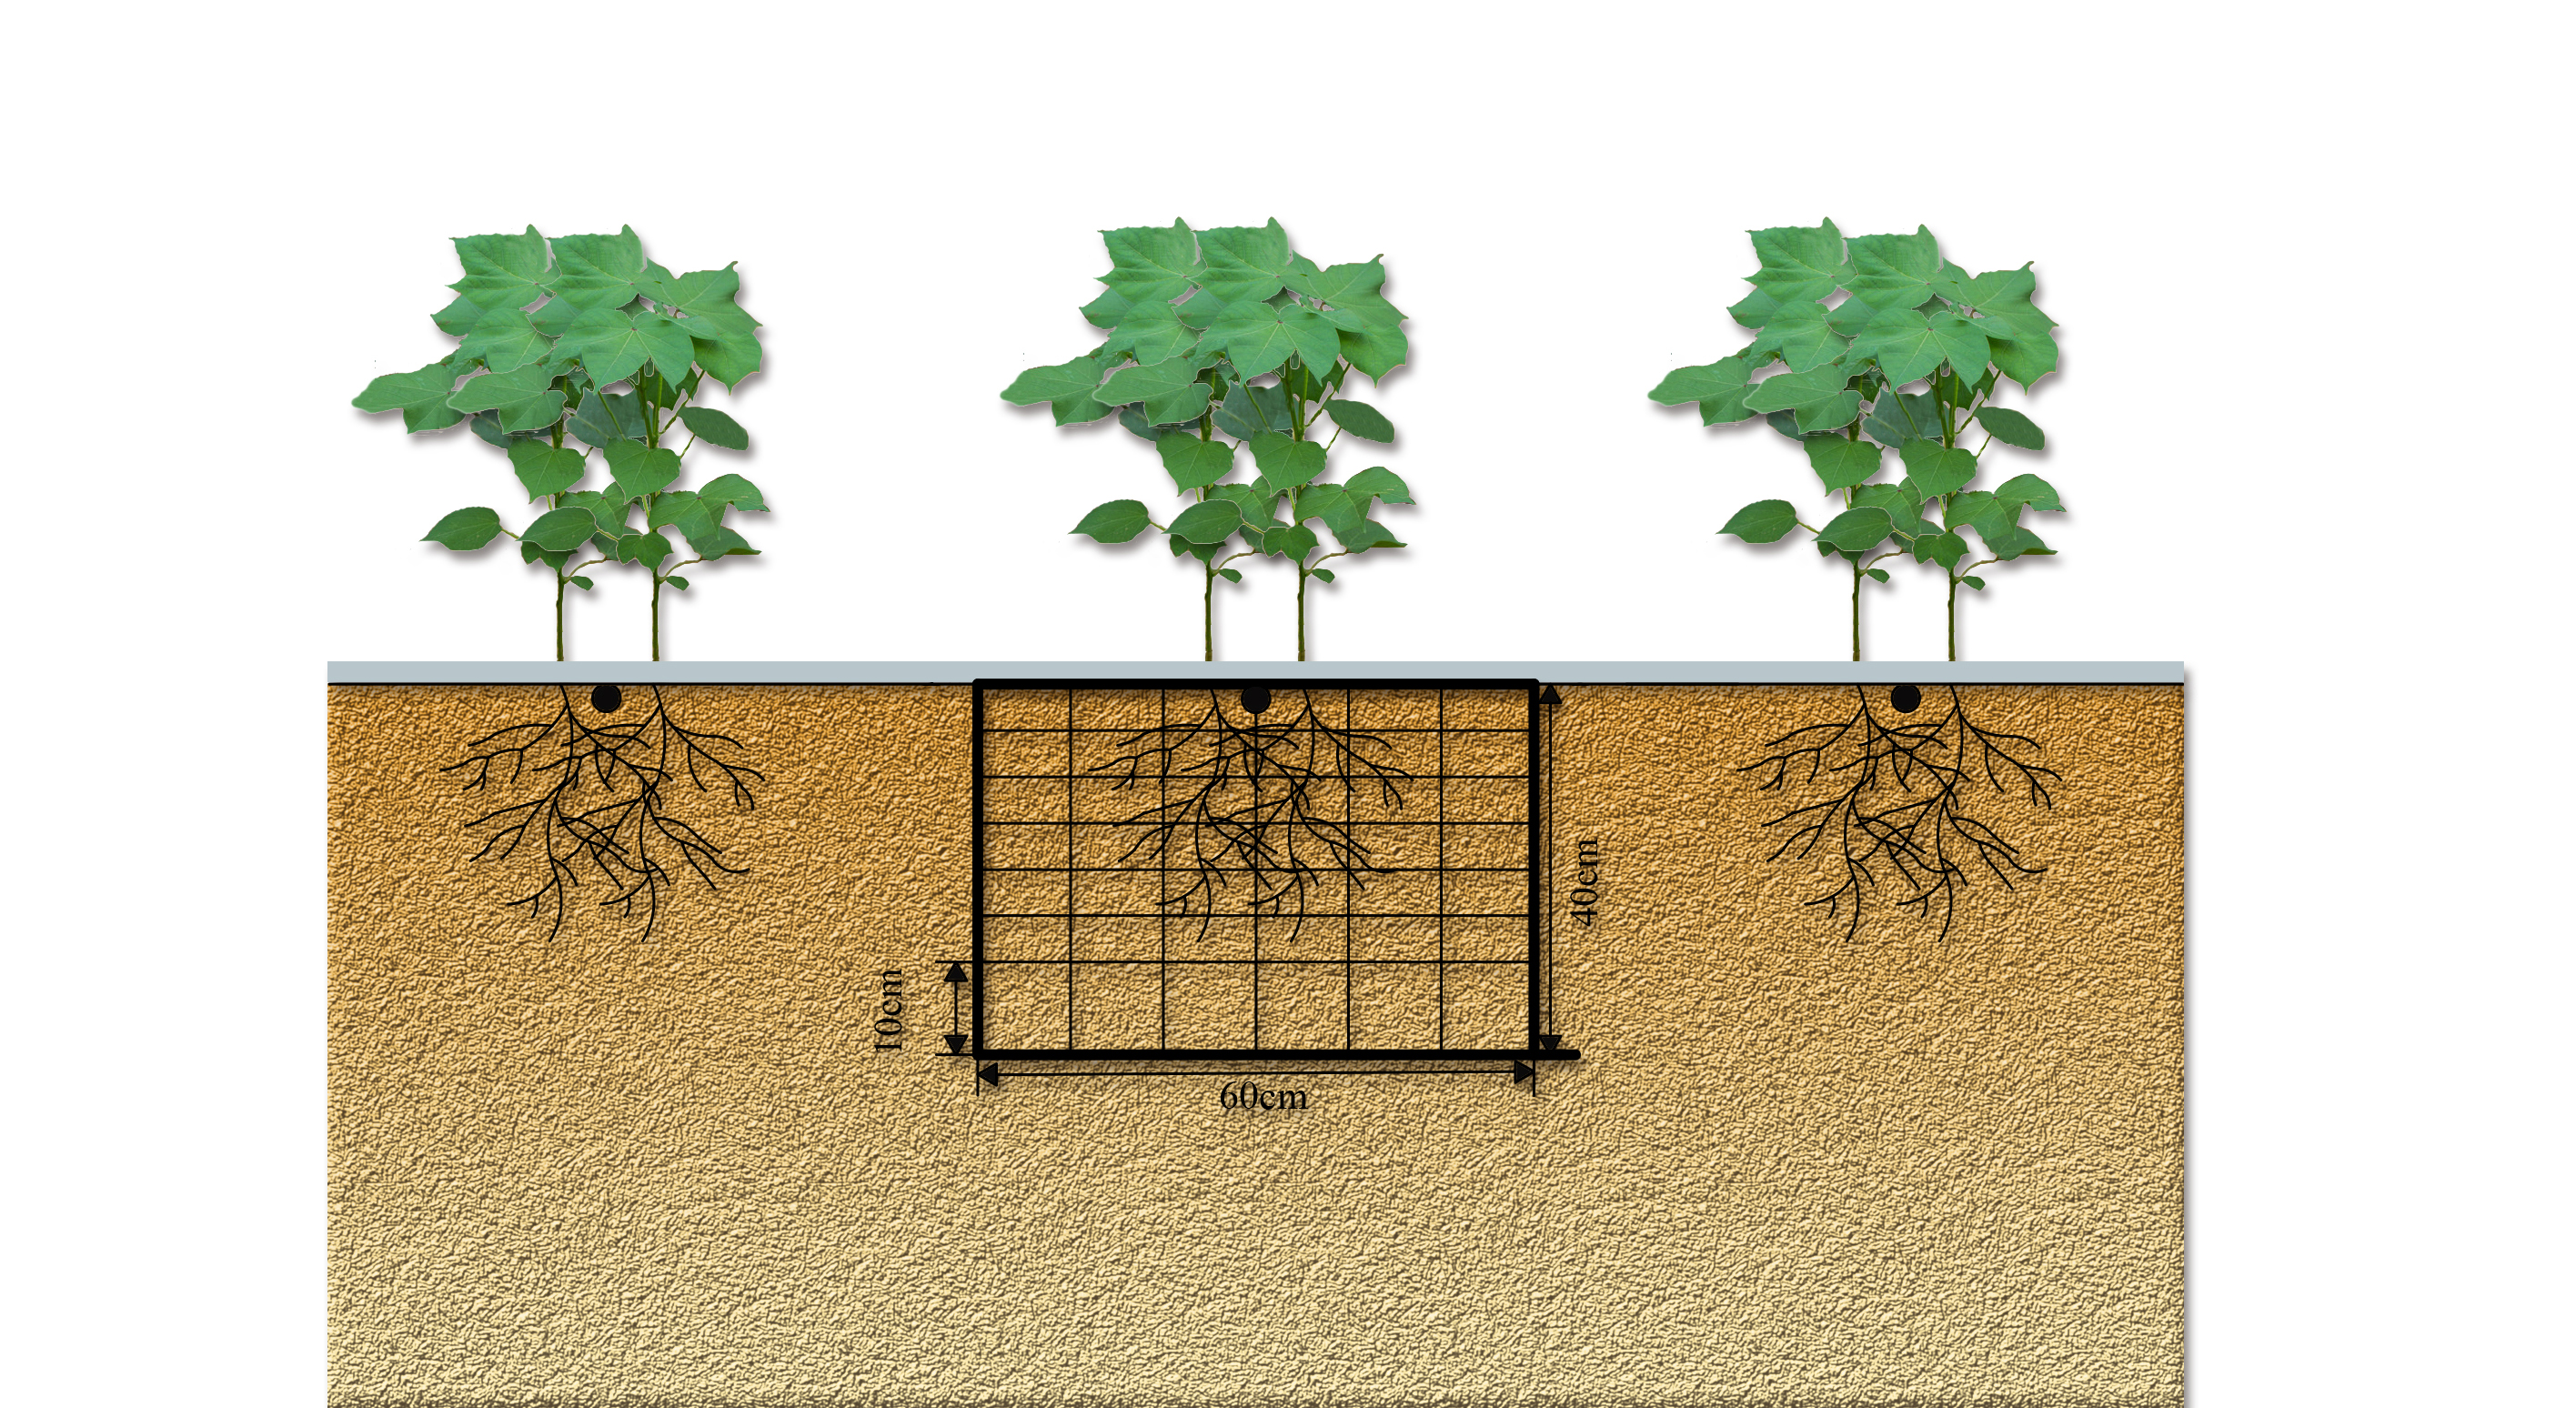
Furthermore, total root length density, fine and middle length density, surface area density, and volume density decreased with increasing soil depth but increased with the growth period (Figs. 8, 9, 10, 11, 13, S2, S3, S4, and S5). The distribution of cotton root system indexes, including root length density, surface area density, and volume density, was primarily within a horizontal distance of 40 cm at the 0–40 cm soil layer.
3.4 Impact of nitrogen application rate on residual nitrogen
The soil NO3−-N, NH4+-N, residual N, and N apparent residual rates for 2021 and 2022 are depicted in Fig. 14. The average soil NO3−-N and NH4+-N content within the 0–60 cm soil depth was higher in 2021 compared to 2022. These contents increased with increasing N application but decreased with increasing soil depth (0–60 cm). Similarly, residual N amounts and rates were higher in 2021 compared to 2022. The maximum residual N amount within the 0–60 cm soil depth was recorded as 138.8 kg ha− 1 (2021) and 85.5 kg ha− 1 (2022) under the N450 treatment, representing approximately 211.2%, 97.8%, and 40.0% higher values in 2021 and 225.4%, 82.1%, and 25.4% higher values in 2022 compared to the N150, N225, and N300 treatments, respectively. However, the residual N apparent rate initially increased with the N application rate but then decreased when the N application rate exceeded a certain threshold (300 kg N ha− 1).
3.5 Impact of N application rate on seed cotton yield
The N application rate significantly influenced seed cotton yield in both 2021 and 2022 (Fig. 15). Initially, seed cotton yield exhibited an increasing trend with the N application rate, but subsequently declined upon surpassing a certain threshold. Among the N treatments, the N300 treatment demonstrated the maximum seed cotton yield, augmenting the yield by 76.3%, 44.8%, 21.2%, and 42.3% in 2021 and by 69.4%, 41.4%, 25.7%, and 30.6% in 2022, respectively, compared to the CK, N150, N225, and N450 treatments. Notably, the seed cotton yield was lower in 2021 than in 2022.
3.6 Correlations between total root morphological parameters and N form, N accumulation, and yield
During the seedling stage, root morphology parameters (RLD, RSD, and RVD) at a soil depth of 0–10 cm exhibited significant associations with N uptake (Fig. 16). Additionally, RSD at a soil depth of 0–40 cm showed a significant association with cotton yield (Fig. 16). Furthermore, RSD and RVD at a soil depth of 0–10 cm were significantly correlated with NO3−-N and NH4+-N concentrations (Fig. 16).
At the bud stage, N uptake was strongly correlated with RLD (10–25 cm) in both 2021 and 2022, and with RSD and RVD (10–20 cm) in 2022 (Fig. 17). Root morphology parameters (RLD, RSD, and RVD) at a soil depth of 10–20 cm were significantly associated with cotton yield (Fig. 17). However, root morphology parameters (RLD, RSD, and RVD) at a soil depth of 0–40 cm showed no obvious correlation with NO3−-N and NH4+-N concentrations (Fig. 17).
During the peak boll stage, RLD (15–30 cm), RSD (25–40 cm), and RVD (25–40 cm) exhibited significant correlations with N uptake in 2021 (Fig. 18). Similarly, RLD (5–40 cm), RSD (15–20 cm, 25–40 cm), and RVD (25–40 cm) showed significant correlations with N uptake in 2022 (Fig. 18). Moreover, RLD (20–40 cm), RSD (15–40 cm), and RVD (5–20 cm, 25–40 cm) displayed significant correlations with cotton yield in both 2021 and 2022 (Fig. 18). Additionally, RSD (10–15 cm, 30–40 cm) was significantly associated with NO3−-N and NH4+-N concentrations in both years (Fig. 18).
Furthermore, RLD, RSD, and RVD at a depth of 0–40 cm showed significant correlations throughout the cotton growth season in 2021 and 2022 (Figs. 16, 17, and 18), indicating interdependence among root morphological traits. Moreover, from the seedling to peak boll period, cotton yield demonstrated significant associations with N uptake and soil NO3−-N and NH4+-N concentrations at a depth of 0–40 cm in both 2021 and 2022 (Figs. 16, 17, and 18), highlighting the significant impact of N nutrients, especially plant N uptake, on cotton yield.