Differences in growth between G. hirsutum TM-1 and G. barbadense H7124 under salt stress
To compare the differences in salt tolerance between two cotton species, we first observed the morphological changes in TM-1 and H7124 under salt stress conditions for one week. As shown in Fig. 1A, TM-1 began to wilt on the first day after 400 mM salt treatment, and the leaves turned slightly yellow on the third day. While H7124 did not significantly change on the first day, the leaves began to curl and wilt on the third day, and the leaves began to exhibit few white spots on the fifth day. On the seventh day of salt stress, both cotton species were seriously wilted, but that of TM-1 was more serious. Subsequently, we investigated salt tolerance-related traits in the treatment group and the control group of two cotton species on the seventh day of salt stress (Fig. 1B). To eliminate the effects of differences in the growth of the two cotton species, the relative value of each trait was calculated by the ratio of the measurement under stress conditions to the measurement from control plants. The results showed that the differences in salt stress between the two cotton species were mainly manifested in the aerial part of the plant. The relative value of LA, PFW, and PDW of H7124 were significantly higher than those of TM-1, by 14.87%, 28.68%, and 15.91%, respectively. However, the relative R/S ratio of TM-1 were significantly greater than that of H7124 by 22.93% (Fig. 1C). These results suggested that there are significant differences in the growth of the two cotton species under salt stress, and that H7124 has a stronger ability to resist salt damage in the early stage of salt treatment, suggesting it possesses potential salt tolerance genes.
Differences in photosynthesis between G. hirsutum TM-1 and G. barbadense H7124 under salt stress
Through morphological observations, we found that leaves of cotton seedlings were greatly damaged after salt stress, which mainly manifested as leaf curling and wilting. Therefore, we measured the related-indexes of cotton seedling leaves. As shown in Fig. 2A and B, the REC and RWC were not significantly different between the two cotton species under normal conditions. However, under salt stress conditions, the REC of H7124 was lower than that of TM-1 by 22.96%, and the RWC of H7124 was higher than that of TM-1 by 9.80%. Interestingly, through SPAD measurements, we found that the SPAD value of TM-1 was higher than that of H7124 by 6.40% under normal conditions. However, the SPAD value of H7124 was higher than that of TM-1 by 5.37% under salt stress conditions (Fig. 2C). Furthermore, we measured the gas exchange parameters of leaves, the results showed that under normal conditions, the Pn and Cond of TM-1 were significantly higher than those of H7124, by 29.37% and 14.86%, respectively. However, under salt stress conditions, the Pn, Ci and Tr of H7124 were higher than those of TM-1, by 21.36%, 13.83% and 44.28%, respectively. (Fig. 2D-G). These results indicated that H7124 maintained higher cellular homeostasis and better photosynthetic protection mechanisms under salt stress, which can reduce the damage to plant leaves in the early stage of salt stress.
Differences in ion and osmotic balances between G. hirsutum TM-1 and G. barbadense H7124 under salt stress
The concentration of ions in plants is an important parameter for salt stress tolerance [19]. Therefore, the contents of Na+ and K+ were determined in cotton seedlings in the absence and presence of salt. Obviously, the Na+ content increased dramatically when the cotton seedlings were subjected to salt stress. Interestingly, there was no significant difference in the Na+ content between the two cotton species under either normal or salt stress conditions (Fig. 3A). Conversely, the K+ content decreased when the cotton seedlings were subjected to salt stress. However, the K+ content of TM-1 was higher that of H7124 by 11.66% under salt stress conditions (Fig. 3B), resulting in lower Na+/K+ ratio in TM-1 (Fig. 3C). The PRO content, which protects plant cells from osmotic stress, reflects the stress resistance of plants. As shown in Fig. 3D, we found that the PRO content of cotton increased dramatically when the seedlings were subjected to salt stress, but the PRO content of H7124 was higher than TM-1 by 19.51%. These results suggested that G. hirsutum TM-1 and G. barbadense H7124 respond to salt stress via different strategies. Of them, TM-1 has a strong K+ absorption capacity, which can reduce the damage caused by Na+ to plants under salt stress conditions, while H7124 has a stronger proline synthesis ability, which can reduce the damage caused by osmotic stress to plants under salt stress conditions.
Differences in antioxidant ability between G. hirsutum TM-1 and G. barbadense H7124 under salt stress
Salt stress causes ion toxicity and osmotic stress, which can lead to the accumulation of high levels of reactive oxygen species (ROS), resulting in ROS toxicity [20]. To detect differences in excess ROS levels between the two cotton species, the H2O2 contents of TM-1 and H7124 were measured in the absence and presence of salt stress. As shown in Fig. 3E, salt stress induced the accumulation of H2O2 in the cotton seedlings. Interestingly, there was a lower H2O2 content in H7124 compared to TM-1 under salt stress conditions, significantly decreasing by 25.71%. Malondialdehyde (MDA) is the final decomposition product of membrane lipid peroxidation, and its content can reflect the degree of plant oxidative injury [21]. Similarly, the MDA content also increased when subjected to salt stress. However, H7124 had a lower MDA content than that of TM-1 under salt stress conditions, significantly decreasing by 9.05% (Fig. 3F). Furthermore, we further measured the peroxidase (POD) activity of the cotton seedlings. As expected, POD activity in cotton seedlings was significantly induced by salt stress, and POD activity in H7124 was higher than that of TM-1, significantly increasing by 21.31% (Fig. 3G). Likewise, glutathione (GSH) content was also measured, similarly, the glutathione content was also induced by salt stress, and the GSH content of H7124 was significantly greater than that of TM-1, by 29.84% (Fig. 3H). These results were consistent with each other, supporting the conclusion that H7124 has stronger antioxidant ability, which can reduce the damage caused by excess ROS to plants under salt stress.
Global transcriptome analysis of G. hirsutum TM-1 and G. barbadense H7124 under salt stress
To characterize the transcriptional characteristics of these two cotton species, whole-genome expression was evaluated via RNA-seq under normal and salt stress conditions. The results showed that a total of 569.90 million raw reads were initially generated, of which there were approximately 47.49 million reads per sample. After quality control, approximately 567.19 million clean reads remained, with approximately 6.09 Gb per sample, and the Q20 and Q30 percentages of the clean data for all samples were greater than 95.21% and 90.38%, respectively. The GC content of clean reads in each sample was more than 43.25% (Table S1). The PCA results showed that the three replicates of each sampling group clustered well together (Fig. 4A). These results indicated that the clean reads were of high quality for further analysis.
Two different comparison groups were obtained through a comparison the differentially expressed genes (DEGs) of the same material between normal and salt stress conditions: TM-1 + salt versus TM-1 control (TS vs. TC) and H7124 + salt versus H7124 control (HS vs. HC). By analysing the number of DEGs in the two comparison groups, we found that there were significant differences in the response to salt stress between the two cotton species. In detail, a total of 3420 DEGs were identified in TM-1, namely, 1349 upregulated DEGs and 2071 downregulated DEGs, while there were a total of 2274 DEGs in H7124, namely, 1427 upregulated and 847 downregulated DEGs in H7124 (Fig. 4B; Table S2; Table S3). An intersection and union analysis of the different DEG sets was performed. There were 597 overlapping DEGs between TM-1 and H7124, which were considered to be the core genes whose expression is induced by salt stress. Furthermore, an overlapping set of 334 upregulated and 186 downregulated genes was involved (Fig. 4C). These genes showed similar expression patterns in both TM-1 and H7124 (Fig. 4D), suggesting that these genes may have vital effects on the response to salt stress.
Functional characterization of DEGs in G. hirsutum TM-1 and G. barbadense H7124
To explore the biological functions of the DEGs, KEGG pathway analysis was performed (Table S4; Table S5). We selected the twenty most enriched pathways from each comparison for further analysis (Fig. 5A and B). Some pathways were shared by the two comparisons, including plant hormone signal transduction, flavone and flavonol biosynthesis, starch and sucrose metabolism and MAPK signaling pathway-plant. Some pathways were uniquely enriched in TM-1 or H7124, such as porphyrin metabolism, DNA replication, photosynthesis, valine, leucine and isoleucine degradation and mismatch repair, which were significantly enriched only in TM-1 (q-value < 0.05). However, diterpenoid biosynthesis, carotenoid biosynthesis, plant-pathogen interaction, ubiquinone and other terpenoid-quinone biosynthesis, and brassinosteroid biosynthesis were significantly enriched only in H7124 (q-value < 0.05).
GO functional classification was applied to the DEGs to annotate the functional categories that are active and participate in salt treatment (Table S6; Table S7). For DEGs of TM-1, the top GO terms in the biological process were mainly related to metabolic process, regulation and stress response, such as DNA replication, leaf senescence, cell cycle, response to abiotic stimulus, response to biotic stimulus, response to oxygen-containing compound and so on. In the cellular component, thylakoid, cell wall and chloroplast were the main GO terms. In the molecular function, enriched GO categories were mainly involved in DNA-binding transcription factor activity, hydrolase activity and oxidoreductase activity (Fig. 5C). Notably, we found that in H7124, the top GO terms in the biological process were mainly related to stress response, including response to chitin, response to endogenous stimulus, response to acid chemical and response to stimulus etc. In the molecular function, DEGs were mainly related to nucleus, integral component of plasma membrane and central vacuole. In the molecular function, enriched GO terms were mainly involved transcription factor activity, dioxygenase activity, flavone synthase activity and oxidoreductase activity (Fig. 5D). These results indicated that there are significant molecular differences between the two cotton species in response to salt stress.
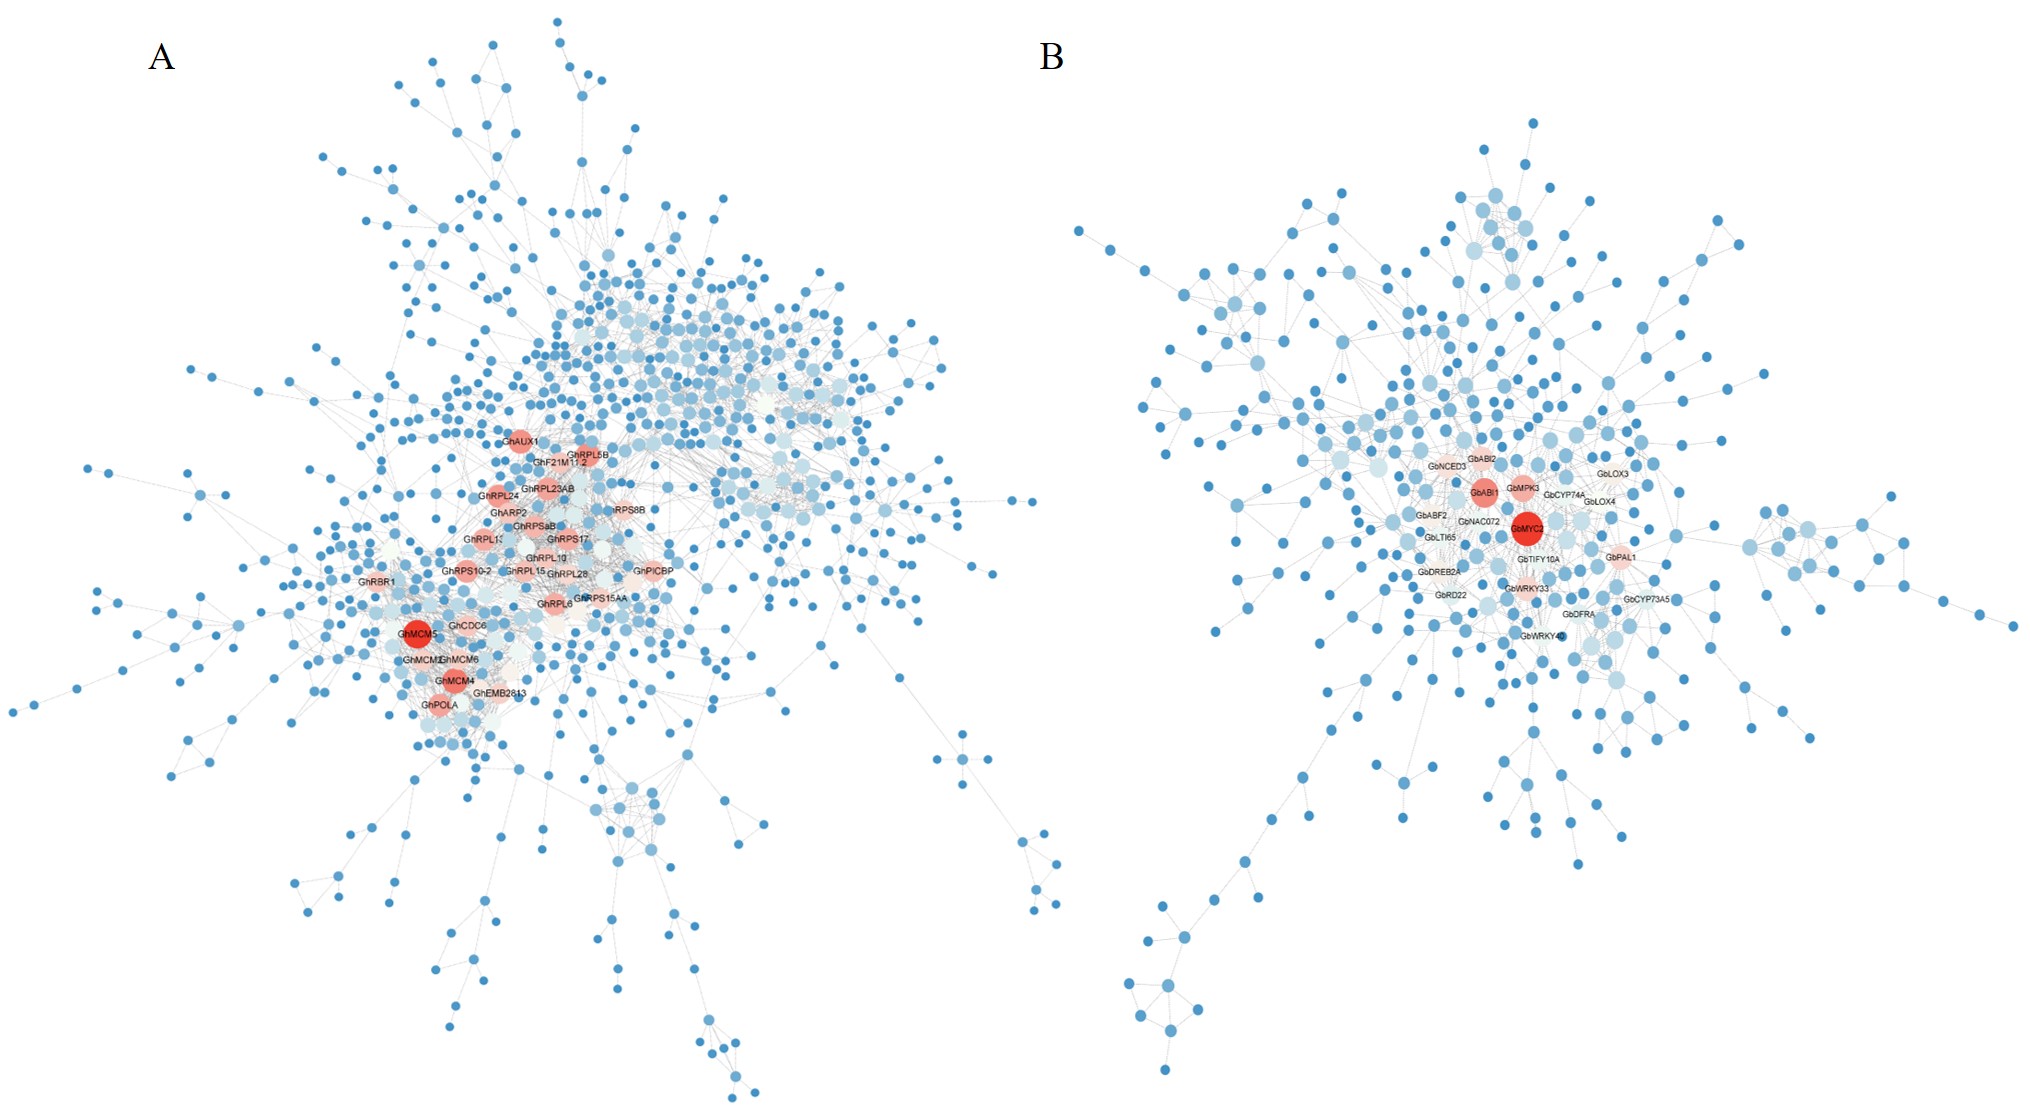
PPI network and comparation of the key modules between G. hirsutum TM-1 and G. barbadense H7124
Protein-protein interaction (PPI) network and topological attribute analysis can identify important network relationships between proteins from complex biological data. To further understand the functional categories of the DEGs, a PPI network analysis of TM-1 and H7124 was conducted. After removing disconnected nodes in the network, we obtained the PPI network of TM-1 with a total of 875 nodes and 2435 edges, involving 1513 DEGs (Fig. S1A; Table S8). And the PPI network of H7124 with a total of 388 nodes and 826 edges was obtained, involving 684 DEGs (Fig. S1B; Table S9). Proteins with a high degree of connectivity were considered to play potential key role in responding to salt stress for cotton. In the PPI network of TM-1, such as GhMCM5 (GH_A13G2142, GH_D13G2127), GhMCM4 (GH_A13G0305, GH_D13G0304), GhRPL5B (GH_A07G1775), GhAUX1 (GH_D13G0173), GhRPL24 (GH_A01G0706, GH_D01G0703), and GhRPL23AB (GH_A10G2350, GH_D10G2446) etc., showed higher degree values (≥ 25), which were mainly related to DNA replication, chloroplast protein and metabolism. Likewise, in the PPI network of H7124, such as GbMYC2 (GB_D12G1381), GbABI1 (GB_A13G2387, GB_D06G0736), GbMPK3 (GB_A03G0445, GB_A05G1024, GB_D03G1545, GB_D05G1000) GbWRKY33 (GB_A03G0338, GB_A04G1203, GB_D04G1581), GbABI2 (GB_A07G0128, GB_D07G0136, GB_D13G2337), GbPAL1 (GB_D04G1316), GbNCED3 (GB_A01G0351, GB_A08G2779, GB_A13G1899, GB_D01G0370, GB_D08G2765, GB_D13G1842), GbDREB2A (GB_A10G2377, GB_A13G0232, GB_D10G2344) etc., exhibited higher degree values (≥ 15), which were mainly related to transcription, regulation and metabolism.
To further compare the biological functions of the PPI networks of TM-1 and H7124, we identified the key modules through MCODE analysis, and performed comparative analysis of the DEGs involved through KEGG and GO enrichment. The results showed there were six key modules obtained from the PPI network of TM-1, including a total of 99 nodes and 717 edges, involving 172 DEGs (Fig. 6A). And there were three key modules obtained from the PPI network of H7124, including a total of 38 nodes and 109 edges, involving 69 DEGs (Fig. 6B). Furthermore, KEGG enrichment analysis showed there were eight pathways significantly enriched in TM-1 (q-value < 0.05), including porphyrin metabolism, DNA replication, Ribosome, photosynthesis, fatty acid biosynthesis, flavone and flavonol biosynthesis, circadian rhythm-plant, photosynthesis-antenna proteins. These pathways were mainly related to growth, development and regulation. However, there were seven pathways significantly enriched in H7124 (q-value < 0.05), including plant hormone signal transduction, circadian rhythm-plant, carotenoid biosynthesis, flavone and flavonol biosynthesis, MAPK signaling pathway-plant, phenylpropanoid biosynthesis, stilbenoid, diarylheptanoid and gingerol biosynthesis. These pathways were mainly related to plant defense (Fig. 6C; Table S10). Similar results were also found in the GO enrichment analysis. Most genes were related to metabolic process in TM-1, such as DNA replication, organic substance biosynthetic process, DNA metabolic process, cellular biosynthetic process, chlorophyll metabolic process, etc. Conversely, GO terms were mainly related to plant defense in H7124, including response to acid chemical, response to abiotic stimulus, regulation of primary metabolic process, response to chemical, response to osmotic stress, response to hormone, etc. (Fig. 6D; Table S11). These results showed key divergence in salt stress response between TM-1 and H7124. Further manipulation of these genes in stress response pathways or terms may help illustrate their putative regulatory role in environmental adaptation.
Identification of key salt tolerance genes
Physiological and biochemical measurements revealed differences in photosynthetic capacity, K+ content, osmotic regulation and antioxidant ability between TM-1 and H7124 (Figs. 2 and 3). Based on the transcriptome data, these four types of DEGs were identified in TM-1 and H7124, and considered to be key salt-tolerant genes, some of which were involved in key modules of the PPI network. There were 26 DEGs associated with photosynthesis, and most of them (22 genes) were significantly downregulated in TM-1. In H7124, only four genes were significantly down-regulated, and most of the genes did not change significantly (Fig. 7A and D). These results indicated that photosynthetic capacity of TM-1 is more severely inhibited under salt stress, which is consistent with our photosynthetic measurements. There were 20 genes associated with K+ transport, of which nine genes were significantly upregulated and three genes were significantly downregulated in TM-1. In H7124, only four genes were significantly upregulated (Fig. 7B and D). These results indicated that TM-1 has greater K+ absorption capacity under salt stress, which is consistent with our results. In addition, there were nine genes related to proline metabolism, of which five genes were significantly upregulated and three genes were significantly downregulated in TM-1; In H7124, three genes were significantly upregulated and only one gene was significantly down-regulated, while most of the genes were not significantly differentially expressed (Fig. 7B and D). Interestingly, our previous results suggested that the higher proline content in H7124 than in TM-1 may be due to a lower number of genes downregulated in H7124. Further, we identified 55 antioxidation-related genes, including POD-coding genes, and genes related to glutathione metabolism, ascorbate metabolism and flavonoid biosynthesis. Notably, we found that 28 genes were significantly downregulated in TM-1, and only 6 genes were significantly up-regulated. In contrast, in H7124, 30 genes were significantly up-regulated, and only four genes were significantly downregulated (Fig. 7C and D), which was consistent with my measurement results above.
Furthermore, plant hormone signaling plays an important role in plant response to abiotic stress. Therefore, we also mined genes related to plant hormones. A total of 108 DEGs were identified, mainly involving abscisic acid, auxin, brassinosteroid, ethylene and jasmonic acid. There were 24 genes related to abscisic acid, and most of them (15 genes) were significantly upregulated in H7124. In TM-1, only six genes were significantly up-regulated, and most of the genes did not change significantly (Fig. 8A and D). There were 41 genes related to auxin, among which 16 genes of TM-1 were upregulated and 13 genes were down-regulated. In H7124, only seven genes were significantly upregulated and 15 genes were significantly downregulated (Fig. 8B and D). There were 15 genes associated with brassinosteroid, among which 6 genes in TM-1 were upregulated and six genes were down-regulated. In H7124, only four genes were significantly up-regulated, and the other genes did not change significantly (Fig. 8C and D). Fifteen genes were related to ethylene, of which ten and six genes were upregulated in TM-1 and H7124, respectively, and no significant changes were detected in the other genes (Fig. 8C and D). There were 13 genes associated with jasmonic acid, of which two genes were significantly downregulated in TM-1 and only one gene was significantly up-regulated. However, ten genes in H7124 were significantly upregulated (Fig. 8C and D). These results indicated that there are significant differences in plant hormone regulation between the two cotton species under salt stress. H7124 mainly responds to salt stress by up-regulating ABA and jasmonic acid-related genes, while TM-1 mainly responds to salt stress by auxin and ethylene related genes.
Verification of key salt-tolerant genes by previous GWAS results
Based on seven GWAS studies, there were a total of 841 significant SNPs related to salt tolerance obtained in cotton (Fig. 9; Table S12). The distribution of these SNPs on each chromosome was different. Most of the significant SNPs were located on D08 (46), while only six SNPs was were located on A08. In general, the LD decay of GWAS population could be used as confidence interval of significant SNPs in the genome. The LD decay of these seven GWAS studies varied from 200 to 869 kb, with an average LD decay of 500 kb, so confidence intervals of significant SNPs were identified within 500 kb upstream or downstream of peak SNPs. To determine the accuracy of the identified salt-tolerant genes, the above 217 genes were compared with confidence intervals of 841 significant SNPs. The results showed there were 167 genes overlapping confidence interval of significant SNPs. The number of overlapping genes on each chromosome varied, ranging from 15 for A05 to 2 genes for D03. These results indicate that 167 of the 217 salt-tolerant genes identified in this study overlap with previous GWAS reports, indicating their high reliability.
Validation of key salt-tolerant genes by qRT-PCR
Based on function and comparative analysis with previous GWAS results, we selected ten key salt-tolerant genes to monitor their expression levels at different time points under salt stress in TM-1 and H7124 (Fig. 10A). GH_A08G0880 was mainly related to potassium transporter, and its expression trend was upregulated upon salt induction, peaking at 12 h, and then decreased. Notably, we observed higher expression levels of GH_A09G0318 in TM-1 compared to H7124, indicating TM-1 has stronger K+ absorption capacity (Fig. 10B). The expression trend of GH_D06G1914 was continuously downregulated by salt induction, which was mainly related to photosynthesis. However, there was higher expression level in H7124 compared to TM-1 (Fig. 10C), indicating that H7124 has a better photosynthetic protection mechanism to reduce the damage of salt stress on plants. GH_A09G1908 and GH_A07G0814 were related to peroxidase and glutathione metabolism, respectively. Their expression trends were similar, namely, salt-induced upregulated expression, peaking at 6 or 12 h, and then decreased. However, there was higher expression level in H7124 compared to TM-1, showing H7124 has stronger antioxidant capacity under salt stress (Fig. 10D-E). GH_A04G1046 were continuously upregulated by salt induction, which were associated with proline metabolism. The expression level of GH_A04G1046 was higher in H7124 upon salt stress, indicating H7124 has a stronger osmotic regulation ability (Fig. 10F). Furthermore, the expression of five plant hormone-related genes was also detected. GH_A05G0933 and GH_D06G0153 were related to abscisic acid and brassinosteroid, respectively. Their expression trends were similar, namely, salt-induced upregulated expression, peaking at 12 h, and then decreased (Fig. 10G and J). The expression of GH_A02G0373 and GH_A01G0218 fluctuated induced by salt stress at different time points, which were related to auxin and jasmonic acid, respectively (Fig. 10H and I). However, GH_A09G1664 were continuously upregulated by salt induction, which were associated with ethylene signaling (Fig. 10K). Notably, with the exception of GH_D06G0153, the expression levels of these genes in H7124 were higher than those of TM-1, suggesting their potentially pivotal role in improving plant salt tolerance.