Ethics Approval Statement. This cluster randomized controlled trial (RCT) received research ethics approval from the [BLINDED] Research Ethics Committee. Early Years education settings opted into the study after receiving information about all its elements. Parents and guardians decided whether to opt out from the study by communicating this to settings, preserving their anonymity. This opt-out model of participation was selected because it is more likely to represent families and children from socio-economically disadvantaged backgrounds in longitudinal designs (Bray et al., 2015).
Participants.
Child-level demographics. The study sample consisted of 193 children (Mage at baseline = 47.2 months, range=41-54; 111 female; reported ethnicity: 69% White, 16.1% Asian, 10.3% Multiple Ethnic Groups, 2.3% Black, 2.3% Other). Child demographics by intervention and control group are reported in Table 1. Economic disadvantage was identified by using eligibility for Early Years Pupil Premium (EYPP). Eligibility for this program in England includes family annual income below GBP 16,190 and/or meeting other high-risk criteria (e.g., asylum seeker status). EYPP eligibility is therefore an index of economic disadvantage, although it may underestimate disadvantage, because parents who are eligible do not all apply (for reasons associated with stigma, social desirability, and / or administrative barriers in the application process, Roberts, Griggs, & Robb, 2017). EYPP eligibility was assessed based on reporting by the child’s nursery school (N=147) and parent-reported income (N=77). Of the 161 children (83.4% of the sample) for which these data were available, 24.8% (N = 40) were deemed eligible for EYPP (higher than the 14% national UK average for 2022; UK Government, 2023). Of note, when the study was conducted, all 3- to 4-year-olds in England were eligible for at least 15 hours of free preschool, whether they attended a private setting or not, making preschool an appropriate environment to target disadvantage, because preschool was accessible to all. The control group and the intervention group were well matched in terms of age in months, sex, EYPP eligibility and school readiness (see Table 1).
Table 1. Summary of demographic information for control and intervention children
|
Measure
|
Control
|
Intervention
|
Difference
|
|
Number participants (N)
|
90
|
103
|
|
|
Age pre-intervention (months, SD)
|
47.2 (.36)
|
47.3 (.37)
|
n.s. (p = .841)
|
|
Sex (% female)
|
56.7
|
58.3
|
n.s (p = .824)
|
|
EYPP eligibility (% eligible)
|
21
|
28
|
n.s. (p = .406)
|
|
Special educational needs (SEND) (%)
|
6.7
|
4.9
|
n.s. (p = .497)
|
|
English spoken at home (%)
|
80
|
68
|
n.s. (p = .155)
|
|
Average BESSI score
|
1.16
|
1.19
|
n.s. (p = .329)
|
Note. For children for whom information was not returned, the data were treated as unknown. Ethnicity was reported by (voluntary) completion of a parent questionnaire. 87 parents (45%) returned this information. The Brief Early Skills and Support Index (BESSI, Hughes et al., 2015) is a teacher-reported a measure of school readiness, with higher scores representing lower school readiness. Items cover: (1) behavioural adjustment, (2) language and cognition, (3) daily living skills, and (4) family support. Each item is given a score of 1 (strongly agree or agree) or 2 (strongly disagree or disagree), with a higher score representing more problem behaviours.
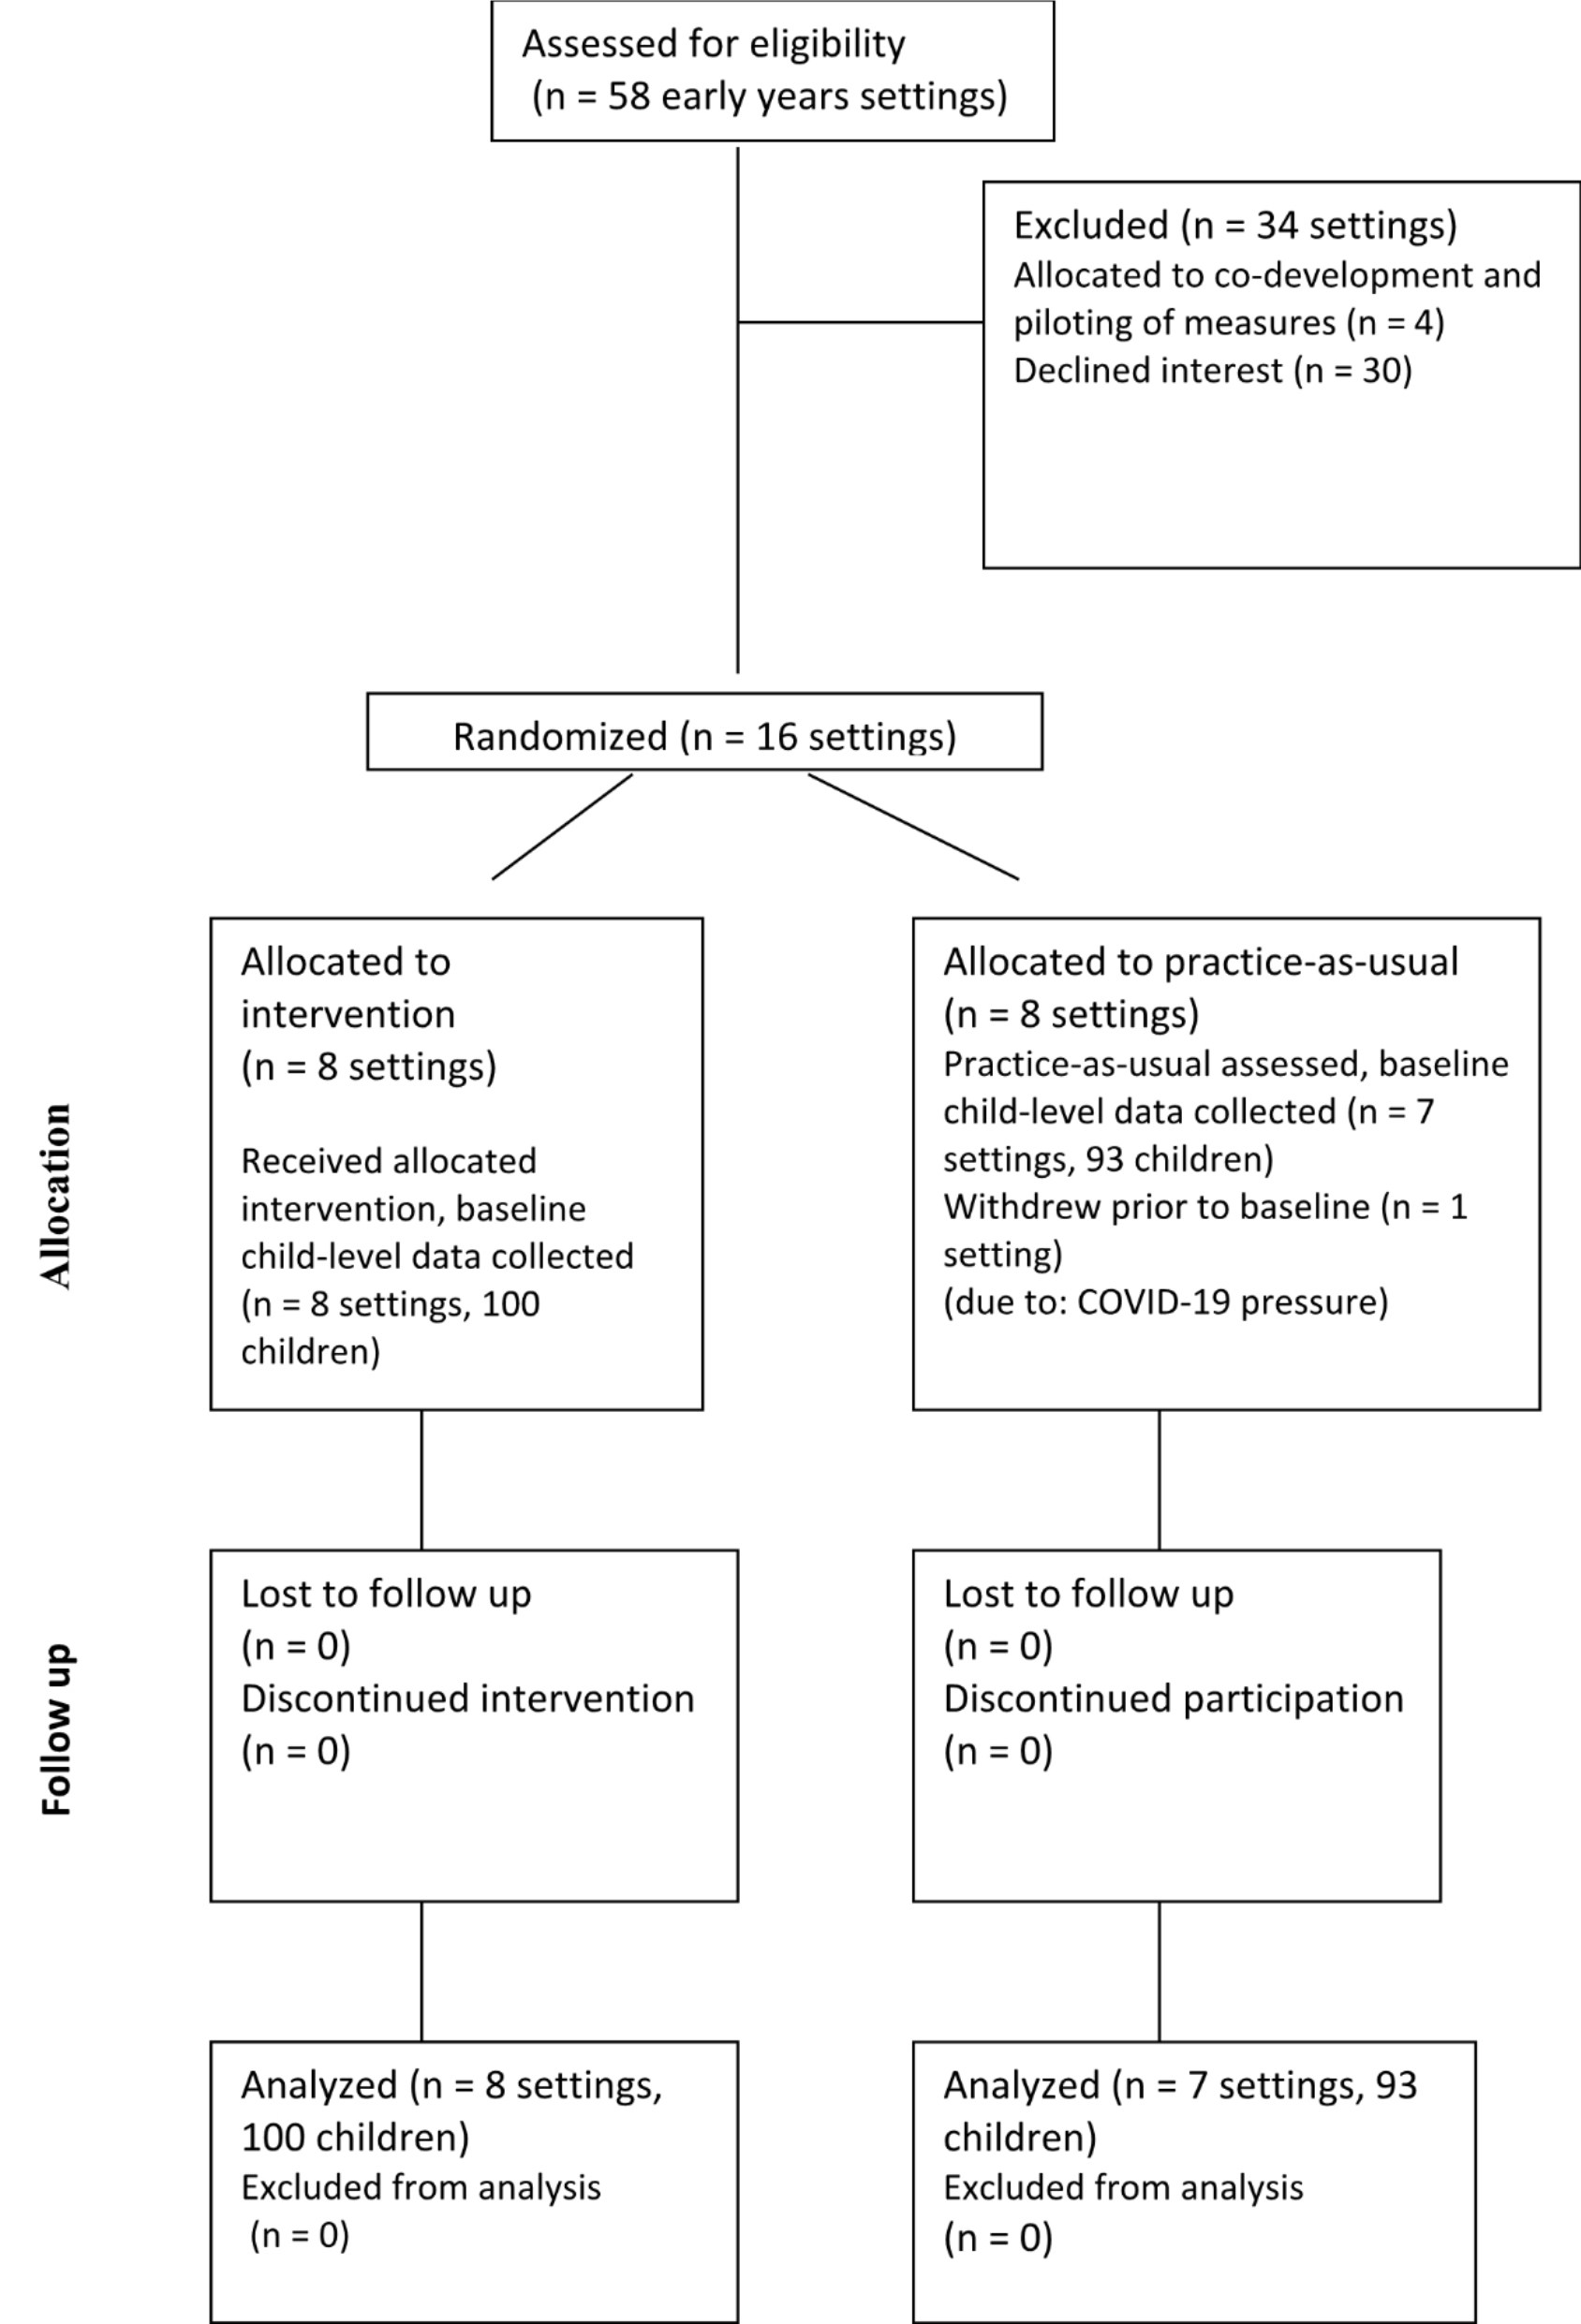
Setting-level characteristics. Fifty-eight settings were approached to take part in this research on the basis of geographical spread and feasibility of travel from [BLINDED], of which 20 (34.5%) consented to take part (see CONSORT diagram). Four of those services took part in an initial co-development phase of the research, with the other 16 participating in this RCT evaluation of The ONE Programme reported here. Settings were randomized to either the control group or the intervention group by a research team member who had not interacted with any of the settings, stratifying on the basis of setting size (large / small), setting type (private or not) and UK-based neighbourhood disadvantage metrics (the Indices of Multiple Deprivation (IMD) decile and Income Deprivation Affecting Children Index (IDACI) based on the postcode of the preschool, UK Government, 2022). The process allocated 8 settings to the intervention and 7 to the control group (one control setting withdrew due to ongoing COVID-19 pressures), well matched on stratification variables (see Table 2).
Table 2. Summary of characteristics for control and intervention settings
|
Measure
|
Control settings
|
Intervention settings
|
Difference
|
|
Number of settings
|
7
|
8
|
|
|
IMD (SD)
|
5.5 (2.62)
|
5.5 (2.14)
|
n.s. (p = 1.0)
|
|
IDACI (SD)
|
5.0 (2.39)
|
5.0 (2.82)
|
n.s. (p = 1.0)
|
|
Average number children per setting (SD)
|
30.7 (25)
|
30.9 (21)
|
n.s. (p = .725)
|
|
Setting type (% private)
|
62.5
|
42.9
|
n.s. (p = .317)
|
Note. Characteristics of settings volunteering into the study. IMD = Index of Multiple Deprivations, Indices of Multiple Deprivation decile; IDACI = Income Deprivation Affecting Children Index decile, with scores ranging from 1 to 10, with lower scores indexing greater deprivation.
In addition, prior to randomization and to pre-intervention child assessments, settings were observed via a half-day observation of interactional quality of the Early Years environment and interactions, using the Sustained and Shared Thinking and Emotional Wellbeing Scale (SSTEW, Siraj et al., 2015). The SSTEW scale was developed to assess the quality of interactions between adults and children in early years childhood education settings, and its overall score predicted early numeracy indices in a large sample of Australian pre-schoolers (Howard et al., 2018). We supplemented SSTEW by bespoke mathematics observation items, capturing interactional quality in the context of counting and cardinality, shape and spatial awareness, patterning and ordering, and numerical knowledge. This observation schedule yielded a score per setting that allowed us to evaluate setting comparability in the adult support that was already provided to children in each setting. In addition, it allowed us to model the effects of our integrated intervention on children, while controlling for how children were nested in settings that varied in terms of baseline interactional quality (see Analysis Plan). Settings in the control and intervention group were well-matched in terms of the quality of Early Years interactions (Mintervention = 4.27, SD = 1.48; Mcontrol = 4.01, SD = 1.85).
Procedure.
Intervention Group. The intervention protocol was co-developed with early years practitioners and consisted of: four weekly 30-minute face-to-face interactive workshop-style PD sessions with Early Years Practitioners followed by eight weeks remaining weeks. The four sessions supported practitioners’ explicit understanding of how early mathematics and EF co-develop, introduced 25 Mathematics + EF activities, and explained how EF can be embedded into a range of routine early mathematics learning activities. All activity cards described their mathematical content and executive demands explicitly. The activities ranged from EF-enhanced modifications of common early childhood games (e.g., “What’s the Time Mr Wolf?”, with embedded executive demands – e.g., “We do not walk if Mr Wolf says... ‘it’s 2 o’clock’”), to more novel activities introducing challenge in EF and mathematics through play (e.g., “Number Robot”, a handmade cardboard function machine requiring cognitive flexibility to apply mathematical functions, Moss et al., 2016). All activities started with mathematical content and EF challenge at a base level. Instructions and training were provided to scale complexity as the activities became familiar to children.
Activities were designed to use low-cost and readily available materials. In consultation with pilot settings and early years specialists, the activities were explicitly designed to be chosen flexibly each week by teachers, rather than in a fixed order, to suit each setting’s context, given the diversity of setting types (e.g., presence or absence of outdoor space, preference for small or large group activities), thereby maximising acceptability and feasibility. Preschool staff were asked to implement a minimum of three of these activities per week with 3- to 4-year-old children at their setting, for the 12-week duration of the programme. The intervention was carried out at the whole-class level and was not targeted towards specific groups of children.
Despite flexibility and choice, there were core demands made of all educators, and these core demands reflected the theory of change of the intervention that were explicitly explained to classroom educators. First, that the three activities undertaken within a week should be chosen to target breadth in mathematical content, by choosing one activity in each of the three key areas of mathematics represented in the activity pack (numbers and counting, patterns and ordering, space and shapes). Practitioners were asked to play the activities in their basic form in weeks 1 – 8 of the programme, but in Week 8 they were reminded to increment the executive challenge of chosen activities as children became increasingly familiar with them. In addition to the recording of activities on a poster provided to log adherence, one representative per setting was contacted in the 8th and 12th weeks to enable practitioners to reflect on how the programme was going, to enable a member of the delivery team to provide support, and, in Week 12, to conduct an interview (establishing acceptability and barriers of the programme) and an observation (to check fidelity of delivery).
Control Group. We compared the group of children nested in settings receiving the intervention to a practice-as-usual control group of children who received standard early years education following the Early Years Foundation Stage curriculum (Department for Education, 2020). We were specifically interested in whether the programme improved children’s mathematical skills above and beyond teaching in mathematics that is already embedded in the curriculum. As the intervention took place in early years settings, children and educators in the practice-as-usual settings were not passive: children in this group received instruction and teaching by their educators, following standard practice that aims to foster socio-emotional self-regulation and mathematical skills as set out in the curriculum. We aimed to capture these practices across all settings via structured observations, while contrasting explicit EF and mathematics integration to practice-as-usual levels of integration. Our trial design was in line with education trials, guided by policy-makers and practitioners, who want to know whether a programme works above and beyond usual practice.
Pre and Post-Intervention Assessments. All children were tested individually across two 30-minute sessions, counterbalanced across children, on two separate days, both before and after the intervention period. Random assignment to either the intervention or practice-as-usual arm occurred after completion of baseline data collection. Post-intervention child-level assessments were carried out by researchers who were blind to trial arm allocation, on average 5 months after the pre-intervention assessments.
Mathematics. General numeracy - Early Years Toolbox – Numeracy (Howard et al., 2021). The early years toolbox numeracy (EYTN) task is a tablet-based measure of general numeracy skills. Interspersed items on the task pertain to various mathematical domains: number sense, cardinality and counting, numerical operations, spatial and measurement constructs and patterning. The total accuracy score was used for analysis, with one point scored for each correct item.
Specific mathematical skills. Count High (Coolen et al., 2021). To assess children's counting skills, children were instructed to count as high as they could and the highest number reached without having made any mistakes was recorded, stopping at 100 as maximum. Give N (adapted from Cahoon et al., 2021). A version of the Give-N task was used as a measure of cardinality, following the adapted procedure outlined by Cahoon et al. (2021). Children were asked to place a given number of plastic fruit on a plate for 3 blocks of 5 trials, using numbers 3, 4, 6, 11 and 15. The final score was the number of correct trials out of a possible 15. Number Comparison (adapted from Nosworthy et al., 2013). This task is designed to measure children’s digit comparison abilities. Two number digits (1-9) were presented side by side on the screen of a tablet and the child was asked to tap the larger of the two numbers. The final score was calculated as a proportion of numbers correct out of all items answered within 1 minute. Number naming (Nosworthy et al., 2013). As a measure of symbolic number knowledge, children were presented with each digit from 1-9 twice on a screen in a random order, resulting in 18 total digits. The researcher pointed at each digit in turn, asking the child, “What number is this?”. The score used was the number of correct items out of a possible 18. Order Processing (Cahoon et al., 2021). Children were presented with a set of three number cards, each containing one Arabic numeral (1-9), which they were asked to place in order from smallest to biggest. Following 4 practice trials, there were 12 main trials. The task ended after six cumulative mistakes. A total score out of 12 was calculated for analysis. British Ability Scale - Pattern Construction. The pattern construction scale from the third edition of the British Ability Scale (BAS3; Elliott, & Smith, 2011), was used as a measure of spatial ability. This scale requires children to copy spatial patterns using wooden blocks, foam squares and plastic cubes with different patterned and coloured sides. A standardised t-score based on the child’s age in months was used for analysis.
Executive Function. Corsi Blocks Task (following Blakey et al., 2020). This is a measure of children’s visuospatial short-term memory. Nine wooden blocks were attached to a white piece of cardboard in a random array. The researcher tapped blocks in a pre-set random order and the child was instructed to tap the same blocks. For each span level (e.g., 2 block-sequences), the child completed 3 trials. If 2 or more trials were correct, the child progressed onto the next span level (up to 6 block-sequences). The variable used for analysis was the overall number of correct trials, regardless of sequential order. Mr Ant (Howard & Melhuish, 2017) is a visuo-spatial memory task presented on a tablet in which the child is asked to remember the location of colourful ‘stickers’ placed on different body parts of a cartoon ant. In each trial, the stickers are presented one after the other. A blank ant then reappears and the child is asked to indicate where the stickers had previously been, by tapping those locations. There are three trials in each block, with the child progressing to the next block if they are correct on at least one trial, regardless of sequential order. A score was calculated as one point for each consecutive level, beginning from the first, with 2 or 3 items correct; then, from the first level with only 1 item correct, 0.33 points for each correct item. Rabbits & Boats (Howard & Melhuish, 2017) is a tablet-based shifting task, based on a traditional card sort task. Across three blocks, the child must sort cards first according to colour (red/blue), then to shape (rabbit/boat), and finally switching the rule depending on whether or not there is a black border. Each block contains 6 trials and the child must get at least 5 trials correct on blocks 1 and 2 in order to progress to block 3. A switch accuracy score, calculated as the sum of correct responses in blocks 2 and 3, was used for analysis. Fish-Shark Go/No-Go (Howard & Melhuish, 2017) is a tablet-based task of inhibitory control. Fish and sharks move across the screen, one by one in pseudo-random order, and the child is instructed to tap the fish (go trials) and not tap the sharks (no-go trials). There were 3 blocks of 25 trials, each consisting of 20 go trials and 5 no-go trials. Proportional go and no-go accuracy scores were multiplied to create an overall impulse control score, which was used for analysis. In addition, data reduction (via exploratory factor analysis) was employed to investigate our hypothesised one-factor latent structure of EF skills for this sample (in line with the existing literature in this age group, e.g., Wiebe et al., 2011; Coolen et al., 2021). A single factor with an Eigen value greater than 1 was identified, accounting for 47% of the variance in EF scores, and EF latent factor scores were produced. The latent factor scores provided a single variable for EF comparable to the single composite variable for overall numeracy, EYTN. Information on reliability for these measures is detailed in the Supplementary Online Materials, for brevity.
Data Analysis Plan: Transparency and Openness Section
We pre-registered the trial design and measures on Open Science Framework prospectively, before data were collected [ANON]. As recommended by the APA Journal Article Reporting Standards (JARS) for quantitative, qualitative, and mixed methods research, we report how we determined our sample size, all data exclusions (no data exclusions were employed), all manipulations (no data transformations were employed), and all measures in the study. Anonymized data and analysis code are available at [ANON]. Our planned child-level efficacy outcomes variables were early mathematics and EFs measures, as reported at [ANON]. An intention-to-treat analytical approach (with all children in settings that had been randomized to the intervention included in the intervention arm) was employed, consistent with other educational trials (e.g., Brown et al., 2023). The efficacy analysis was carried out using IBM SPSS v 29.0. The network analyses were exploratory and were conducted in R statistical software (version 4.2.2, R Core Team, 2022) using packages qgraph (version 1.9.3, Epskamp et al., 2012), bootnet (version 1.5, Epskamp et al., 2018) and networktools (version 1.5.0, Jones, 2022).
Pre-registered:
Intervention Efficacy Analyses. Target sample size (N = 240 children) was determined a priori using G*Power 3.1 (Faul et al., 2009) to afford power greater than .80 to detect a small (f2=0.10, as expected for educational intervention) interaction effect for intervention arm (integrated, BAU) and timepoint (pre-intervention, post-intervention), with alpha=0.05, repeated measure correlation of .8, with up to 20% attrition. Due to ongoing COVID-19 impact (e.g., nursery staff turn-over, lower time availability for settings), one setting withdrew from the study before pre-intervention assessments and parents of one child withdrew data from the study. The final N was N = 193. No data were excluded. Deviations from pre-registration. We had planned to use two-way mixed ANCOVAs, but missing data (average univariate missingness = 5.8%; maximum univariate missingness = 17.6%) and distributional violations required approaches that deviated from the pre-registered analyses. Multi-Level Linear Modelling (MLM) with restricted maximum likelihood estimation (REML) was employed to model main effects over and above Time 1 individual differences, because this is robust to moderate to small proportion of missing data and to distributional violations (Snijders & Bosker, 2012). MLMs modelled the effects of Time (Time 1, Time 2), Intervention group (Control, Intervention), and Early Years Pupil Premium (EYPP) eligibility (EYPP; Yes, No, Unknown). Time and participant data were modelled as repeated effects. Setting-level differences in baseline scores for interactional quality (SSTEW, Siraj et al., 2015; BLINDED) were modelled as random effects. Nesting of children-level data within settings was employed to model setting level variables (e.g., baseline differences in interactional quality as above, SSTEW) and child-level variables (e.g., EYPP eligibility). We computed effect size using Hedge’s g.
Exploratory:
Network Analyses. To explore the structure of the relationships between all EF and mathematics variables at once, rather than focusing on bivariate correlations or univariate changes from pre- to post intervention, we implemented Gaussian graphical network models based on a regularised partial correlation network using Spearman correlations (Epskamp & Fried, 2018). The EF and mathematics tasks were represented as nodes in each network, while the partial correlations between the tasks represented the network edges (i.e., connections between nodes). To test whether this integrated intervention led to greater changes in the network structure than practice as usual, we tested overall network change by calculating the correlation coefficients between all edges of the network (i.e., the connections between the nodes) pre- and post-intervention, in the intervention and the control group. To further characterise the estimated networks, we tested the relative importance of each node in the network by calculating centrality indices: strength, expected influence, closeness, and betweenness all characterise the connectedness of nodes in a network. The Strength index refers to the absolute sum of all edges (i.e., correlations) to a particular node (e.g., all paths to a mathematics node). In contrast, Expected Influence takes into account whether an edge (a correlation) has a particular sign (positive or negative). Betweenness refers to how often a node is on the shortest path between other nodes, and Closeness refers to a mean distance from a node to all other nodes in the network. Additional node and edge stability are reported in Figure S4 and S5. In addition to interrogating the importance of individual nodes in the network, we tested whether there are any prominent bridge nodes between EF and mathematics nodes, i.e., nodes in one group that are most strongly connected to all nodes from the other group. The detection of bridge nodes enabled us to determine the strongest links between domains, i.e., which EF node was most strongly connected to mathematics nodes, and vice versa. Finally, to determine whether there were clusters of nodes in the network, and whether the cluster structure changed with the intervention, we ran cluster analysis. In graph-based approaches, the presence of clusters shows that some nodes are more strongly related than others and it is determined via a data-driven approach.