Work-flow
All experiments were performed in accordance to Boehringer Ingelheim’s compliance committee and relevant guidelines and regulations were followed. All the experimental protocols were approved by Boehringer Ingelheim’s licensing committee.
iPSC from BJ skin fibroblasts were purchased from Genome Engineering and Stem Cell Center, Wahington University, St.Louis to generate the iSCAR model.
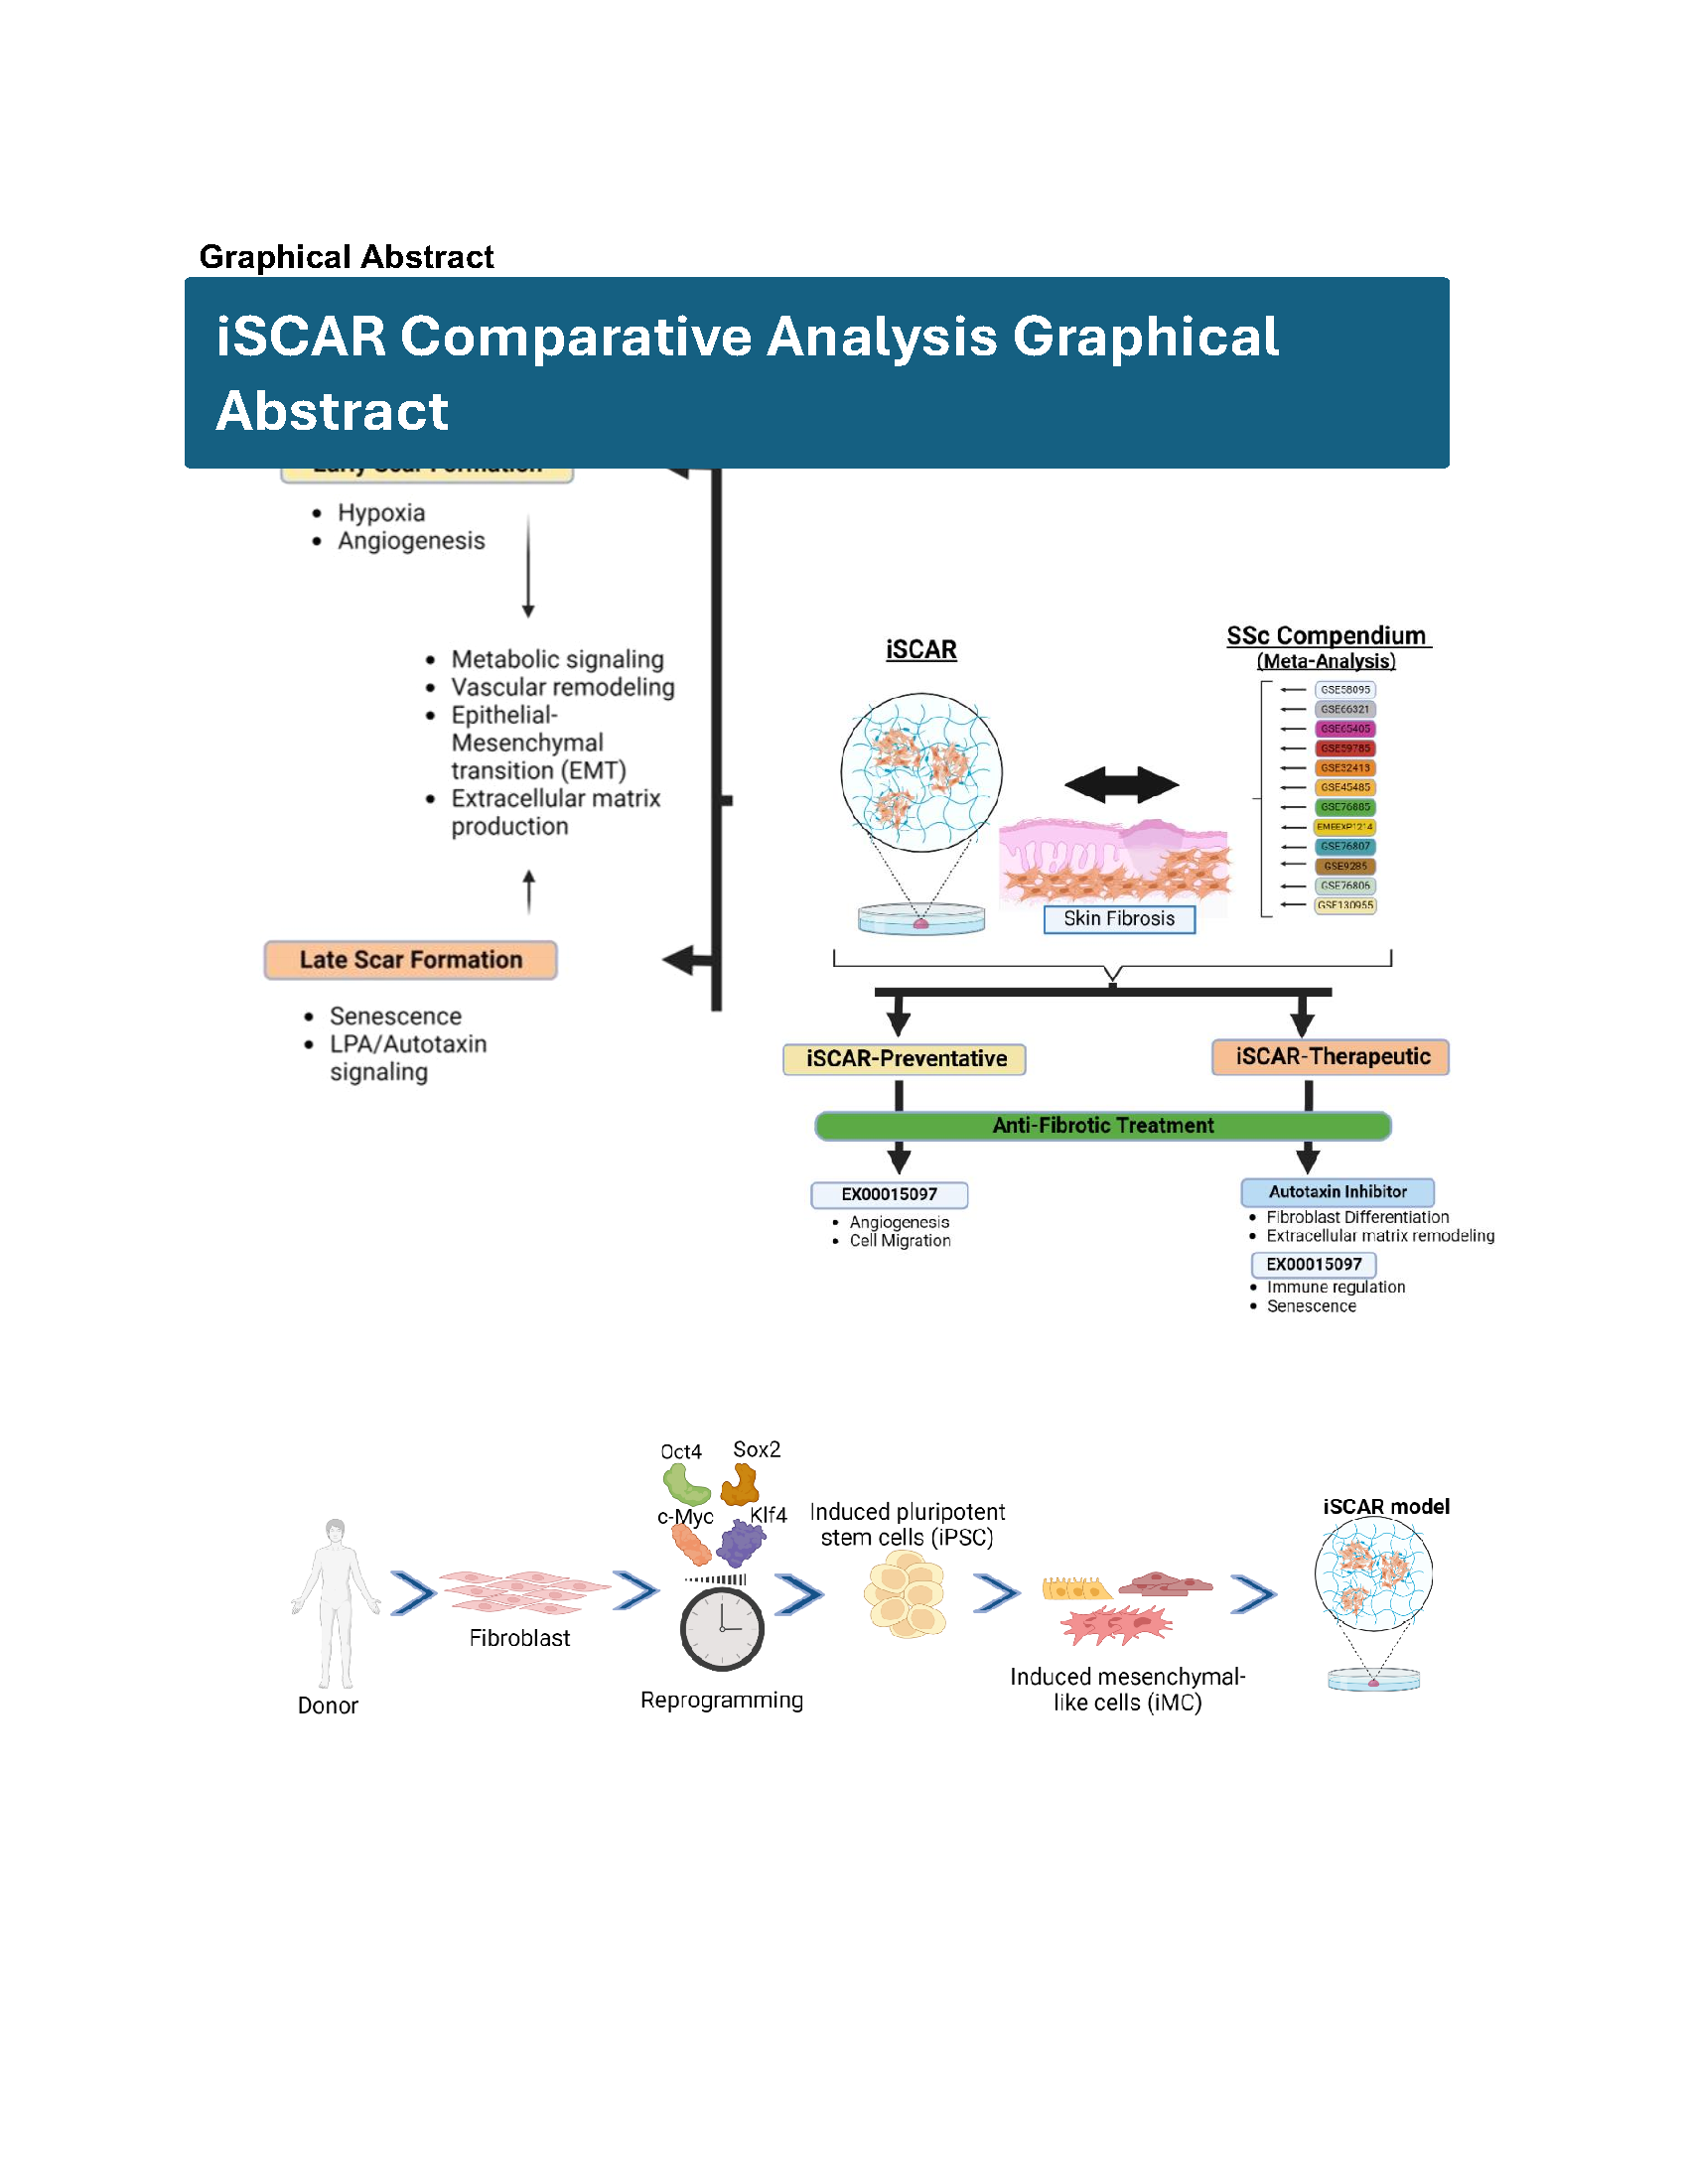
In this iSCAR-SSc comparative study, we mapped gene sets from an iPSC-derived “iSCAR model” onto a gene level SSc compendium matrix to validate the utility of the iSCAR model as in-vitro antifibrotic screening tool in context of SSc (Fig. 1a and 1b). The iSCAR model involves skin induced pluripotent stem cell (iPSC)-derived mesenchymal-like cells (iMCs) cultured on a stiff 12-kPa polyacrylamide hydrogel to model the complex phenotype found in progressive fibrotic diseases (Fig. 1a) as previously published5. When cultured on the hydrogel, the iMCs develop a scar-like phenotype that mimics a wound-healing response involving a scarring phase5. The overall work flow consists of two major steps: A. Characterizing the iSCAR model in the context of early- and late- stage scar formation and B. Validating the utility of the model as a fibrotic in-vitro screening tool by testing both an anti-fibrotic compound with a known mechanism and a novel compound that has not been fully characterized but shows promising anti-fibrotic potential8.
We conducted three iSCAR assays to mimic early and late-stage scarring. In the first (iSCAR-Ctrl), iMCs from Skin iPSCs (a gift from the Genome Engineering & iPSC Center at Washington University in St. Louis) were cultured on plastic for 48 hrs in the presence of either DMSO, 3 µM autotaxin inhibitor or 5 µM of a novel anti-fibrotic compound EX00015097 [AA5]5, to simulate “no scar” formation. The compound concentrations for analysis were selected at IC80 concentrations in all the iSCAR assays, and each treatment was performed in triplicate. In the second (iSCAR-P), iMCs were cultured on 12kPa easy-coat hydrogels (Matrigen) coated with 0.1% gelatin (Stem cell technologies) for 48hrs in the presence of the above compounds to simulate “early scar” formation and preventative treatment. In the third (iSCAR-T), iMCs were cultured on hydrogels for 13 days after which compounds were added after scar establishment for 48 hrs to simulate “late scar” formation and therapeutic treatment. RNA was isolated at the end of each of the assays for sequencing. To validate the utility of iSCAR-P or iSCAR-T as an early or late in-vitro antifibrotic screening tool in context of SSc, we studied the enrichment of significant genes following treatment with the autotaxin inhibitor or EX00015097 within the SSc bulk RNA-seq compendium created from 12 publicly available sources6 and an SSc single cell atlas created from 3 publicly available sources. After validating that the autotaxin inhibitor or EX00015097 treated iSCAR gene sets were significantly and positively enriched in dSSc and lSSc, we studied the differential effect of the autotaxin inhibitor and EX00015097 within the iSCAR model (Fig. 1b).
iSCAR data analysis
RNA-seq reads from iSCAR experiments were mapped to human reference genome GRCh38 using RNA STAR9. The mapped reads were run through featureCounts10 for read summarization. featureCounts returned a counts matrix, which was then subject to differential gene expression analysis in DESeq2 with design factor “~ 0 + Endpoint_Source_Treatment + Replicate_Number”11. In DESeq2, the following contrasts were made to study early and late scar formation: iSCAR-P DMSO vs iSCAR-Ctrl DMSO, iSCAR-T DMSO vs iSCAR-Ctrl DMSO, and iSCAR-P DMSO vs iSCAR-T DMSO. Contrasts were made for each of the 3 iSCAR experiment endpoints to study the antifibrotics: EX00015097 vs DMSO and Autotaxin inhibitor vs DMSO. The criteria for selection of differentially expressed genes significantly increased (“UP”) or decreased (“DOWN”) compared to DMSO control is p < 0.05 and logFC < -1.5/ logFC > 1.5. This returned 4 different groups (EX00015097 vs DMSO DOWN, EX00015097 vs DMSO UP, Autotaxin inhibitor vs DMSO DOWN, and Autotaxin inhibitor vs DMSO UP) for each iSCAR experiment. The selected genes in each group would comprise the iSCAR gene set list for that group.
SSc study collection and the creation of the SSc bulk RNA-seq compendium matrix
We used 12 datasets for our analysis (GSE9285, GSE32413, GSE45485, GSE58095, GSE59785, GSE76885, EMEXP1214, GSE76807, GSE76806, GSE66321, GSE65405, and GSE130955). All the datasets are from microarray, with one exception of bulk RNA-seq data GSE130955. We focused on baseline SSc patients’ skin biopsy samples and major SSc phenotypes. A ‘leave-one-out’ summary was performed to balance the number of studies and shared genes. After excluding GSE9285 dataset for optimal shared genes, Combat method using sva12 and quantile normalization using preprocessCore13 were performed to remove batch effect and baseline differences across the samples. The complete gene level compendium matrix contained 13616 genes x 380 samples from 239 SSc samples and 141 controls.
The SSc compendium matrix
The SSc bulk compendium (Supplementary Table 1), which contains 224 dSSc, 15 lSSc, and 141 healthy control samples from 12 publicly available sources, was ranked in terms of gene expression level for dSSc and lSSc versus control respectively using LIMMA14 (Fig. 1b). For each pairwise contrast, LIMMA generated a table of logFC values and adjusted p-values for all genes in the compendium matrix. Positive/negative logFC values correlate to up/down regulation relative to control in both the dSSc-control and lSSc-control contrast.
From LIMMA, we obtained a total of 300 upregulated and significant DEGs (< 0.05 adjusted p value and > 0.5 logFC) in dSSc and 144 upregulated and significant DEGs (< 0.05 adjusted p value and > 0.5 logFC) in lSSc. 115 DEGs were shared between dSSc and lSSc. Further gene ontology pathway analysis, utilizing DEGs, for both dSSc (300 DEGs) and lSSc (144 DEGs) shows that genes differentially expressed in each SSc disease phenotype yielded many similar biologically relevant pathways such as ‘ECM organization’, ‘Negative regulation of immune processes’, ‘inflammation and wound healing’, ‘cell matrix/cell-cell adhesion’, and others (Supplementary Fig. 1a and 1b). Many of these genes are verified in the dSSc and lSSc phenotypes and are associated with disease severity, as well as MRSS scores and SSc relevant biomarkers.
LIMMA to GSEA
In order to assess the distribution of genes in both dSSc-control and lSSc-control, GSEA analysis15 was subsequently performed, in which all genes from each contrast were ranked by their logFC values, from the most positive to the most negative. This ranked list of genes along with each pre-defined iSCAR gene set were used to obtain the enrichment score (ES), the statistical significance of ES, and lead genes associated with the enrichment of each iSCAR gene set in either dSSc vs control or lSSc vs control contrast.
GSEA to pathway analysis
For each iSCAR experiment (iSCAR-Ctrl, iSCAR-P, and iSCAR-T), there were 4 pre-defined gene sets (2 antifibrotic vs DMSO control treatment groups x UP or DOWN), each mapped to either dSSc vs control or lSSc vs control. Only iSCAR gene sets that contained genes downregulated with antifibrotic treatment compared to control (‘DOWN’) and had a positive normalized enrichment score with a < 0.05 adj. p-value in the GSEA analysis were kept for subsequent analysis. Pathway enrichment analysis was performed on genes from selected iSCAR gene sets. For pathway analysis, org.Hs.eg.db was used with gene sets from all three different domains in gene ontology (GO) including: biological processes (BP), molecular functions (MF), and cellular components (CC). Comparative pathway analysis was performed using the ‘enrichGO’ and ‘compareCluster’ functions of clusterProfiler16 with a <0.05 p-value using the Benjamini-Hochberg method for adjusted P value. Gene sets were also pasted into Metascape17 for enrichment analysis.
Single cell atlas and module score
Single cell data from 3 studies (GSE195452, GSE209635, and GSE138669) were used to create a comprehensive single cell atlas presenting healthy or SSc skin tissues (Supplementary Table 2). Together, they comprise 120 SSc samples and 64 healthy control samples. Each study was normalized in scanpy.pp.normalize_total with a 1e4 target_sum setting and sc.pp.log1p with all default parameters. After initial normalization, “low quality cells” which include cells with low or high gene count and cells with high percent mitochondria were subsequently removed. We then used scVI18 to merge and batch correct technical differences across different studies and samples, while keeping biological variations intact. scVI integrated single cell atlas was then subject to Leiden clustering19, which identified communities of cells that tend to cluster together. We identified relevant cell types (epithelial cells, endothelial cells, fibroblast cells, and myeloid cells) in the integrated atlas based on the gene rank of each cluster and preliminary knowledge of marker genes of different cell types. We subsequently split the atlas into SSc and control atlas. We then, using the expression values of the genes included in each iSCAR gene signature taken from the respective iSCAR experiment, scored each cell in the SSc or control atlas using the ‘AddModuleScore’ Seurat function20 in order to identify cell populations that highly express the genes in each iSCAR gene set.
LPA measurement
Supernatants from iSCAR-T Autotaxin inhibitor treated cells were collected and LPA-species were quantitated via liquid chromatography based mass spectrometry according to a published protocol21.
Multiplex analysis of cytokines
The Milliplex human cytokine/chemokine Panel IV, was used per manufacturer’s instructions. iMCs seeded either on plastic or hydrogels were serum starved for 24 hours, and the supernatant collected for the assay.