3.1 Molecular Characterization of FtFLSs form TB.
The DNA and cDNA sequences of the five FtFLSs (FtFLS1 to FtFLS5) were successfully obtained through PCR. Alignment of these five FtFLSs with the TB genome and transcriptome data revealed their consistency with the sequences stored in the database. The outcomes indicated that FtFLS1 and FtFLS2 were positioned on chromosome 7 of TB and represented tandem repeat sequences. FtFLS3 was found on chromosome 2, FtFLS4 on chromosome 3, and FtFLS5 on chromosome 1. The coding DNA sequences (CDS) of the five FtFLSs demonstrated a similarity of 75.7%, while their deduced protein sequences exhibited a similarity of 43.5%. Supplementary Table 2 and Supplementary Fig. 2 were provided to offer supplementary details regarding the five FtFLSs.
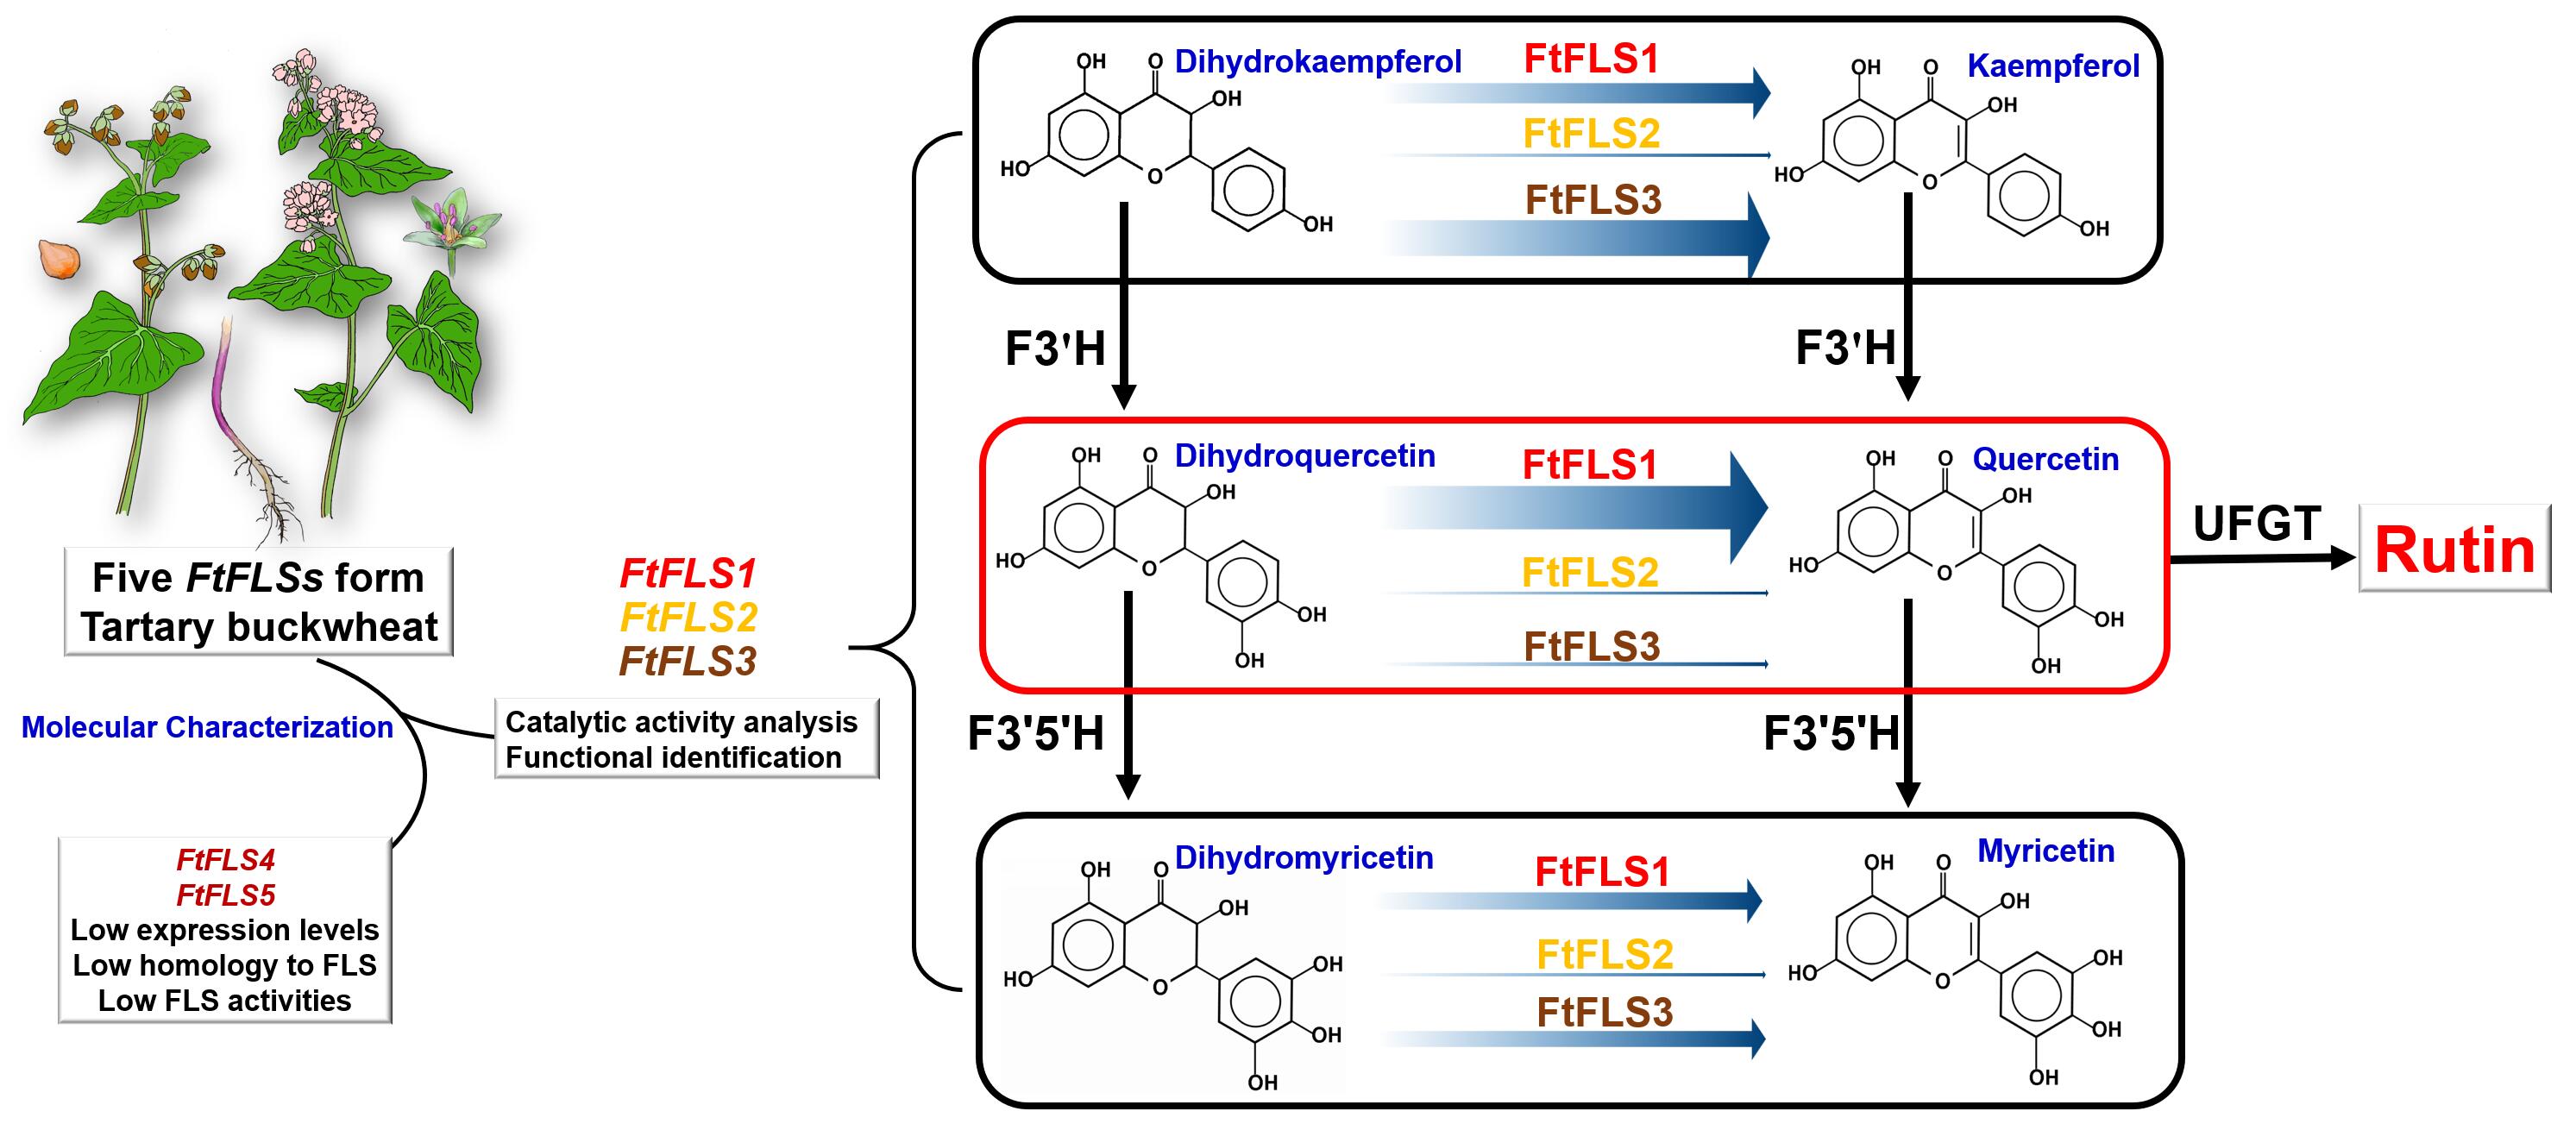
In order to dissect the molecular attributes and potential roles of the predicted FtFLS proteins, we selected protein sequences from three 2-ODD enzymes (F3H, FLS, and ANS) associated with rutin synthesis in F. tartaricum, A. thaliana, and N. tabacum. The phylogenetic analysis illuminated the evolutionary tree, which divided into two distinct branches termed Cluster I and Cluster II (Fig. 2A). Within Cluster I, a close phylogenetic relationship was evident between FtFLS1, FtFLS3, 6 AtFLSs from Arabidopsis, and 4 NtFLSs from tobacco, as they were collectively placed into Group A. On the other hand, FtFLS2 was assigned to Group B, joined by AtANS from F. tartaricum and 4 NtANSs from tobacco. As for Cluster II, FtFLS4 occupied an independent position in Group C, while FtFLS5 exhibited marked similarity to AtANS. Additionally, all F3Hs from the three species were found to cluster together in Group E. These results collectively indicate that among the five FtFLS proteins, FtFLS1, FtFLS2, and FtFLS3 are likely to share comparable biological functions, whereas FtFLS4 and FtFLS5 might serve as multifunctional enzymes within the rutin synthesis metabolic pathway of TB[8].
The multiple sequence alignment revealed that all 31 selected 2-ODD sequences encompass the conserved functional regions recognized as Conserved domain A and Conserved domain[12]. It is noteworthy that the major divergences were localized within the variable region comprised of the initial 70 amino acids at the N-terminus (Fig. 2B). Further insights into the impact of the N-terminal variable region of FtFLSs on the configuration of the enzyme-substrate pocket structure were obtained through additional 3D modeling results (Fig. 2C and 2D). Of significant importance, FtFLS4 and FtFLS5 exhibited a stronger similarity to the advanced structure of ANS (pdb No. A0A5J5AX16) as opposed to FLS (pdb No. F5BR59.1). By leveraging our previously documented transcriptome data of flowering TB, we generated an updated expression heatmap for FtFLS1-5. The outcomes underscored the presence of tissue specificity and variations in the expression levels of FtFLS1-5. Importantly, FtFLS1 displayed the highest average expression level, followed by FtFLS2, while FtFLS3 exhibited the lowest expression level (Supplementary Fig. 3). Consequently, FtFLS1-3 were selected as prospective candidate genes for subsequent investigations.
3.2 Analysis of the expression of FtFLSs and flavonoid contents in TB.
To validate the expression levels of FtFLS1-3 as indicated by transcriptome data and explore their potential correlation with flavonoid contents, qRT-PCR was employed to quantify gene expression, while flavonoid contents were measured in various tissues of TB during the flowering stage.
The qRT-PCR analysis revealed that FtFLS1 displayed elevated expression levels in the stems, leaves, and flowers of flowering buckwheat, with a moderate level of expression in the roots. In contrast, both FtFLS2 and FtFLS3 shared a comparable expression pattern, marked by low expression in the roots and flowers, and negligible expression in other tissues (Fig. 3A). The provided data strongly reinforces the observed expression patterns of FtFLS1-3 in our previous transcriptome analysis of buckwheat[15]. HPLC analysis unveiled rutin as the predominant flavonol component in TB (dry weight, DW), present in relatively substantial quantities across various tissues (114.96 mg/g in flowers, 107.53 mg/g in leaves, 8.32 mg/g in stems, and 1.62 mg/g in roots, DW). Quercetin, being the principal precursor of rutin, exhibited the highest content in buckwheat flowers (9.25 mg/g, DW), while kaempferol and myricetin were detected at low levels in all tissues (less than 1.5 mg/g, DW) (Fig. 3B). The correlation between the expression levels of FtFLS1-3 and the content of four different flavonols was analyzed using Pearson's correlation coefficient method with an ID of 0.75, indicating strong positive correlation. The results demonstrated that the expression of FtFLS1 displayed a robust positive correlation with quercetin content (0.80) and rutin content (0.75), a pronounced negative correlation with kaempferol content (-0.79), while no significant correlation was observed with myricetin. Additionally, a correlation coefficient of 0.68 existed between the expression of FtFLS2 and kaempferol content, which did not meet the established threshold. Notably, no significant correlation was identified between the expression of FtFLS3 and the content of the four flavonols. (Table 1).
Table 1
Correlation analysis of the expression levels of FtFLS1-3 and the content of 4 different flavonols in flowering Taratary buckwheat
| Names | Kaempferol | Quercetin | Myricetin | Rutin |
| FtFLS1 | -0.79* | 0.80* | 0.20 | 0.75* |
| FtFLS2 | 0.68 | -0.51 | -0.03 | -0.45 |
| FtFLS3 | 0.50 | -0.38 | -0.14 | -0.38 |
| (*) denotes that the absolute value of A exceeds 0.5. |
Based on the preceding findings, it is plausible to infer that FtFLS1 is likely a predominant player in the quercetin biosynthesis across diverse tissues of flowering buckwheat. This role could involve enhancing rutin accumulation via quercetin synthesis. Conversely, FtFLS2 and FtFLS3 might participate in distinct flavonol synthesis pathways, possibly contributing to the synthesis of various flavonol types through alternative routes.
3.3 Cloning and identification of the promoters of FtFLS1-3.
In order to gain a better understanding of the expression patterns for FtFLS1-3, we cloned the promoter sequences located approximately 2000 bp upstream of their respective start codons (ATG). These sequences have been designated as PFtFLS1 (2479 bp), PFtFLS2 (2574 bp) and PFtFLS3(2046 bp). These sequences have a high AT content (over 60%), which is consistent with the characteristics of plant promoters. The web tools PlantCARE and GSDS were utilized to analyze the DNA sequences of PFtFLS1−3, and the resulting details are presented in Supplementary Table 3. Our results showed that PFtFLS1−3 encompassed a wide range of cis-acting elements, exhibiting varying quantities. Additionally, among the core promoter elements (TATA-box and conserved CAAT-box), prominent elements comprised light-responsive components like G-box, Box-I, and Box-4. These outcomes propose the potential responsiveness of PFtFLS1−3 to various environmental stimuli. Consequently, we proceeded with the functional analysis of PFtFLS1−3, employing transgenic tobacco and Arabidopsis methodologies.
In the experiment involving agrobacterium-mediated transformation of tobacco leaves, all PFtFLS1−3 successfully initiated the expression of the downstream reporter gene GUS, resulting in confined blue coloration within the tobacco leaves. However, their transcriptional activities exhibited relatively lower strength in comparison to the positive control 35S promoter (Fig. 4A). To further differentiate the functions of the three PFtFLS1−3, we generated T3 Arabidopsis lines expressing PFtFLS1, PFtFLS2, and PFtFLS3 individually and identified positive transgenic lines. During the seedling stage of transgenic Arabidopsis, histochemical staining indicated predominant expression of PFtFLS2 in the roots, while no detectable GUS activity accumulation was observed for PFtFLS1 and PFtFLS3 (Fig. 4B). Subsequent qRT-PCR analysis revealed varying expression levels of all three genes in Arabidopsis, with PFtFLS2 displaying the highest expression level, followed by PFtFLS1 and PFtFLS3 (Fig. 4C).
We further explored the expression-driving potential of the PFtFLS1−3 promoters in transgenic Arabidopsis lines during the flowering stage. Histochemical staining demonstrated that all three promoters could activate GUS expression in different organs of Arabidopsis, encompassing roots, stems, leaves, and flowers, resulting in noticeable coloration (Fig. 5A). However, the qRT-PCR results unveiled diversity in the expression levels of the three promoters across various tissues of Arabidopsis. PFtFLS2 demonstrated a pattern akin to flowering TB, while PFtFLS1 and PFtFLS3 exhibited unique expression patterns (Fig. 5B). Furthermore, to investigate the response of PFtFLS1−3 to environmental stress, including cold, UV-B, and drought, flowering Arabidopsis plants were exposed to these stressors. The qRT-PCR results indicated that all three environmental factors led to an elevation in the expression of PFtFLS1 and PFtFLS3, displaying significant differences from the wild type (p < 0.01) (Fig. 5C and 5E). PFtFLS2 demonstrated insensitivity to cold and UV treatments (p > 0.05), exhibiting upregulation solely under drought conditions, which was highly significant compared to the wild type (p < 0.01) (Fig. 5D).
The aforementioned results elucidated the differences among the PFtFLS1−3 in terms of cis-acting element composition, spatial and temporal expression specificity, and responsiveness to environmental factors. These findings provide crucial insights to advance our understanding of the regulatory mechanisms that control the expression of the three FtFLS genes.
3.4 Expression of FtFLS1-3 in Arabidopsis.
After hygromycin screening and PCR identification, we successfully generated T3 generation transgenic Arabidopsis lines overexpressing FtFLS1-3, respectively (Fig. 6A). The qRT-PCR analysis revealed varying expression levels of the FtFLS1-3 in Arabidopsis lines under the control of the 35S promoter, with relative expression levels ranked as FtFLS2 > FtFLS3 > FtFLS1 (Fig. 6B). Total flavonoid content analyses exhibited a significant increase in all transgenic Arabidopsis lines compared to the wild-type control (p < 0.01) (Fig. 6C). Moreover, subsequent analysis of rutin content yielded similar results (Fig. 6D). Furthermore, we conducted an assessment of the levels of kaempferol, quercetin, and myricetin in the samples. The findings indicated that these three compounds were present in extremely low concentrations in Arabidopsis lines, each accounting for less than 1% of the total flavonoid and rutin contents. This phenomenon could be attributed to the efficient conversion of flavanols into the end product rutin in Arabidopsis[32]. Overall, these results conclusively demonstrate the functional role of FtFLS1-3 as flavonol synthases within the plant system.
3.5 Functional expression of FLS1-3 in E. coli.
After 6 hours of IPTG induction, SDS-PAGE analysis revealed successful expression of recombinant FtFLS1, FtFLS2, and FtFLS3 as the primary protein products within the E. coli cultures (Fig. 7A). These proteins exhibited molecular weights of approximately 40 kDa, consistent with the values in Supplementary Table 2. TLC analysis demonstrated the effective separation of DQ, Q, and a DQ-Q mixture standard substances, with corresponding Rf values of 0.33, 0.45, and 0.33–0.45. The TLC analysis results showed effective separation of DQ, Q, and DQ-Q mixture standard substances, with their respective Rf values being 0.33, 0.45, and 033-0.45. In the activity assay using crude enzyme solutions, partially reacted substrate DQ and newly produced product quercetin were observed. The Rf values of these spots matched those of the DQ and quercetin standards (Fig. 7B). These results indicate that all three recombinant proteins, FtFLS1-3, exhibited the capability to catalyze the substrate DQ into Q, demonstrating fundamental FLS activity.
3.6 Catalytic characteristics of recombinant FtFLS1-3 in vitro.
After a 10-hour induction period, soluble expression of FtFLS1-3 was observed through SDS-PAGE analysis (Fig. 8A, lanes 1 and 2). Subsequent elution was achieved effectively using a 200 mM imidazole buffer (Fig. 8A, lane 7). Following ultrafiltration purification (Fig. 8A, lane 8), the concentrations of recombinant proteins FtFLS1-3 were determined to be 1.35 g/L, 1.29 g/L, and 1.45 g/L (500 µL), respectively.
Enzyme-catalyzed reactions were carried out using DK, DQ, and DM as substrates. For FtFLS1, the observed total activities were 8.88 × 10− 3 IU, 22.33 × 10− 3 IU, and 4.70 × 10− 3 IU for each substrate, with specific activities of 6.58 × 10− 3 IU/mg, 16.54 × 10− 3 IU/mg, and 3.48 × 10− 3 IU/mg, respectively. This outcome closely aligns with our earlier research on FtFLS1[19]. Regarding FtFLS2, the recorded total activities were 5.01 × 10− 3 IU, 5.17 × 10− 3 IU, and 3.26 × 10− 3 IU for each substrate, along with specific activities of 3.88 × 10− 3 IU/mg, 4.01 × 10− 3 IU/mg, and 2.53 × 10− 3 IU/mg, respectively. Concerning FtFLS3, the measured total activities were 10.48 × 10− 3 IU, 10.32 × 10− 3 IU, and 7.42 × 10− 3 IU for each substrate, accompanied by specific activities of 7.23 × 10− 3 IU/mg, 17.12 × 10− 3 IU/mg, and 5.12 × 10− 3 IU/mg, respectively.
Continuous measurements were taken for a duration of 20 minutes to quantify the production of quercetin resulting from the catalytic activity of FtFLS1-3 enzymes on DQ (Fig. 8B). The results indicated that as the enzyme-catalyzed reaction proceeds, the product content continually increased. Approximately within the time span of 8 to 18 minutes from the start of the reaction, there was a linear relationship between the product and time. At this point, the slope of the line represented the initial velocity of the enzyme-catalyzed reaction[33]. Therefore, the initial velocities of the enzyme-catalyzed reactions of recombinant FtFLS1, FtFLS2, and FtFLS3 with DQ as substrates were 22.30 ×10− 3 µM/min, 5.16×10− 3 µM/min and 10.32×10− 3 µM/min, respectively. Accordingly, we chose a time point of 15 minutes following the initiation of the enzyme-catalyzed reaction to determine the Km and Vmax values of FtFLS1, FtFLS2, and FtFLS3, utilizing three dihydroflavonols as substrates. The calculated results were presented in Table 2, and the double reciprocal plots (Lineweaver-Burk plots) were available in Supplementary Fig. 4. The data revealed that FtFLS1-3 exhibit diverse catalytic abilities and substrate preferences for the three dihydroflavonols. FtFLS1 exhibited a preference for DQ as a substrate, characterized by a low Km value (594.17 µmol/L) and the highest Vmax value (42.55 µmol/L·min). However, FtFLS2 displayed the lowest catalytic capacity and affinity for all three substrates on average, despite its preference for DQ (Km= 8411.27 µmol/L). In contrast, FtFLS3 showed a preference for DK as a substrate (Km= 717.93 µmol/L), which is the highest among the three FtFLS enzymes. Notably, all the FtFLS1-3 enzymes showed lower Vmax and higher Km values for DM. Taken together, these results demonstrate that FtFLS1 exhibited a stronger specific activity, a higher Vmax, and a better affinity for DQ in terms of enzyme catalytic characteristics compared to FtFLS2 and FtFLS3.
Table 2
Km and Vmax values of FtFLS1-3 for different substrates
| Name | Dihydrokaempferol | Dihydroquercetin | Dihydromyricetin |
| FtFLS1 | Vmax= 25.53 µmol/L·min Km= 1257.18 µmol/L | Vmax= 42.55 µmol/L·min Km = 594.17 µmol/L | Vmax= 17.76 µmol/L·min Km = 1516.34 µmol/L |
| FtFLS2 | Vmax= 13.59 µmol/L·min Km= 23646.74 µmol/L | Vmax= 10.25 µmol/L·min Km = 8411.27 µmol/L | Vmax= 12.15 µmol/L·min Km = 21583.23 µmol/L |
| FtFLS3 | Vmax= 24.04µmol/L·min Km= 717.93 µmol/L | Vmax= 13.97 µmol/L·min Km = 6478.21 µmol/L | Vmax= 17.82 µmol/L·min Km = 1609.21 µmol/L |