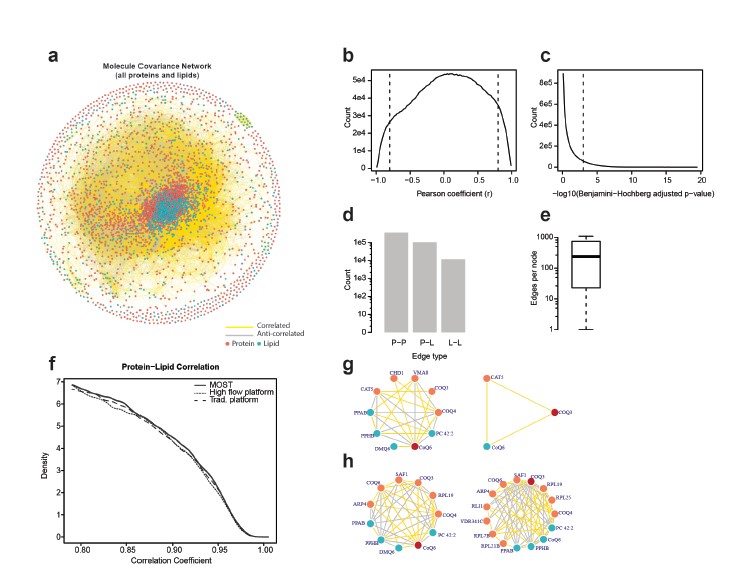
Features of MOST multi-omic molecule covariance networks. (a) Network of all covariant molecules observed in MOST dataset (|r| ≥ 0.8, Benjamini-Hochberg adjusted p-value < 0.001; two-sided Student’s t-test). (b) Distribution of calculated Pearson coefficients for all pairwise molecule covariance comparisons (r cutoff at ±0.8 used throughout the study is indicated). (c) Distribution of Benjamini-Hochberg p-values from all pairwise molecule comparisons (p-value cutoff at 0.001 used throughout the study is indicated). (d) Bar chart indicating number of protein–protein (P–P), protein–lipid (P–L), and lipid–lipid (L–L) edges. (e) Box plots indicating the number of edges per node. (f) Density plot showing the density of protein-lipid correlation coefficient. The same samples were analyzed by different platforms for comparison of methods. (g) Nearest neighbor molecule covariance network for CoQ6 (Ubiquinone) and Coq3 gene, generated by high flow platform. (h) Nearest neighbor molecule covariance network for CoQ6 (Ubiquinone) and Coq3 gene, generated by MOST.