Transgenic mice
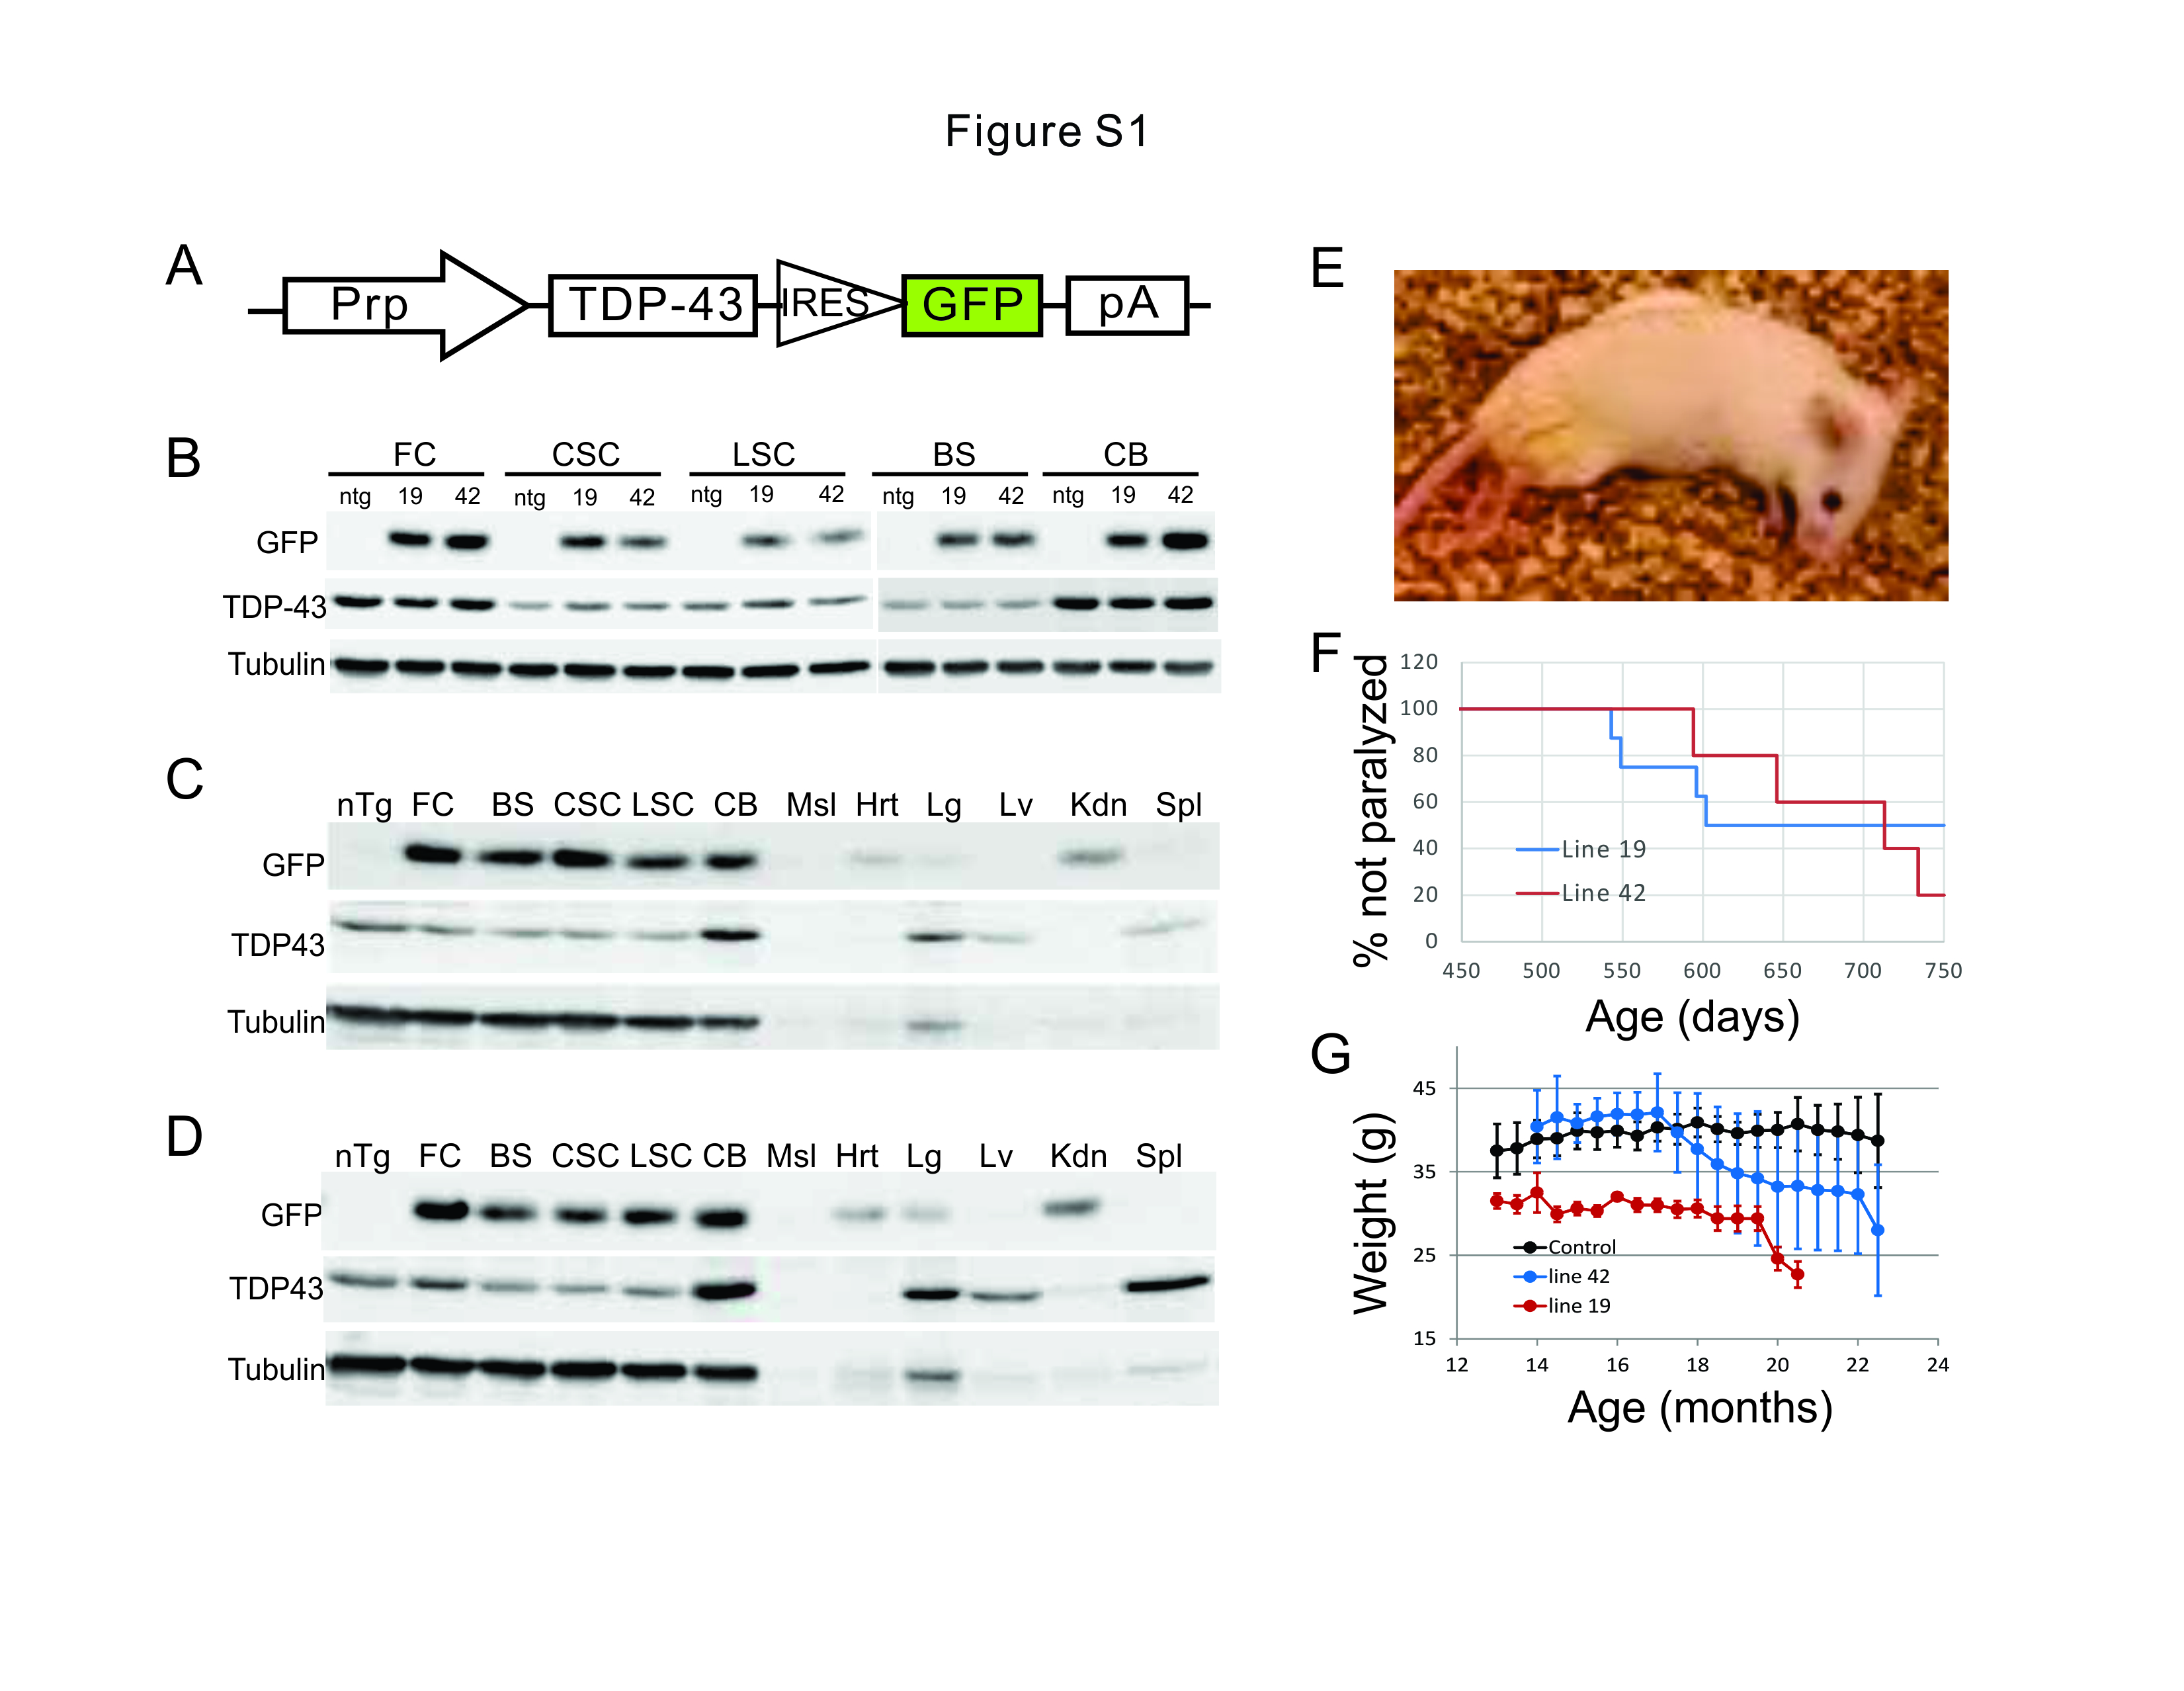
A cDNA encoding mouse wild-type TDP-43 and EGFP linked by the internal ribosome entry site (IRES) was generated by standard PCR using the full-length mouse TDP-43 cDNA and EGFP as templates. The resulting cDNA (mTDP43-IRES-GFP) was cloned into the XhoI site of the MoPrp.Xho plasmid (ATCC#JHU-2) [43]. After the sequence verification and tests in cultured cells, the prp-mTDP43-IRES-EGFP construct was linearized by Not1 and injected into the pronuclei derived from FVB/NJ mice. The founder mice were screened by PCR using the primers complementary to the GFP and vector DNA sequence: forward TGCTGCTGCCCGACAACCA and reverse ATAACCCCTCCCCCAGCCTAGA. The positive founders were bred with wild type FVB/NJ mice, and the offspring were sacrificed and characterized for their expression of GFP in the CNS. Their brain and spinal cord were examined under a fluorescence microscope. The lines were terminated if 3 to 5 animals from the line showed no detectable GFP fluorescence. The lines surviving this screen were further analyzed for their GFP expression levels by immunoblot. Two lines, 19 and 42, were selected for a further screen for motor phenotypes. Both lines developed incompletely penetrant, late-onset motor dysfunction and paralysis. Line 19 was successfully converted to a homozygous line and further analyzed in detail. This line has been deposited at The Jackson Laboratory and will be available as Stock No. 031609.
Behavioral analysis
Mice were housed in the University of Massachusetts Medical School animal facility managed by the Department of Animal Medicine. This facility is a specific pathogen-free (SPF) facility. Each cage housed 1-5 animals ad libitum. The rooms were maintained at 20-22°C and with a 12-12 light-dark cycle. All the behavioral experiments were approved by IACUC and conducted according to University of Massachusetts Medical School policies and procedures regulating the use of animals in research and the provisions of the PHS/NIH Guide for the Care and Use of Laboratory Animals.
Home cage observation. Mice were observed daily on weekdays for their general health and motor behavior, and their body weights monitored biweekly. The disease stages were assigned as follows: pre-symptomatic (pre-sym), slightly weak (swk), weak (wk), and paralysis (par). At the pre-sym stage (usually <10 months), the motor behavior was indistinguishable from the nTg mice. At the swk stage (at ~10 months), the mice showed slight foot-dragging in their gait. At the wk stage (~11-14 months), the foot-dragging became readily observable, and the movement became noticeably slowed. At the paralysis stage, two or more limbs became paralyzed, and the mouse was incapable of locomotion. The paralysis stage was the endpoint of the experiment, and the mouse was sacrificed for tissue harvesting.
HomeCageScan. To monitor the mouse behavior in their home cage continuously, we used the HomeCageScan system as previously described [44, 45]. Briefly, mice were housed individually in polycarbonate cages with minimal bedding (about 200 ml). A digital video camera was mounted on one side of the wall. Each mouse was recorded for 24h per week, with 12h daylight and 12h dim red light, and then returned to its cage with its littermates. Video data were analyzed by HomeCageScan software (Clever Systems, Reston, VA, USA) to quantify travel. Travel measures the overall motor/muscle functions by recording the distance traveled in meters.
Accelerating rotarod. Transgenic animals and age-matched controls were tested for time on accelerating rotarod from 12 to 72 RPM over three trials with a maximum time of 300s per trial at different age points. The longest time of three trials on the rotarod was recorded in seconds once the mice fell from the bar.
Grip strength. Transgenic animals and age-matched controls were tested for loss of four-limb grip strength using a grip strength meter at different time points. Mice were allowed to grip on a horizontal metal wire grid with four limbs. They were gently pulled back by their tails with steady force until they release their grip from the grid. Peak tension was recorded from five consecutive trials.
Immunoblotting
Mice under deep anesthesia were decapitated. The spinal cord, brain, and other tissues were quickly harvested, snap-frozen in liquid nitrogen, and stored at -80°C. For protein preparation, frozen tissues were homogenized in a homogenization solution containing 25 mM phosphate pH 7.2, 1 mM EGTA, 1% SDS, 0.5% Triton X-100 and protease inhibitor mixture (Thermo Scientific) and heated at 95°C for 5 min. After clearing by centrifugation, protein concentration was measured using BCA assay (Pierce, Rockford, IL). The samples were heated in Laemmli buffer, and equal amounts of protein were loaded and resolved by SDS-PAGE. After transfer to nitrocellulose membranes, blots were blocked with 5% nonfat dry milk in PBST (0.25% Triton X-100 in PBS, pH 7.4) for 1 h, and then incubated with primary antibodies overnight at 4°C and then again with horseradish peroxidase–linked secondary antibodies (GE Healthcare) in PBST with 5% dry milk for 1 hour at RT. The dilutions and source of primary antibodies were as follows: GFP (Invitrogen G10362, 1:1000), rabbit polyclonal antibody raised to amino acids 394-414 of human TDP-43 (c-TDP43, custom made, 1:5000), α-Tubulin (Sigma,T5168, 1:10000), CNPase (Cell Signaling, #5664s,1:1000), MBP(Abcam,ab62631,1:1000), MCT1(Abcam, ab90582, 1:1000), NFkB-p65 (Cell signaling, #8242, 1:1000), and phosphorylated NFkB-p65 (Cell signaling, #3033, 1:1000). Membranes were washed three times, and proteins were visualized after ECL (Pierce) treatment and detected by the LAS-3000 imaging system (Fujifilm).
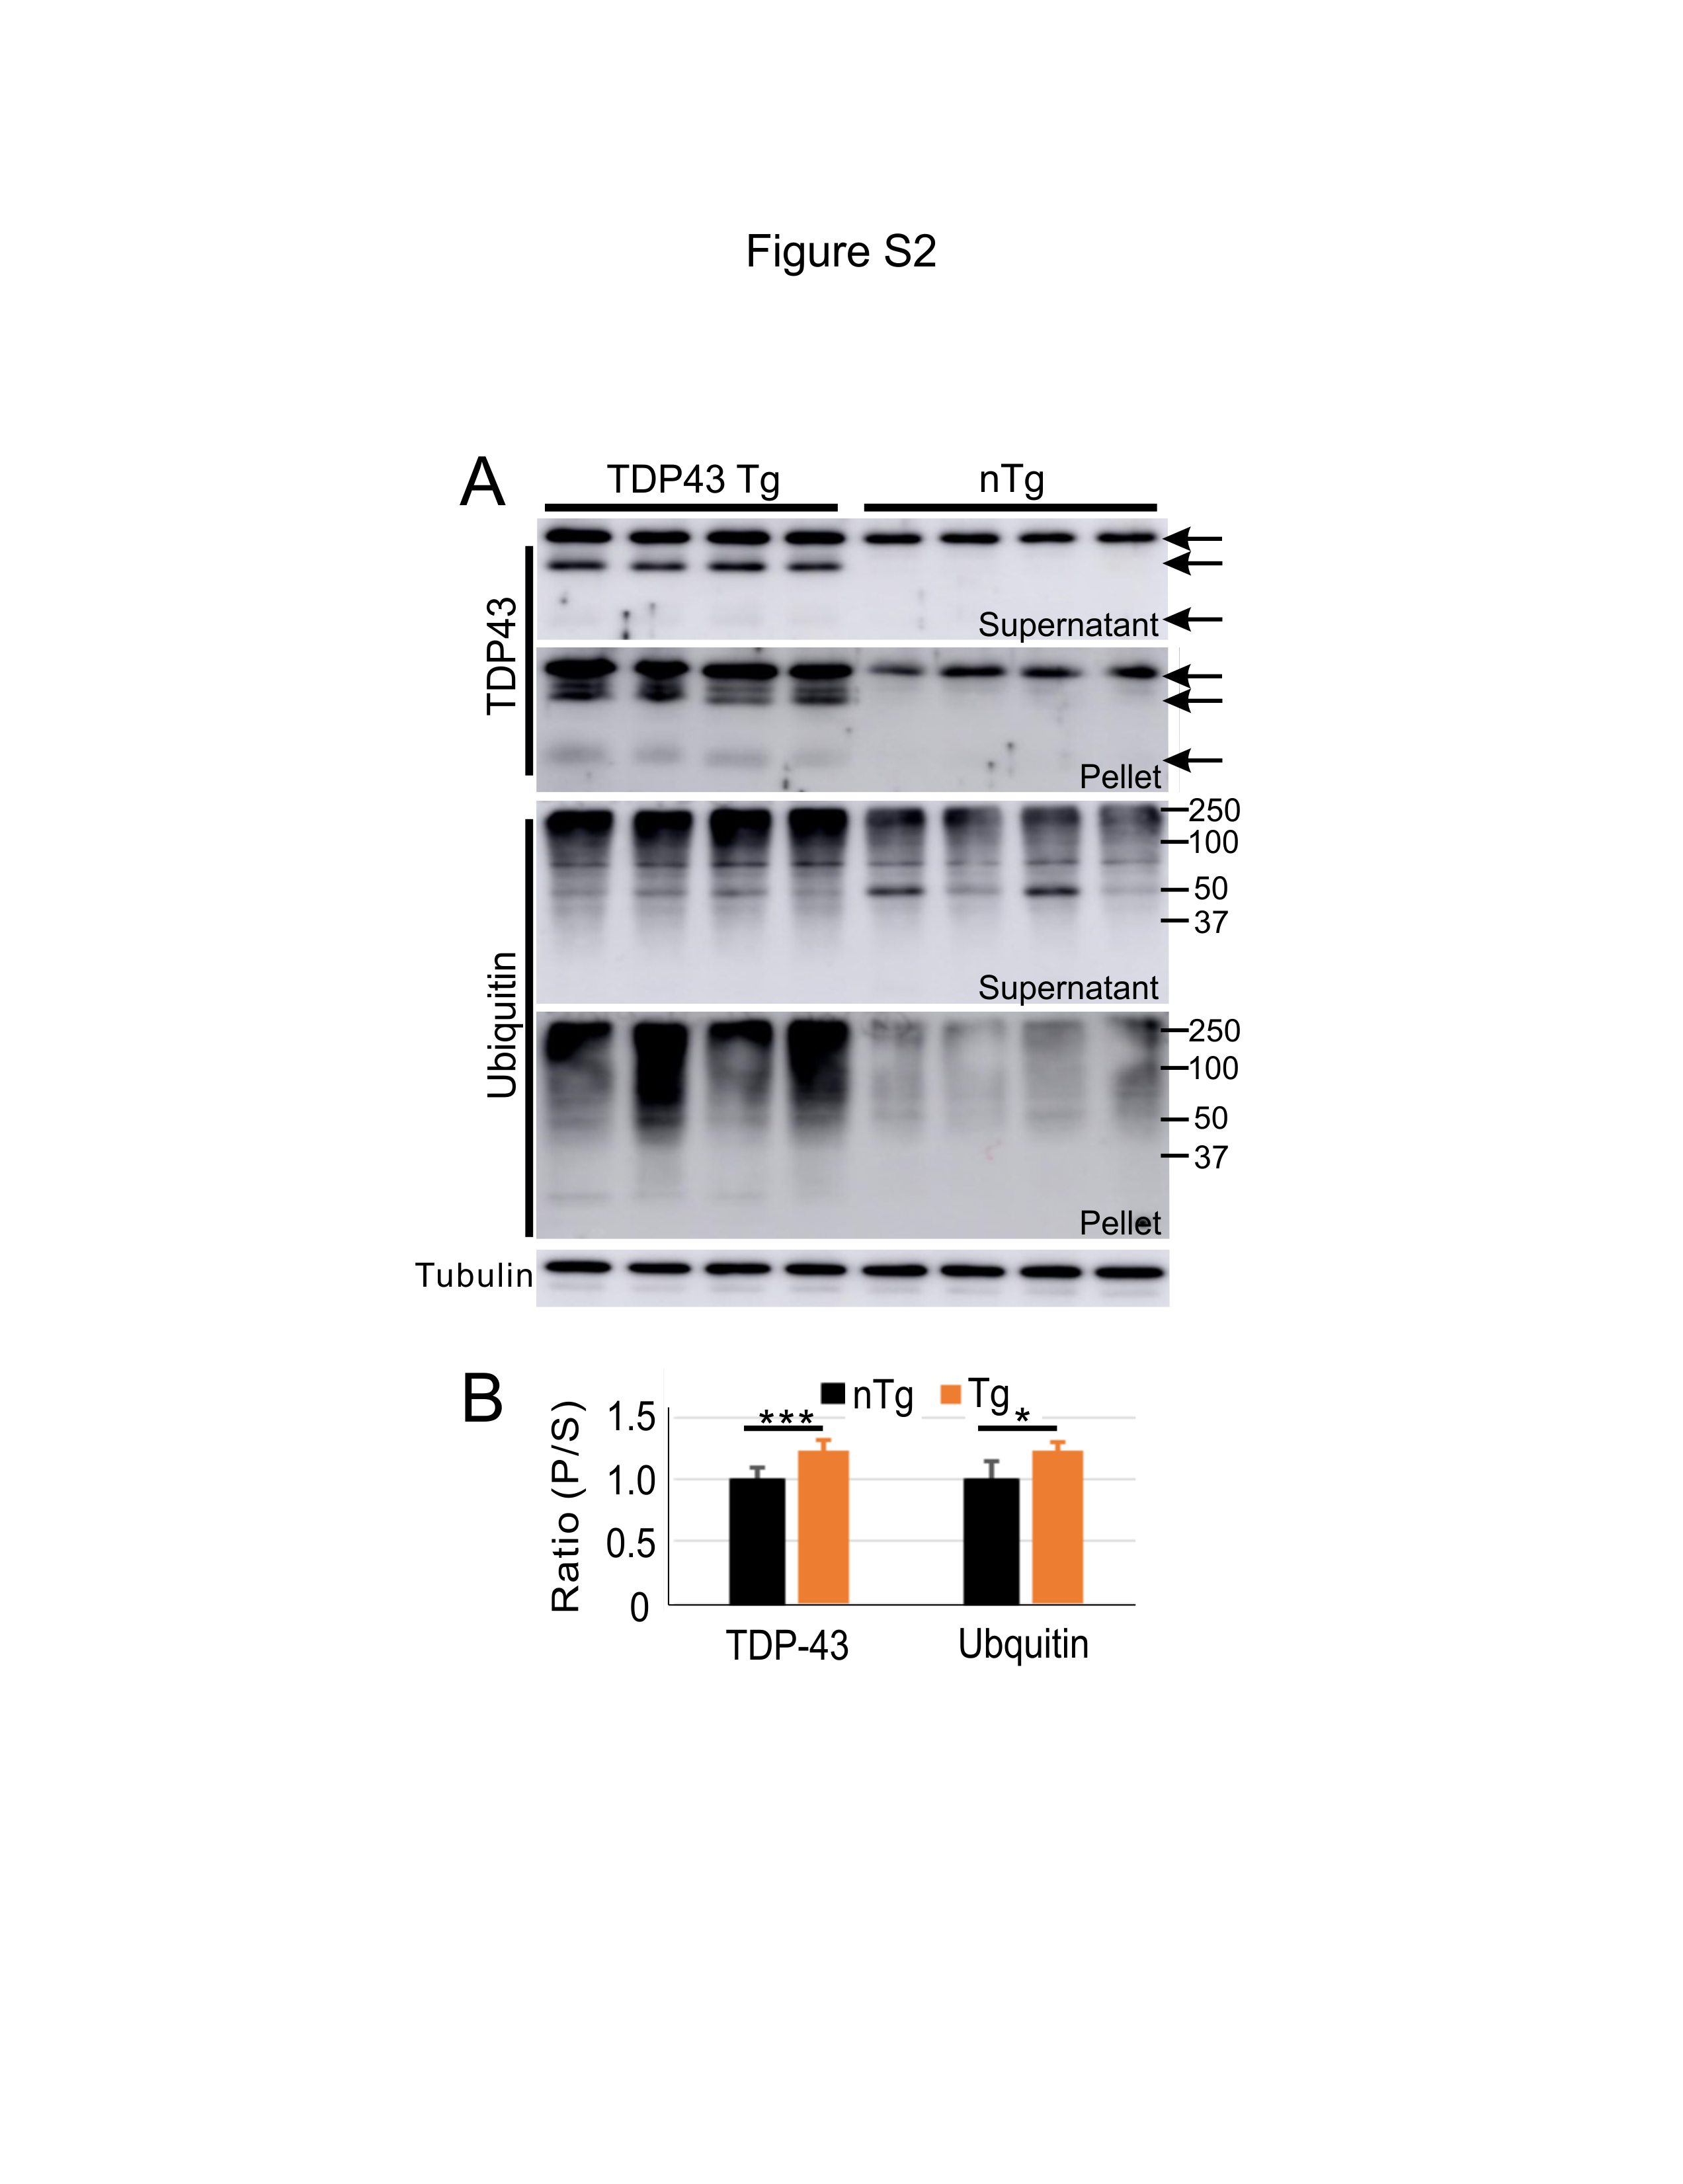
Sedimentation assay
Mouse lumbar spinal cords were homogenized using a handheld polytron for 20 sec in lysis buffer (50 mM Tris-HCl, 150 mM NaCl, 0.5% deoxycholic acid, 1% Triton X-100, 20 mM NaF, 1 mM Na3VO4, 5 mM EDTA) with protease inhibitor (1:100 dilution, P8340, Sigma, St Louis, MO, USA) and phosphatase inhibitor cocktails (Thermo Fisher). The homogenates (100 µL/sample) were centrifuged at 12,000g at 4˚C for 5 min. The supernatants were moved to new tubes and measured for protein concentration as described above. The pellets were rinsed 3 times with the lysis buffer and resuspended in 20 µL 1X Laemmli buffer. Ten micrograms of protein from the supernatant were mixed with 2X Laemmli buffer. The supernatant sample and an equivalent volume of pellet sample were heated at 95°C for 5 min, cleared by centrifugation, and then resolved by SDS-PAGE. The gel was then immunoblotted, as described above.
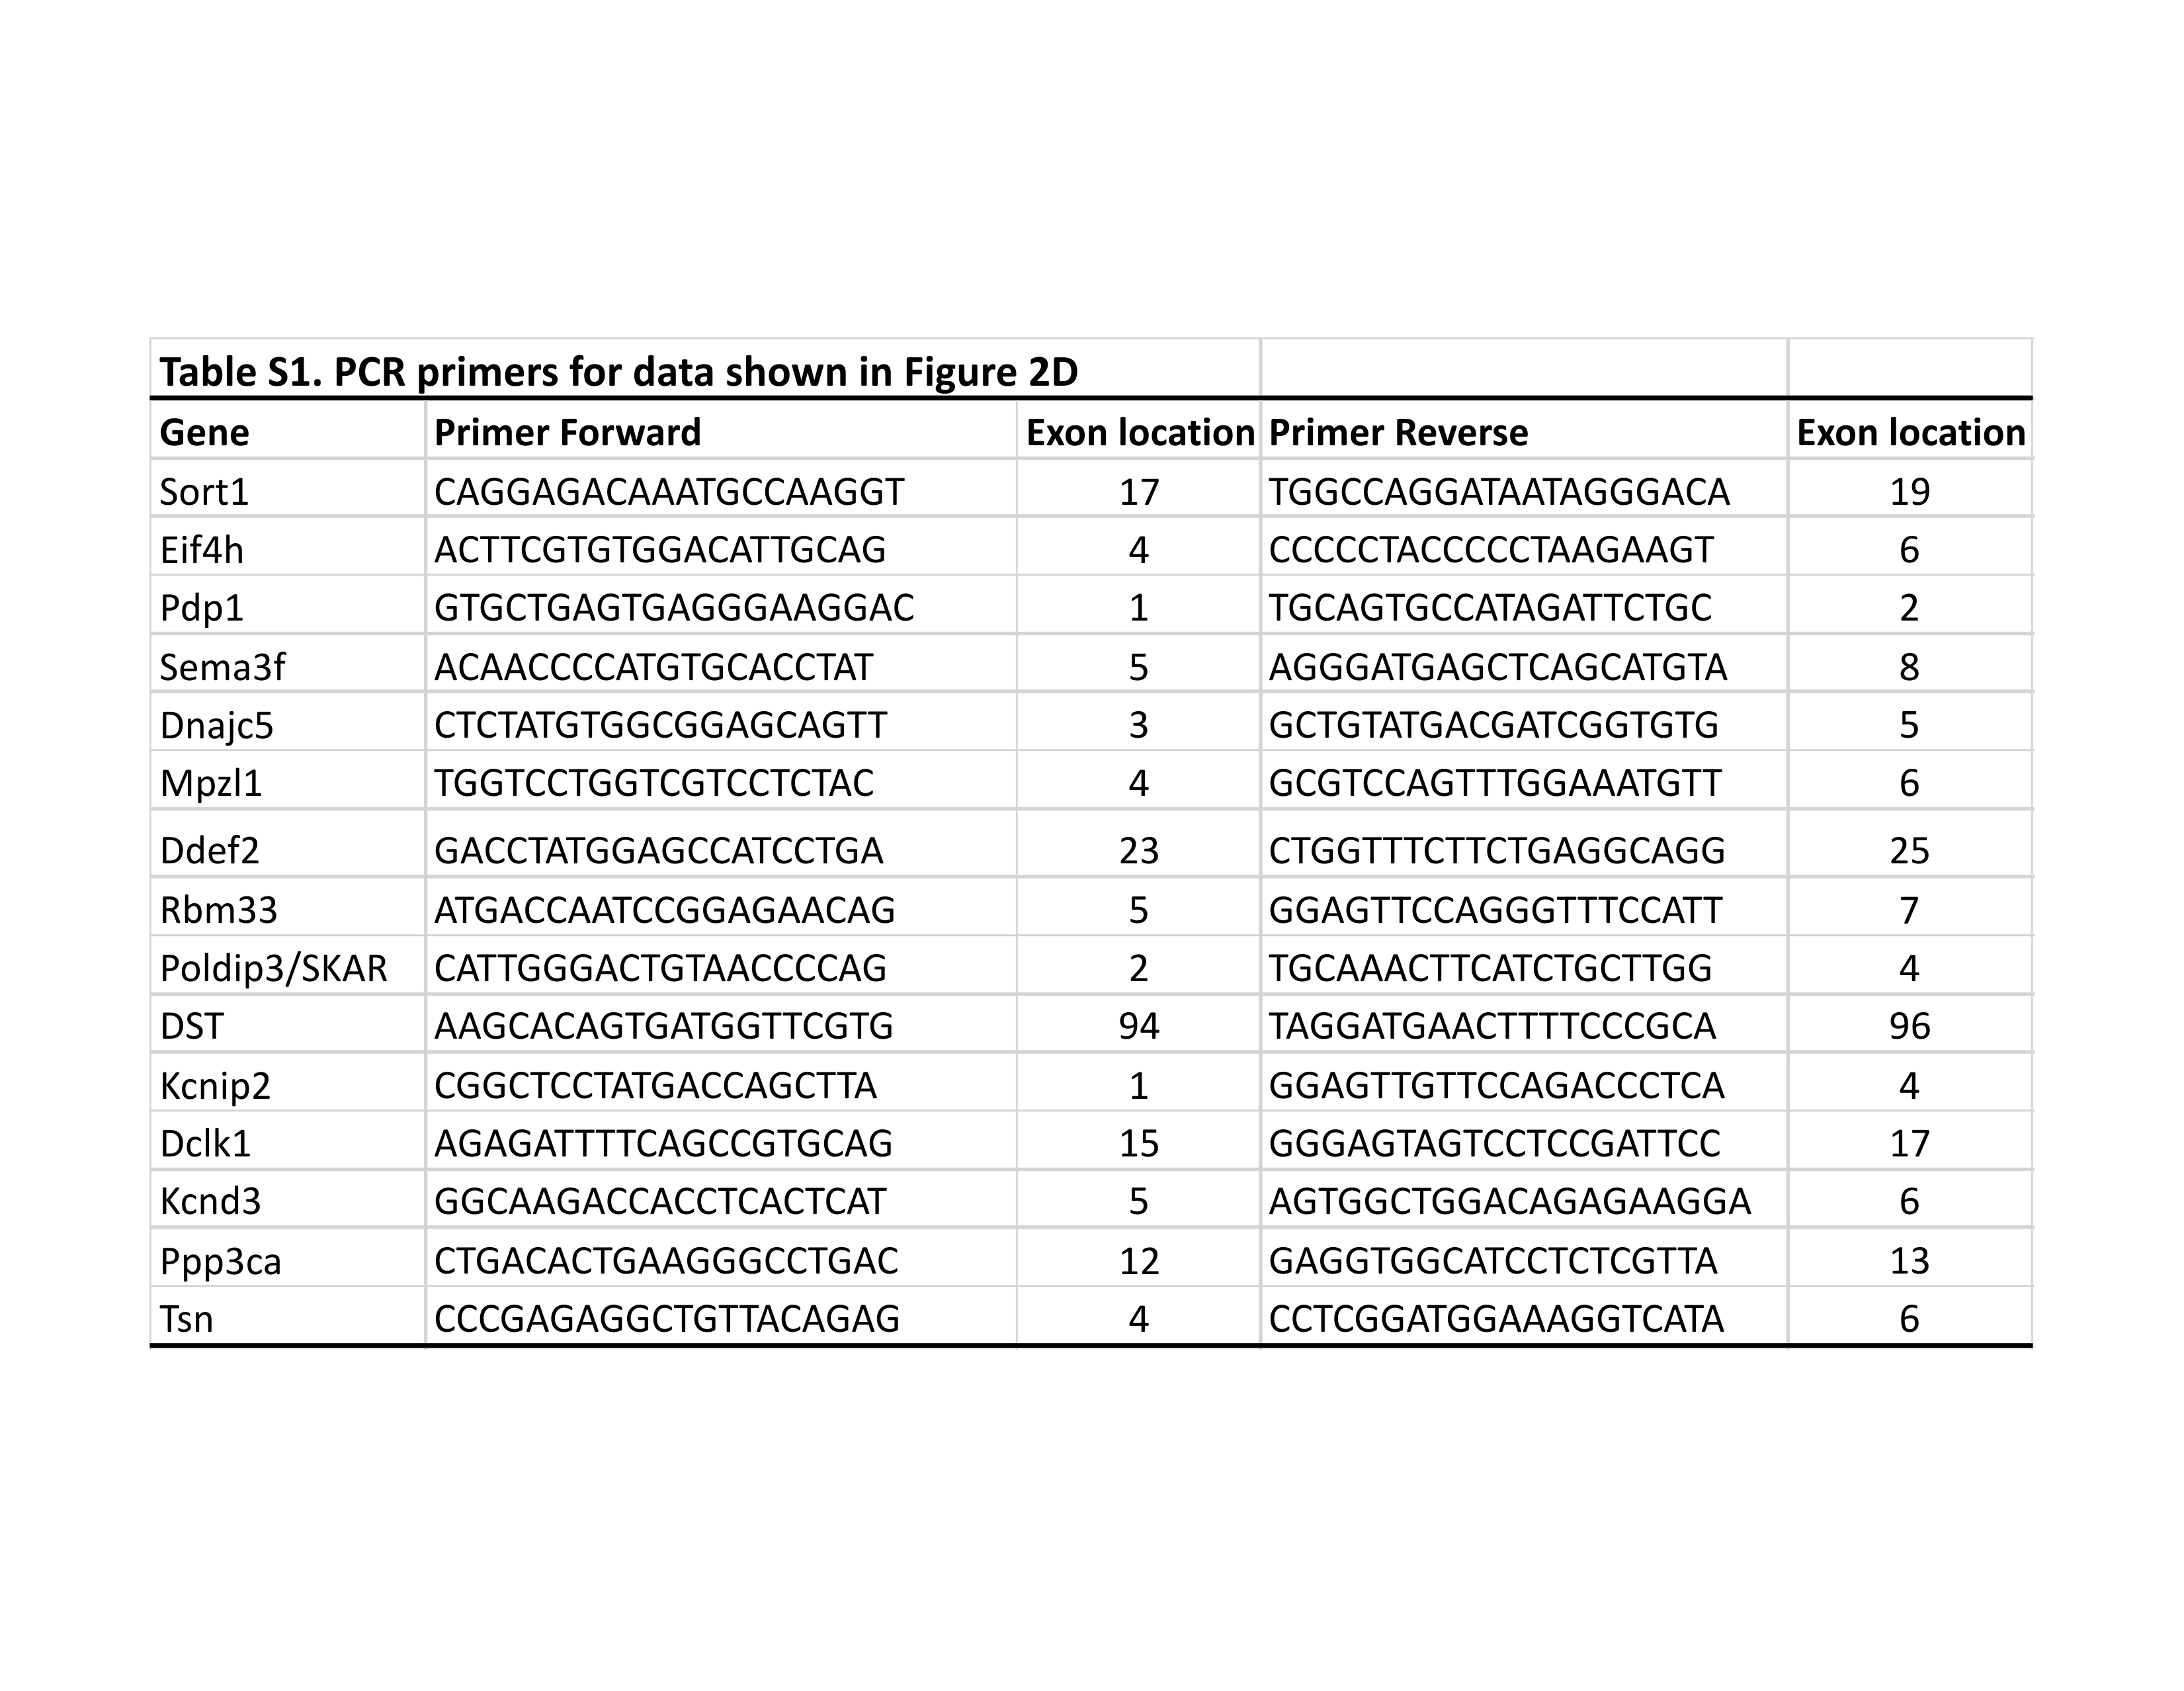
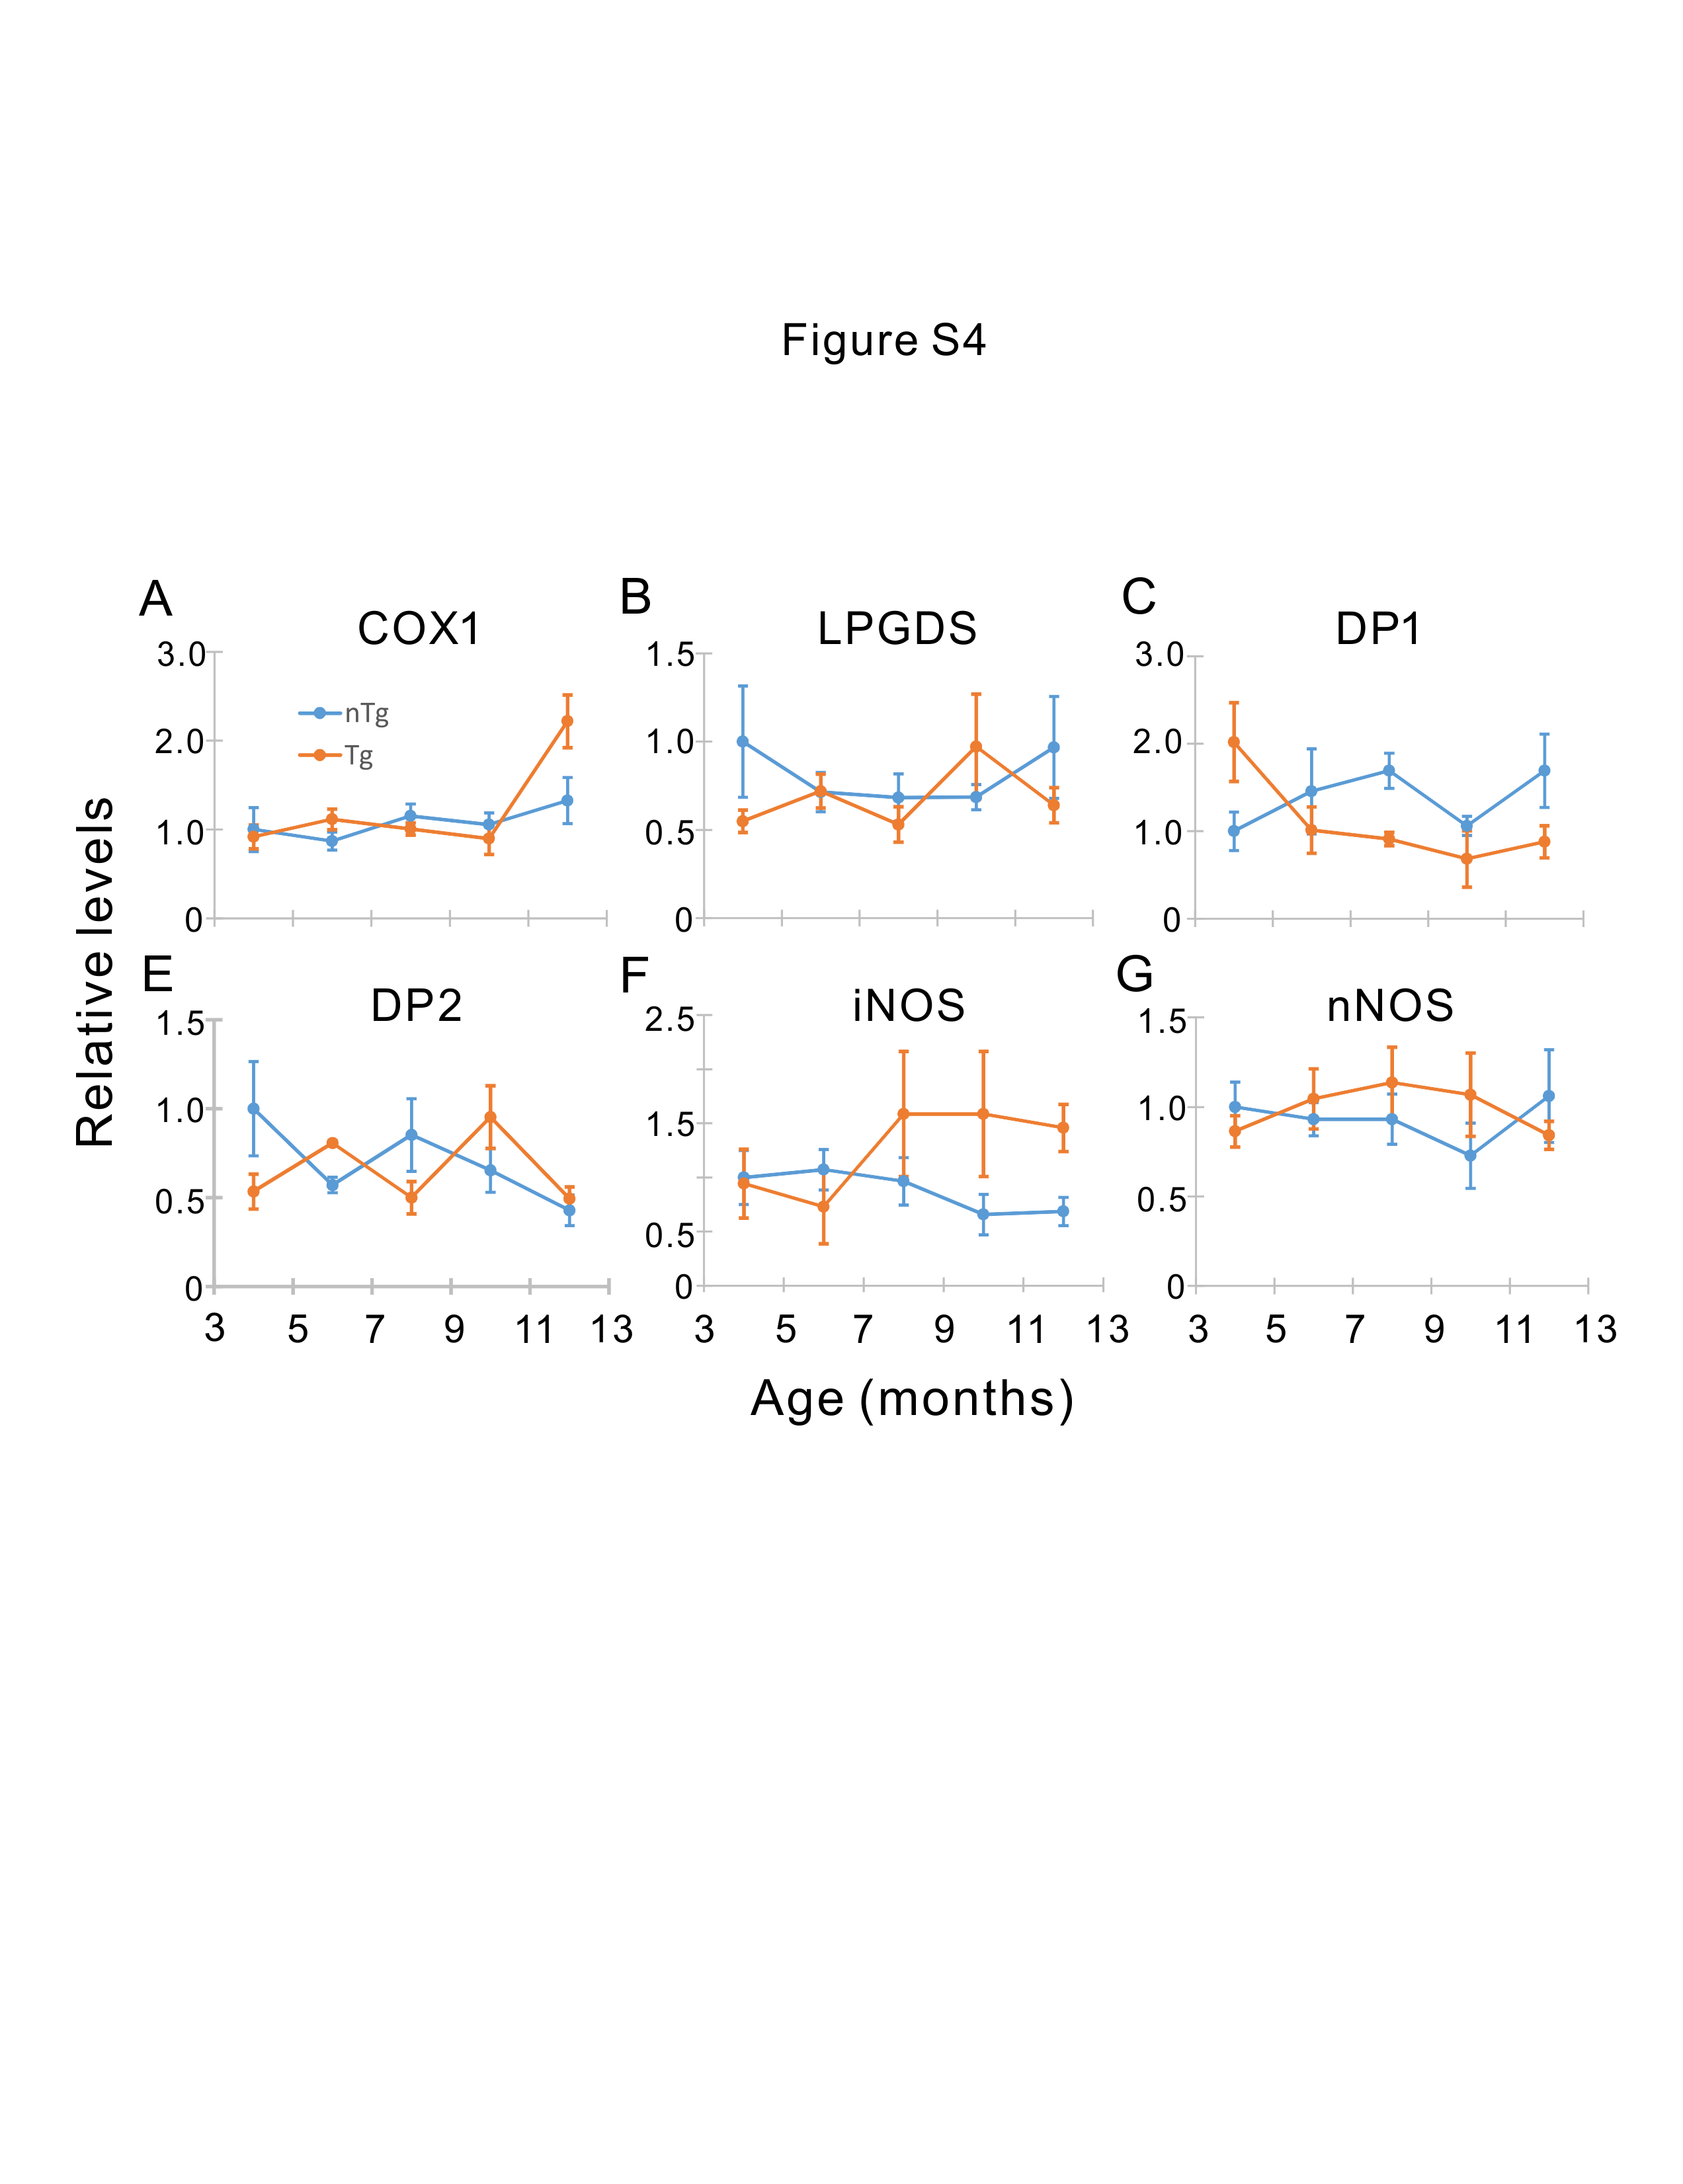
RT-PCR and qRT-PCR
For total RNA extraction, frozen tissues or sorted cells were homogenized in cold TRIzol reagent (Invitrogen) following the manufacturer’s protocol. RNA was then reverse transcribed to cDNA using qScript cDNA SuperMix (Quanta BioSciences). For testing candidate splicing targets, RT-PCR amplification using between 33 and 37 cycles were performed from at least three nTg mice and three Tg mice. Products were separated on 2% agarose gels and visualized by staining with ethidium bromide and photographed. For qRT-PCR measurements of candidate gene targets, real-time PCR was performed on the cDNA using the primers for the targets. The PCR cycles were carried out in a Bio-Rad Real-Time PCR system (C1000 Thermal Cycler, Biorad), and the PCR product was detected using Sybr Green. The levels of target genes were standardized to the housekeeping gene GAPDH in individual animals and then further normalized to the mean ΔCT of the wild type mice.
Immunofluorescence and immunohistochemistry
Mice under deep anesthesia were transcardially perfused with cold PBS, followed by 4% paraformaldehyde in PBS. The perfused mice were then immersed in the same fixative at 4°C for another 24-48h. After fixation, tissues were immersed in PBS containing 30% sucrose at 4°C for 2–3 days. Tissues were then frozen in OCT freezing media (Sakura, Torrance, CA) and stored at -20°C. Frozen sections were cut at 20 µm using a cryostat. For immunostaining, sections were incubated in the blocking solution (5% normal serum in PBS, pH 7.4) for 1 hour at room temperature (RT) and then incubated with a primary antibody in the blocking solution overnight at 4°C. The dilutions and source of primary antibodies were as follows: NeuN (Millipore MAB377, 1:200), calbindin (Millipore AB1778, 1:500), GFAP (Abcam Ab7260, 1:1000), IBA1 (BioCare Medical CP290AB, 1:200), APC (EMD Bioscience OP80-100UG, 1:200), GFP (Invitrogen G10362, 1:333), ChAT (Millipore AB1044P, 1:200), rabbit polyclonal antibody raised to amino acids 394-414 of human TDP-43 (custom made), TDP-43 (Encor biotechnology MCA-3H8, 1:250), NF-L (Cell Signaling, #2837,1:100), CNPase (Cell Signaling, #5664s,1:100), MBP(Abcam,ab62631,1:100), NFkB-p65 (Cell Signaling,#8242, 1:100), activated caspase3 (R&D system, AF835,1:1000). Sections were then washed 3 times for 5 minutes each and incubated in the appropriate secondary antibody at room temperature for 90 minutes. For immunofluorescence, the sections were washed 3 times in PBS for 5 minutes each and mounted with Vectashield mounting medium containing 4,6-diamidino-2-phenylindole (DAPI, Vector Laboratories) and sealed with nail polish. Images of the brain and spinal cord sections were taken with a confocal microscope (Leica).
For quantification of TDP-43 signal intensity in the nucleus and cytoplasm, sections were double-stained for TDP-43 and cellular markers. After staining, the cells were visualized and photographed using confocal microscopy. The cells in the ventral horn of the spinal cord were measured for their fluorescence intensity using the Nikon NIS Elements software. For each cell, the average fluorescence intensity was calculated. Cells on at least 5 different sections from each of the three or more mice per genotype were measured.
For immunohistochemistry, sections were washed 3 times in PBS containing 0.25% Tween 20 and then stained following the manufacturer’s instructions for Vectastain ABC kit, Elite PK-6100 standard ImmPact tm DAB peroxidase Substrate kit SK-4105 (Vector Lab). The sections were then mounted on slides and dried overnight at 55°C. After soaking in Xylenen 2 times for 2 minutes each, the slides were sealed with Permount (Vector Lab).
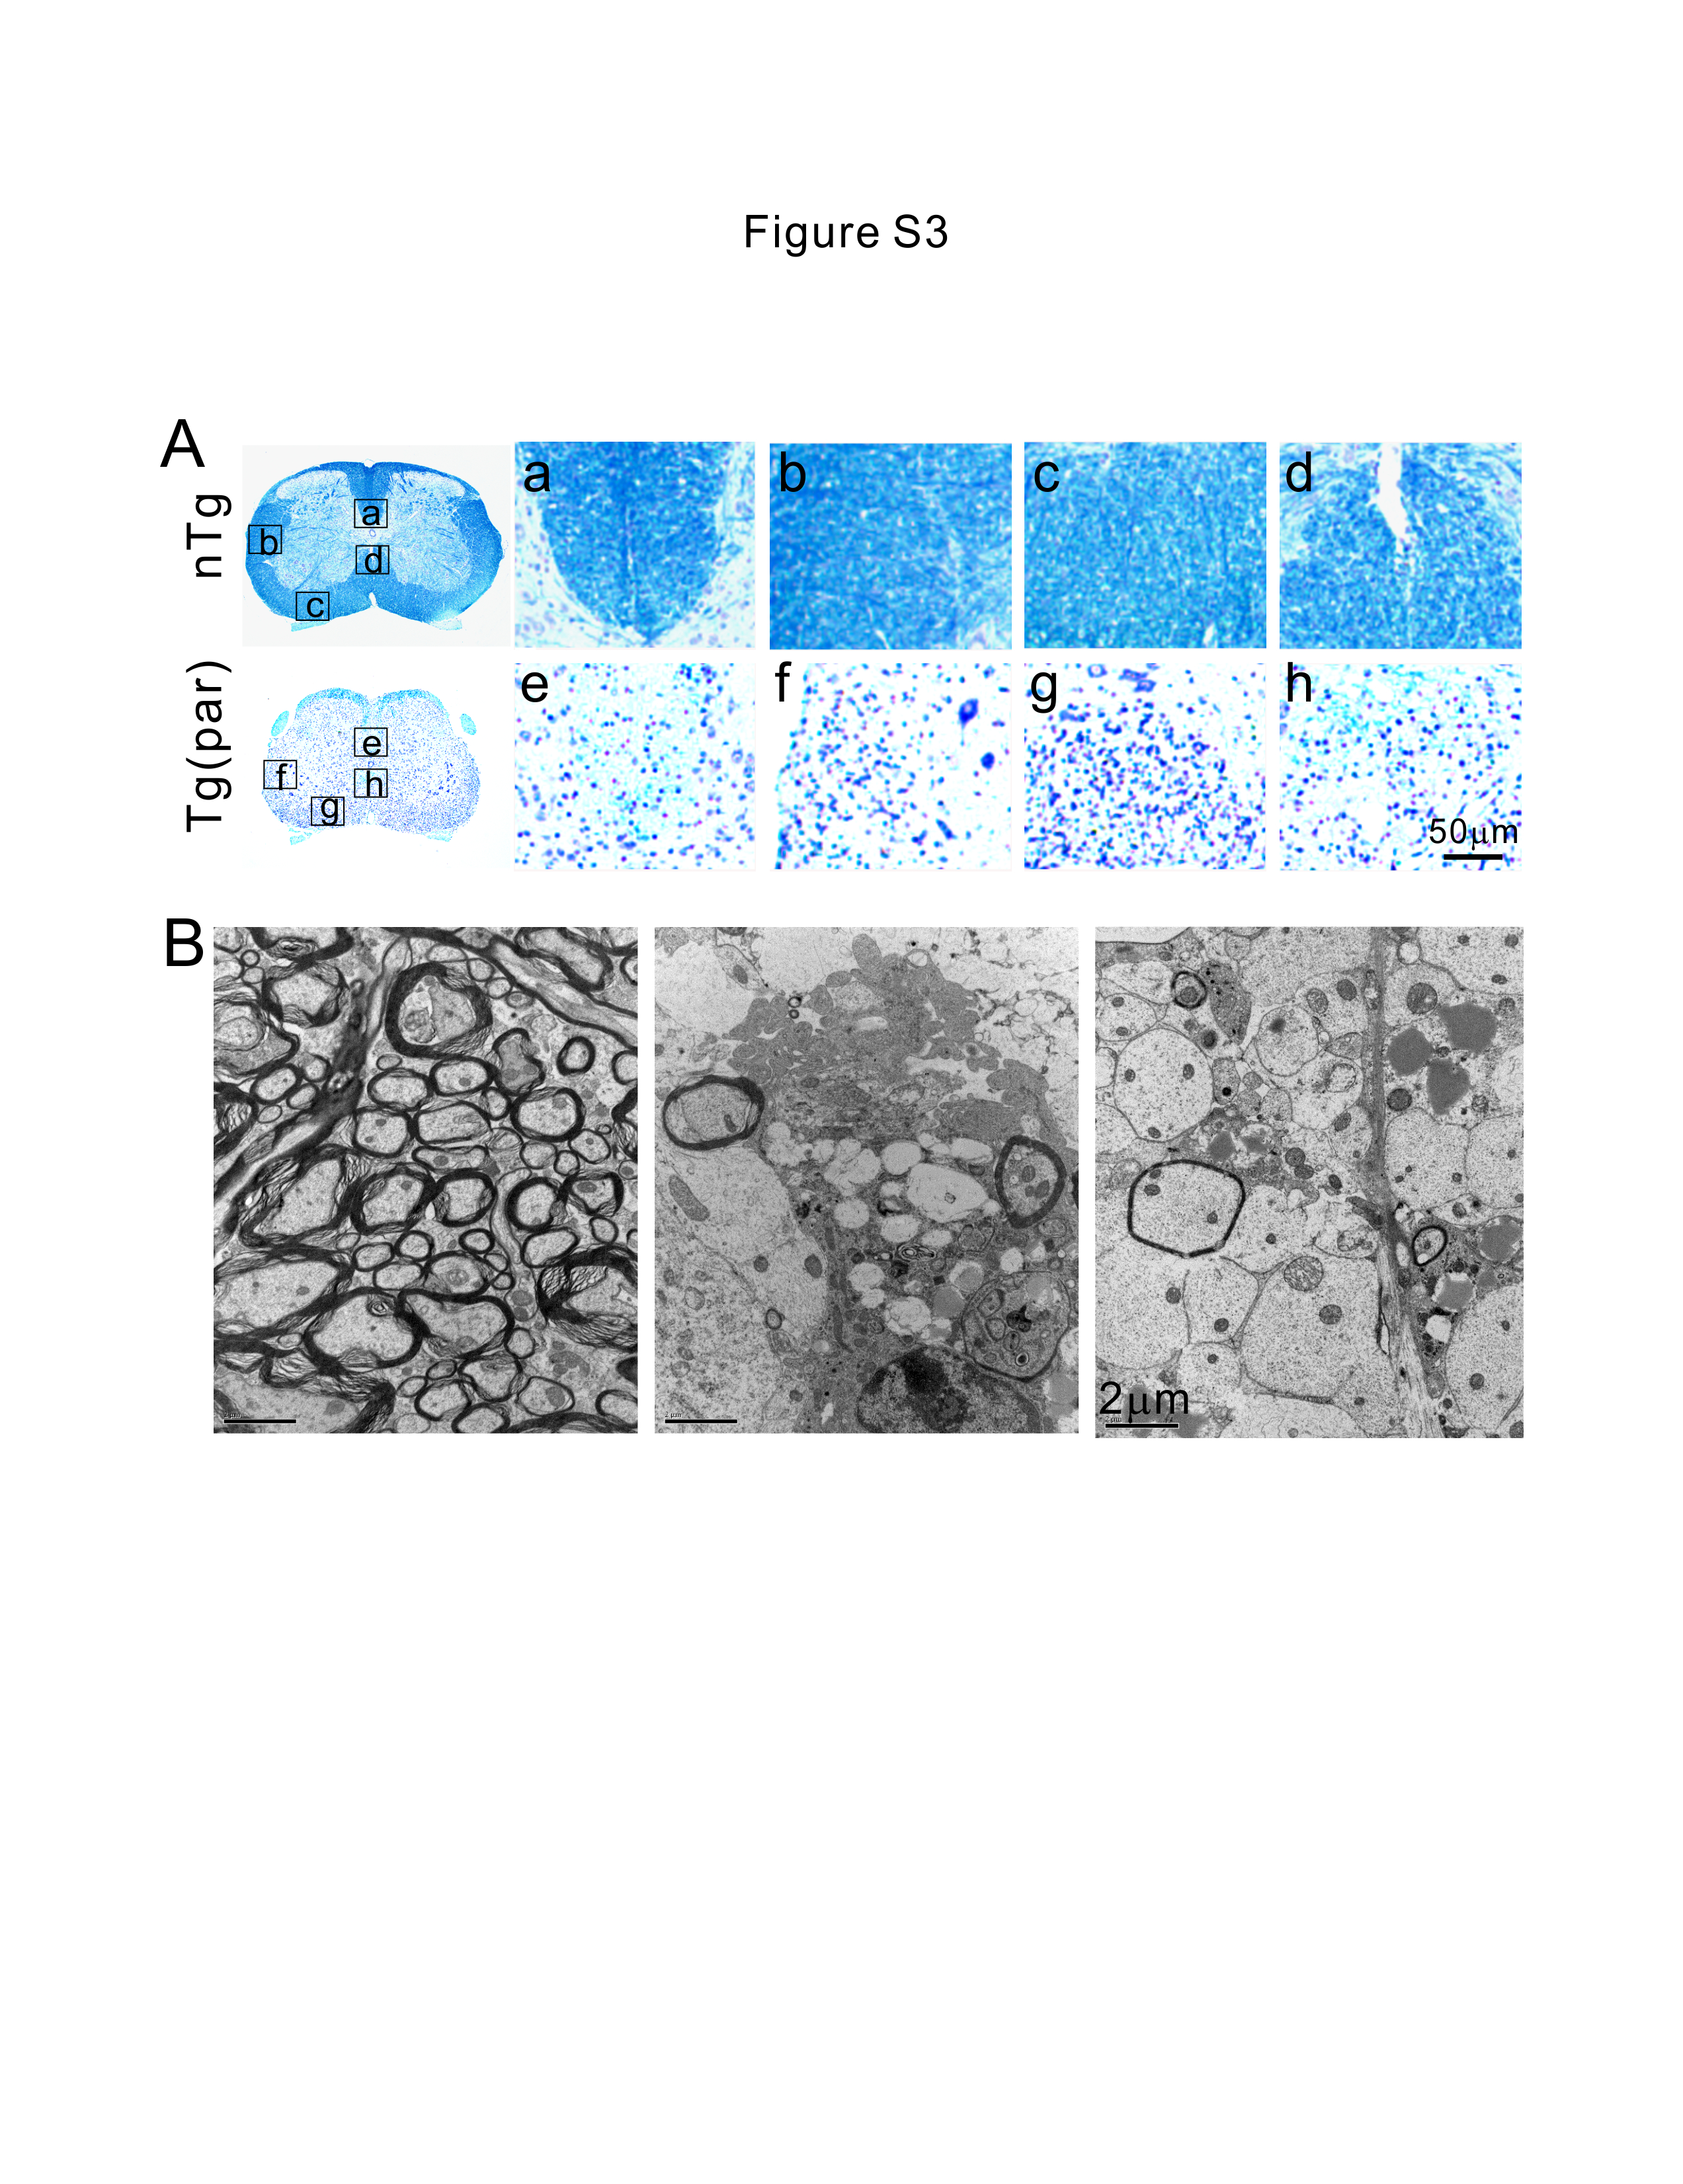
Detection of demyelination
To detection of demyelination, mice were fixed by transcardial perfusion using 4% paraformaldehyde and 2.5% glutaraldehyde in 0.1M sodium phosphate (pH 7.6). Tissues were further fixed by soaking in the same fixative at 4°C for 24 hours. Luxol fast blue staining was performed on 10-μm spinal cord or brain paraffin-embedded sections for demyelination.
Visualization and quantification of neurodegeneration
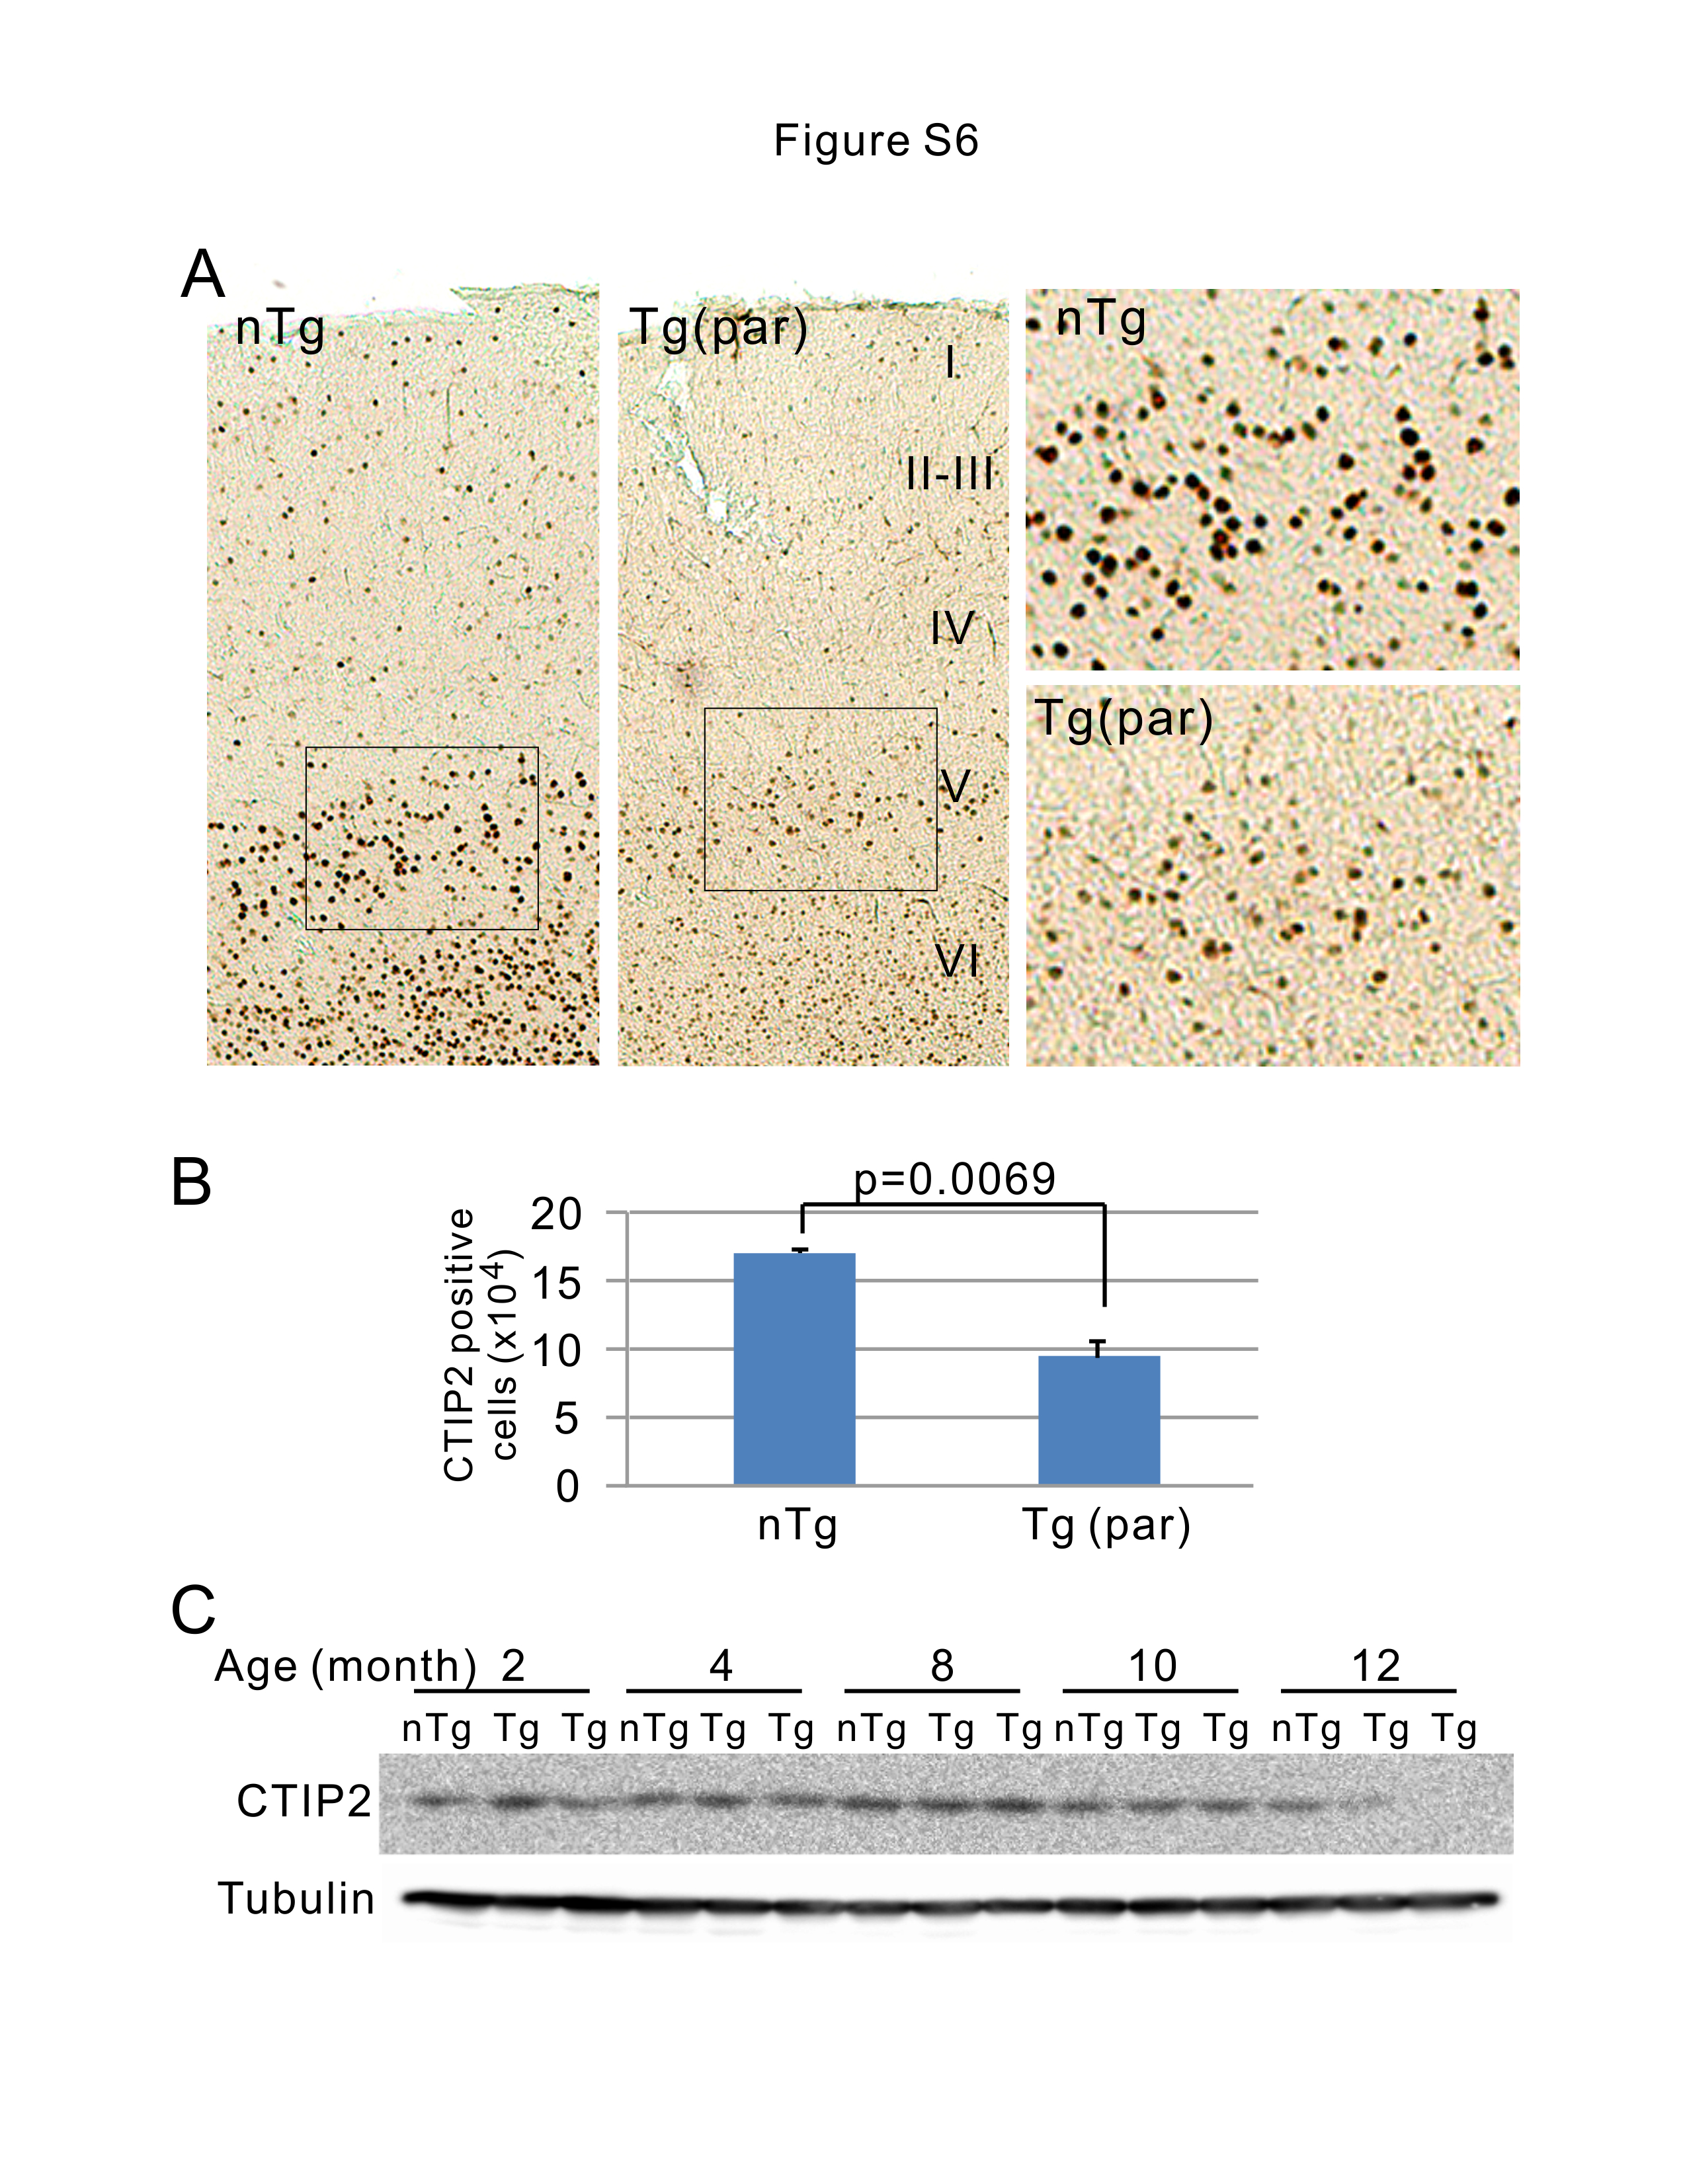
For visualization and quantification of the cortical neurons, whole mouse brains were placed in 30% sucrose solution for 2 days, frozen, and sectioned sagittally at 50 µm thickness. Layer V pyramidal neurons were counted using every ninth section, with a total of nine sections per half brain. Sections were mounted onto gelatin coated slides and stained with CTIP2 or Cresyl violet. Stereological counting was performed using Stereo Investigator software (MBF Bioscience, Williston VT). Counting was performed within the motor area of cortical layer V. Only pyramidal neurons with a soma greater than 15 µm in diameter were included. A single experimenter who was blinded to the genotype performed all counts.
For visualization of ventral root axons, mice were fixed by transcardial perfusion using 4% paraformaldehyde and 2.5% glutaraldehyde in 0.1M cacodylate (pH 7.6). Tissues were further fixed by soaking in the same fixative at 4°C for 24 hours. L4 and L5 roots attached to dorsal root ganglia were dissected and postfixed with 2% osmium tetroxide in 0.1 M phosphate (pH 7.6), dehydrated in a graded ethanol series, and embedded in Epon-Araldite resin. One-micron sections were stained with toluidine blue and examined and photographed by light microscopy.
For quantification of ventral horn motor neurons, lumbar enlargement of the fixed spinal cords were sectioned on a cryostat at 20µm thickness. Every other section was collected until a total of ten sections were collected from each spinal cord. The sections were stained with goat ChAT antibody at 4°C overnight. A secondary donkey anti-goat biotinylated antibody and a Vectastain ABC and DAB peroxidase Substrate kit (Vector Lab) were used to reveal motor neurons. Images of the spinal cord sections were taken using a Nikon microscope, and motor neuron numbers in the ventral horn region were counted manually from each section.
For muscle histology, isopentane in a container was pre-chilled with liquid nitrogen until the isopentane started to solidify at the bottom of the container. A fresh specimen isolated from gastrocnemius muscle was placed on a cork disc with a drop of OCT, which kept the muscle in the desired orientation. The specimen was frozen by immersion into the isopentane for about 5 seconds and then stored at -20°C. The frozen tissue was sectioned using a cryostat and stained with Hematoxylin & Eosin (H&E).
Electromyography
Mice were anesthetized by inhalation of isoflurane. Animals were placed immediately on a heating pad to maintain their core temperature at 37°C. Measurements were performed using a Cardinal Synergy electromyography (EMG) machine. A ground self-adhesive gelled surface electrode was placed over the tail. Potentials were recorded from several sites of the muscles of all four limbs with a concentric needle electrode (30G) using a gain of 50 µV/division and a bandpass filter with low and high cut-off frequency settings of 20 and 10,000 Hz, respectively. The entire recording process took 15-20 minutes per mouse, after which the mice were euthanized by isoflurane overdose or used for tissue collection.
Visualization and quantification of neuromuscular junctions
Animals are euthanized via an overdose of isoflurane, then transcardially perfused with PBS for 2 minutes, followed by 4% paraformaldehyde for 5 minutes. Gastrocnemius muscles were dissected out and placed in 1.5% paraformaldehyde for 24 hours at 4°C. The muscles were then washed with PBS for 30min at 4°C and placed in 25% sucrose overnight at 4°C. Muscles were embedded in OCT medium, frozen rapidly, and stored at -80°C. Sections were cut at 35nm thickness using a Leica Cryostat, placed on Superfrost Plus slides, and stored at -80°C. Slides were allowed to defrost for 30 minutes before use. Slides were washed 3 times with PBS for 5 minutes and then 3 times with 4% Triton X-100 for 5 minutes. Sections were blocked using 10% donkey serum in PBS for 3.5 hours at room temperature. A primary antibody solution of Rabbit anti-synaptophysin (ThermoFisher, 1:1000) and rabbit anti-Neuronal class III Beta-Tubulin (Biolegend, 1:1000) diluted in blocking solution was applied for 24 hours at 4°C. Slides were washed again with PBS. A secondary antibody solution of Alexa-488nm-labelled Donkey anti-Rabbit (ThermoFisher, 1:500) and Alexa-555nm α-Bungarotoxin (ThermoFisher, 1:500) diluted in PBS was applied overnight at 4°C in the dark. Slides were imaged on a Nikon microscope. Neuromuscular junctions were then counted and quantified as innervated or denervated Based on nerve occupancy of the endplates. Those with>50% occupancy was counted as innervated and those with <50% were counted as denervated.