Identification of differentially expressed lncRNAs
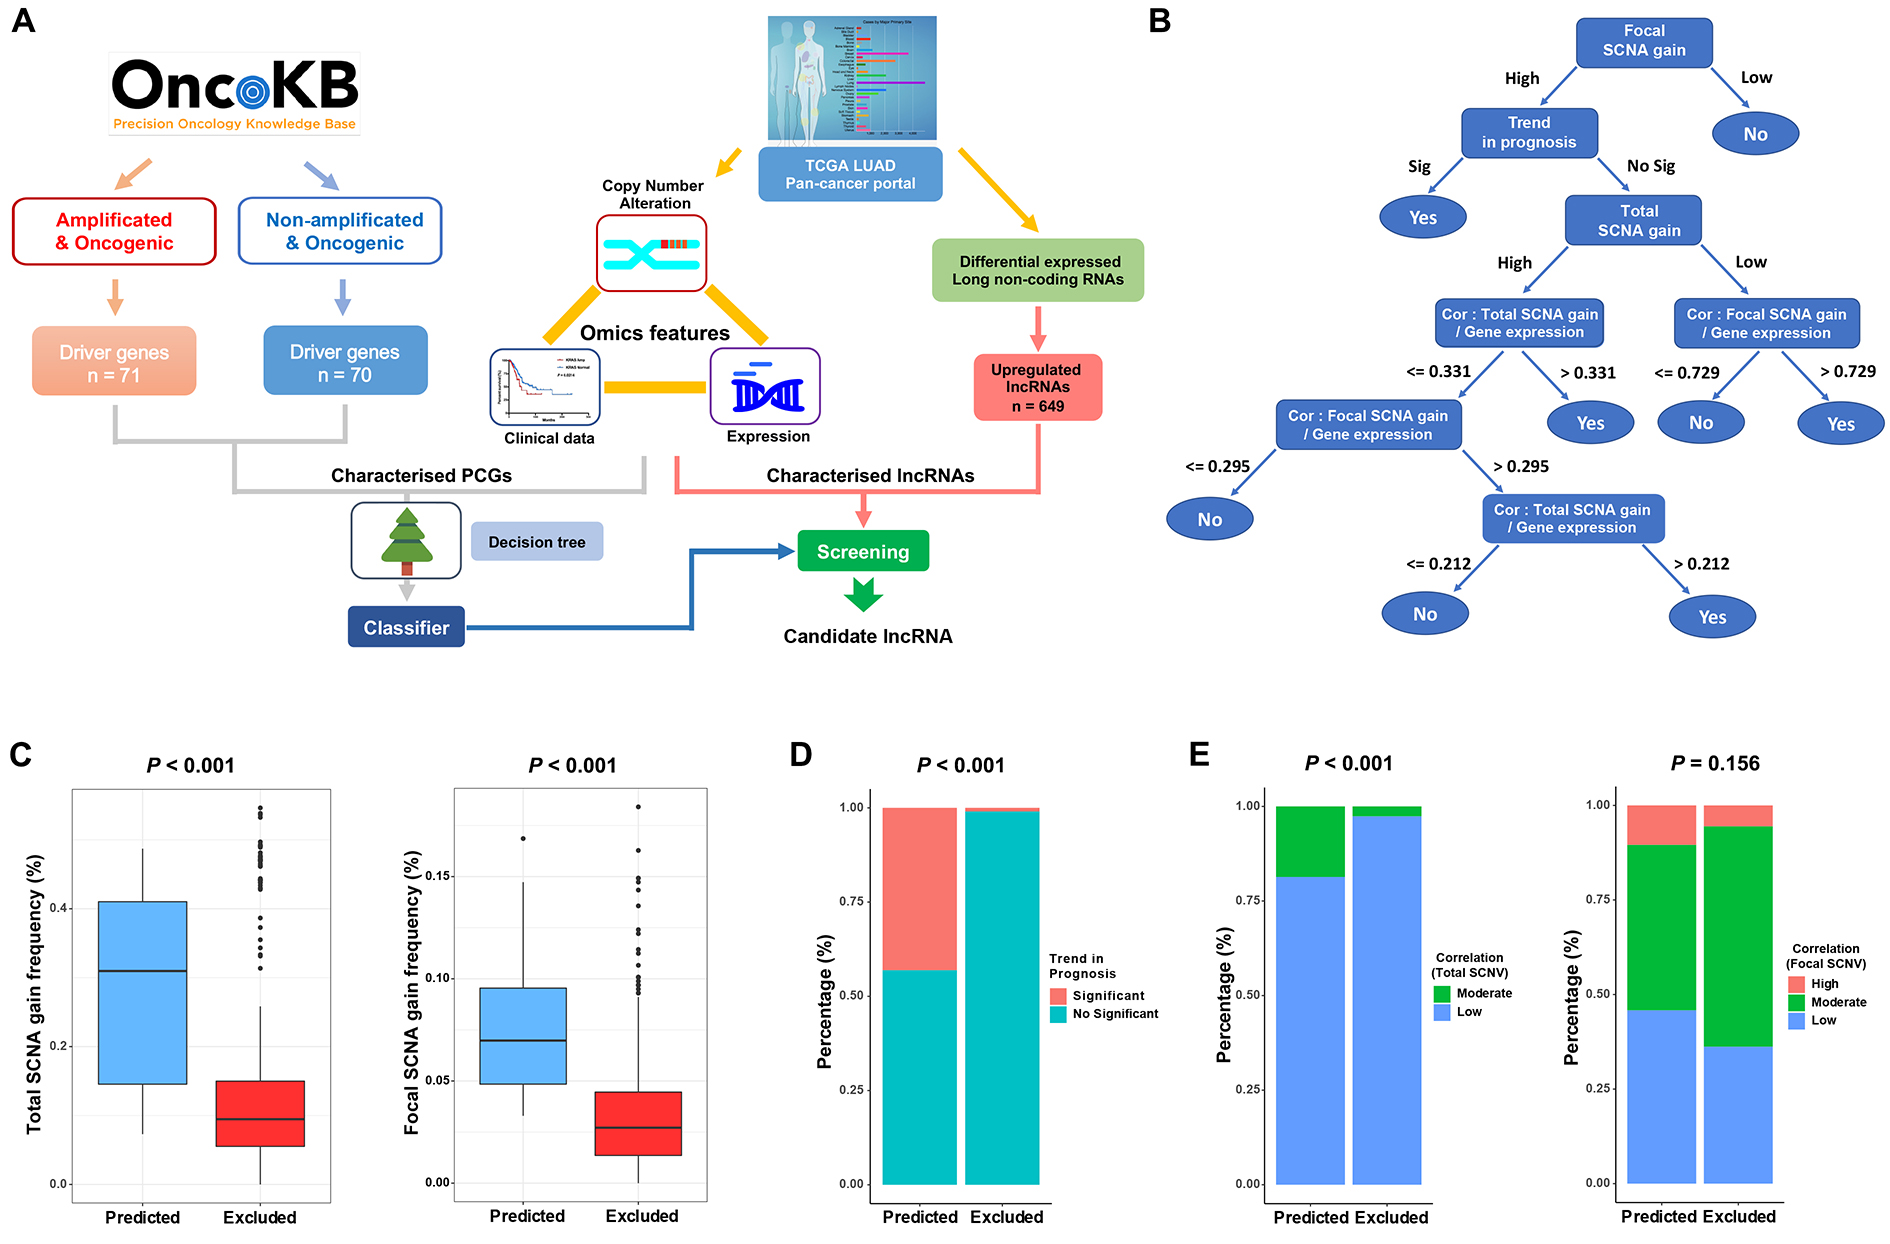
RNA sequencing data from the TCGA LUAD dataset were downloaded from the data portal (https://portal.gdc.cancer.gov) for 585 LUAD patients, including 56 normal lung tissue samples. The R package DESeq2 [14] was applied to HTSeq count data, and it detected 7320 differentially expressed genes (P < 0.01 and fold change > 2.0) among 60483 genes. According to the "Gene_type" annotation by the Ensembl genes database, 596 lncRNAs were screened from differentially expressed genes. Two independent datasets, GSE74095 and GSE12236, were obtained from Gene Expression Omnibus (GEO) (https://www.ncbi.nlm.nih.gov/gds) for use.
Identification of somatic copy number alterations
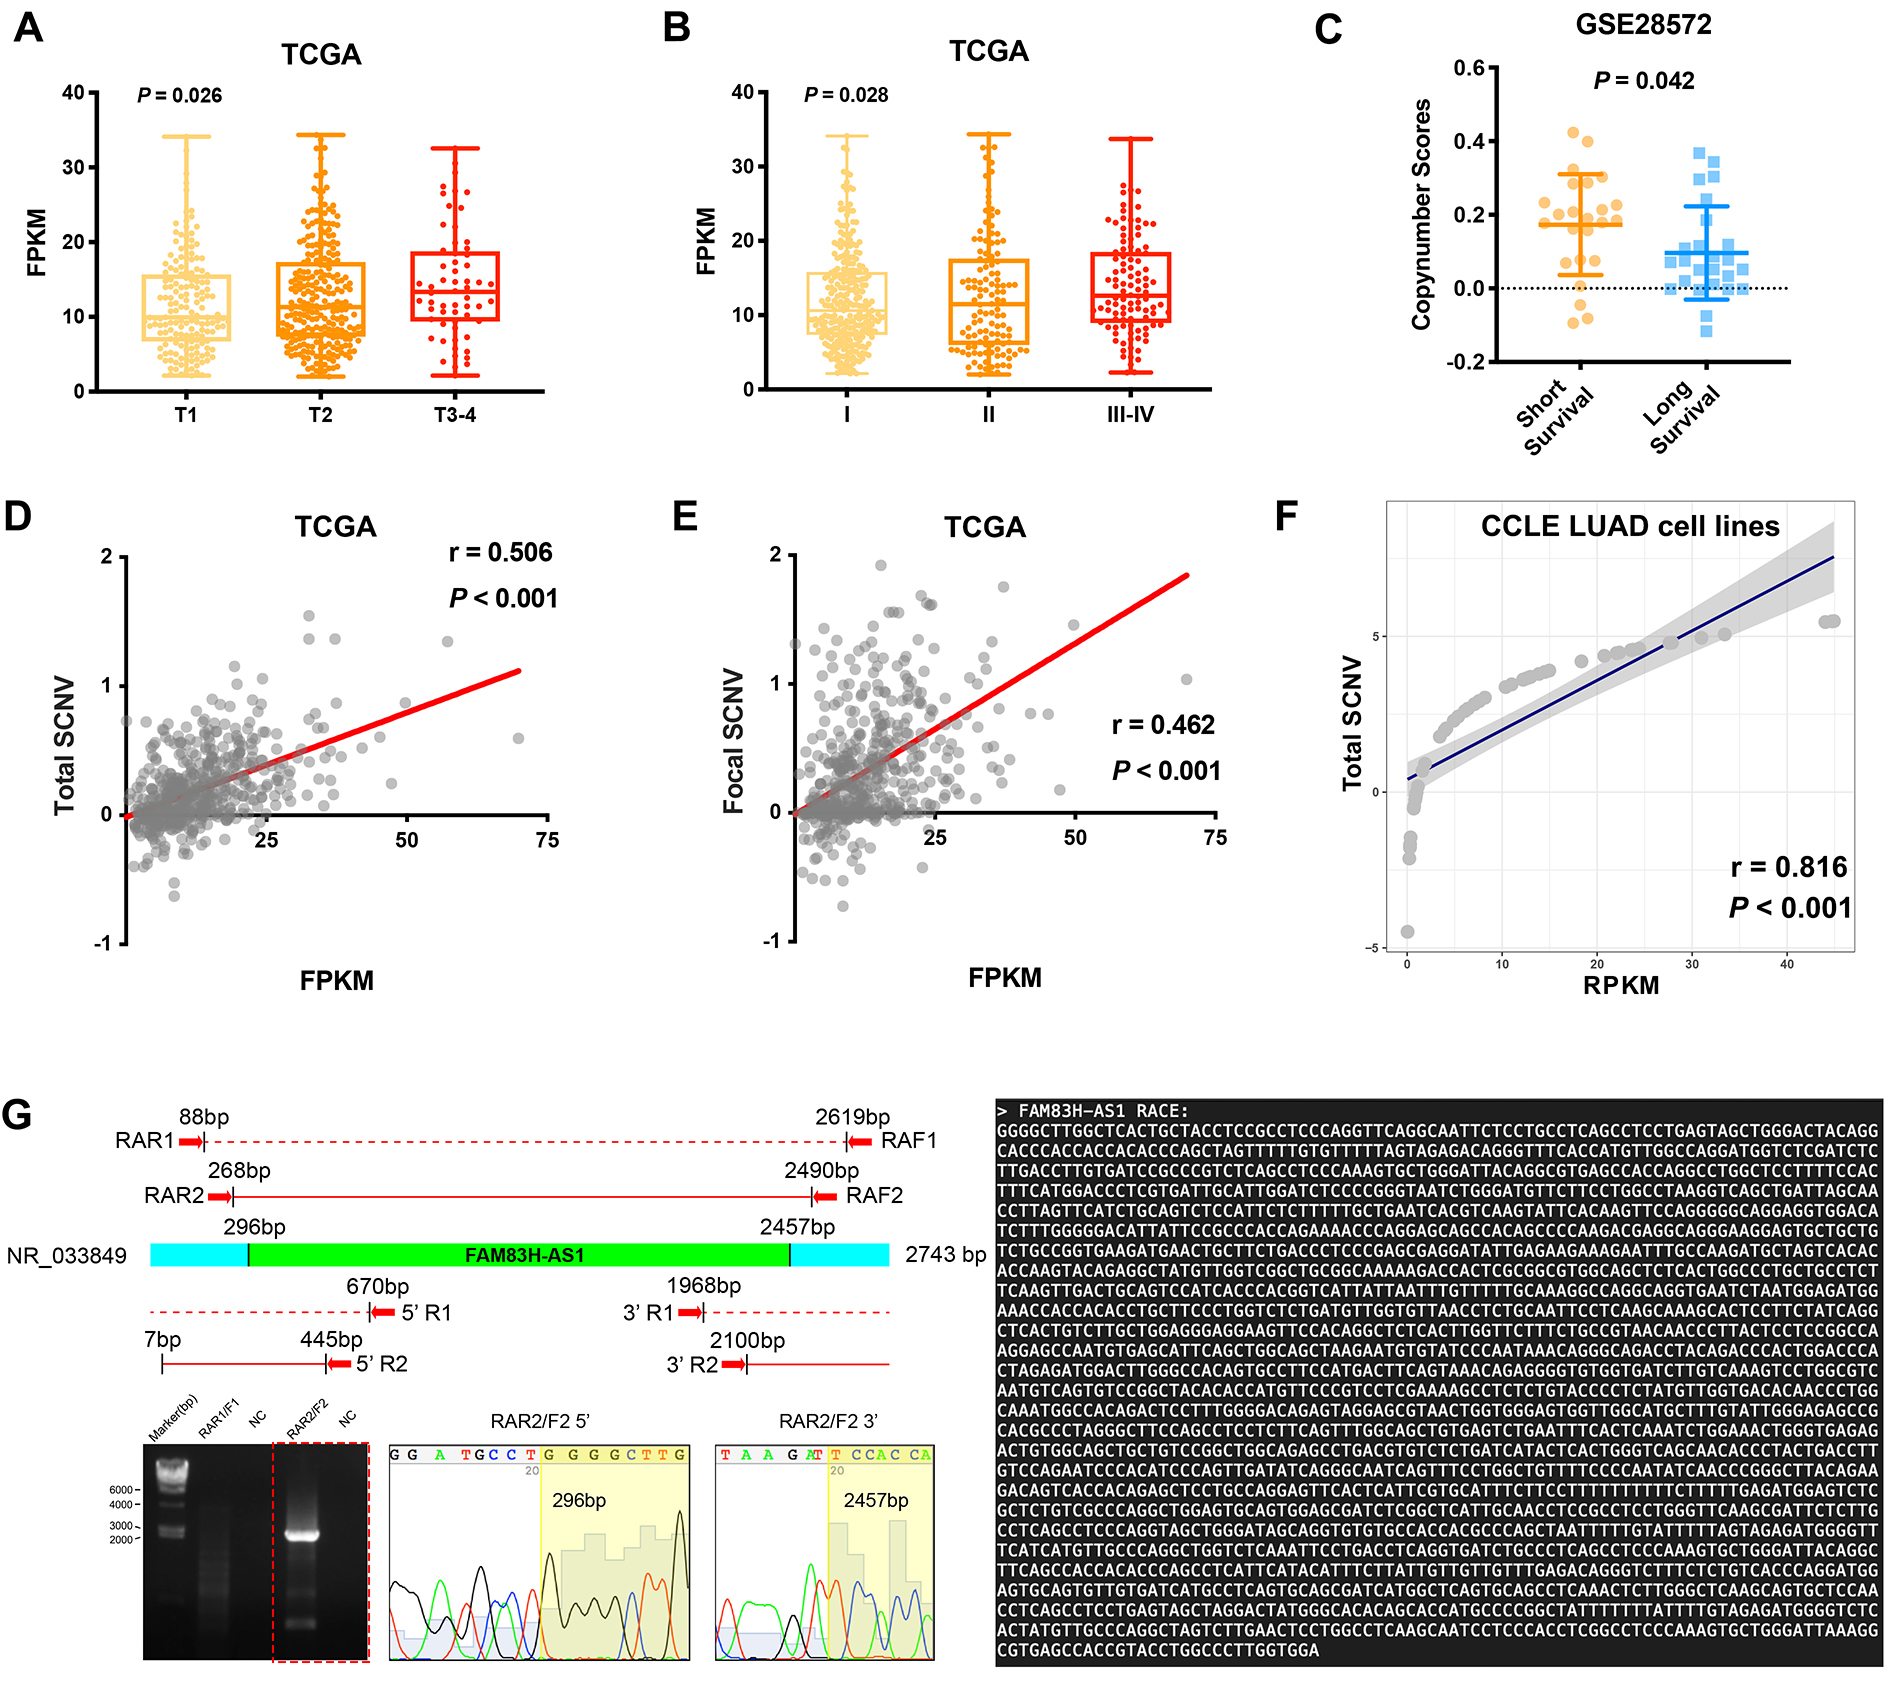
The SCNA profiles of 513 LUAD patients in TCGA were obtained from the data portal (http://gdac.broadinstitute.org/runs). The total SCNA profiles were based on Affymetrix SNP 6.0 with removal of germline variation (http://gdac.broadinstitute.org/runs/stddata__2016_01_28/data/LUAD/), and the focal level SCNA profiles were identified by the GISTIC algorithm [46] (http://gdac.broadinstitute.org/runs/analyses__2016_01_28/data/LUAD/). The independent GSE29065 and GSE28572 datasets and the corresponding prognosis data were obtained from GEO. Additionally, clinical characteristics of patients, including overall survival (OS) and disease-free survival (DFS), were obtained from cBioPortal (http://www.cbioportal.org).
Driver gene annotation and machine learning classifier
The oncogenic annotations of protein-coding genes (PCGs) were obtained from the OncoKB database [3]. Among 290 PCGs annotated with oncogenic genomic variation, we classified PCGs according to whether or not they exhibited amplification to construct the decision tree model. We used the J48 decision tree function in the Weka package [15] to construct a pruned decision tree; we used the feature matrix as input and oncogenic driver annotation as the class variable. Subsequently, LUAD-upregulated lncRNAs were classified by the decision tree to discover candidate oncogenic drivers. In detail, total SCNA and focal SCNA profiles were both included, and Pearson’s correlation analyses were performed between SCNA and expression profiles.
Tissue samples and microarrays
All primary LUAD tissues and adjacent normal tissues were collected from patients who had undergone surgery at the Department of Thoracic Surgery, The Affiliated Cancer Hospital of Nanjing Medical University (Jiangsu Cancer Hospital, Nanjing, China). All included tissue samples were confirmed by experienced pathologists and conducted in accordance with the International Ethical Guidelines for Biomedical Research Involving Human Subjects. Written informed consent was obtained from all patients. This study was approved by the Ethics Committee of the Affiliated Cancer Hospital of Nanjing Medical University. Tissue microarray (TMA) was constructed as described previously [16]. 68 pairs of lung cancer tissues and adjacent normal tissues from Jiangsu Cancer Hospital (JSCH) cohort were used to construct the TMA. RNA chromogenic in situ hybridization (CISH) was performed to detect FAM83H-AS1 expression in TMA using digoxigenin-labeled probe (C10910 lnc1100151, RiboBio). According to percentages of positive stained cancer cells and areas, the CISH score was rated on a scale of one to twelve as described previously [16]. The characteristic and prognostic information of patients included in this study was obtained from follow-up team of Jiangsu Cancer Hospital.
Cell culture, cell proliferation, colony formation and apoptosis assays
All cell lines [A549, H1299, H1650, SPC-A1, H1975, H358, PC9 and human bronchial epithelial cell (HBE)] were purchased from Shanghai Institutes for Biological Science (Shanghai, China). A549, H1650, SPC-A1, H1975, H358 and HBE were cultured in DMEM medium (KeyGene, Nanjing, China); H1299 and PC9 were cultured in RPMI1640 medium (KeyGene), supplemented with 10% FBS with 100 μ/ml penicillin and 100mg/ml streptomycin included. All cell lines were grown in humidified air at 37C° with 5% CO2. Cell cultures were occasionally tested for mycoplasma (last tested December 2018). Authentication of cells was verified by short tandem repeat DNA profiling within 6 months, and cells used in experiments were within 10 passages from thawing.
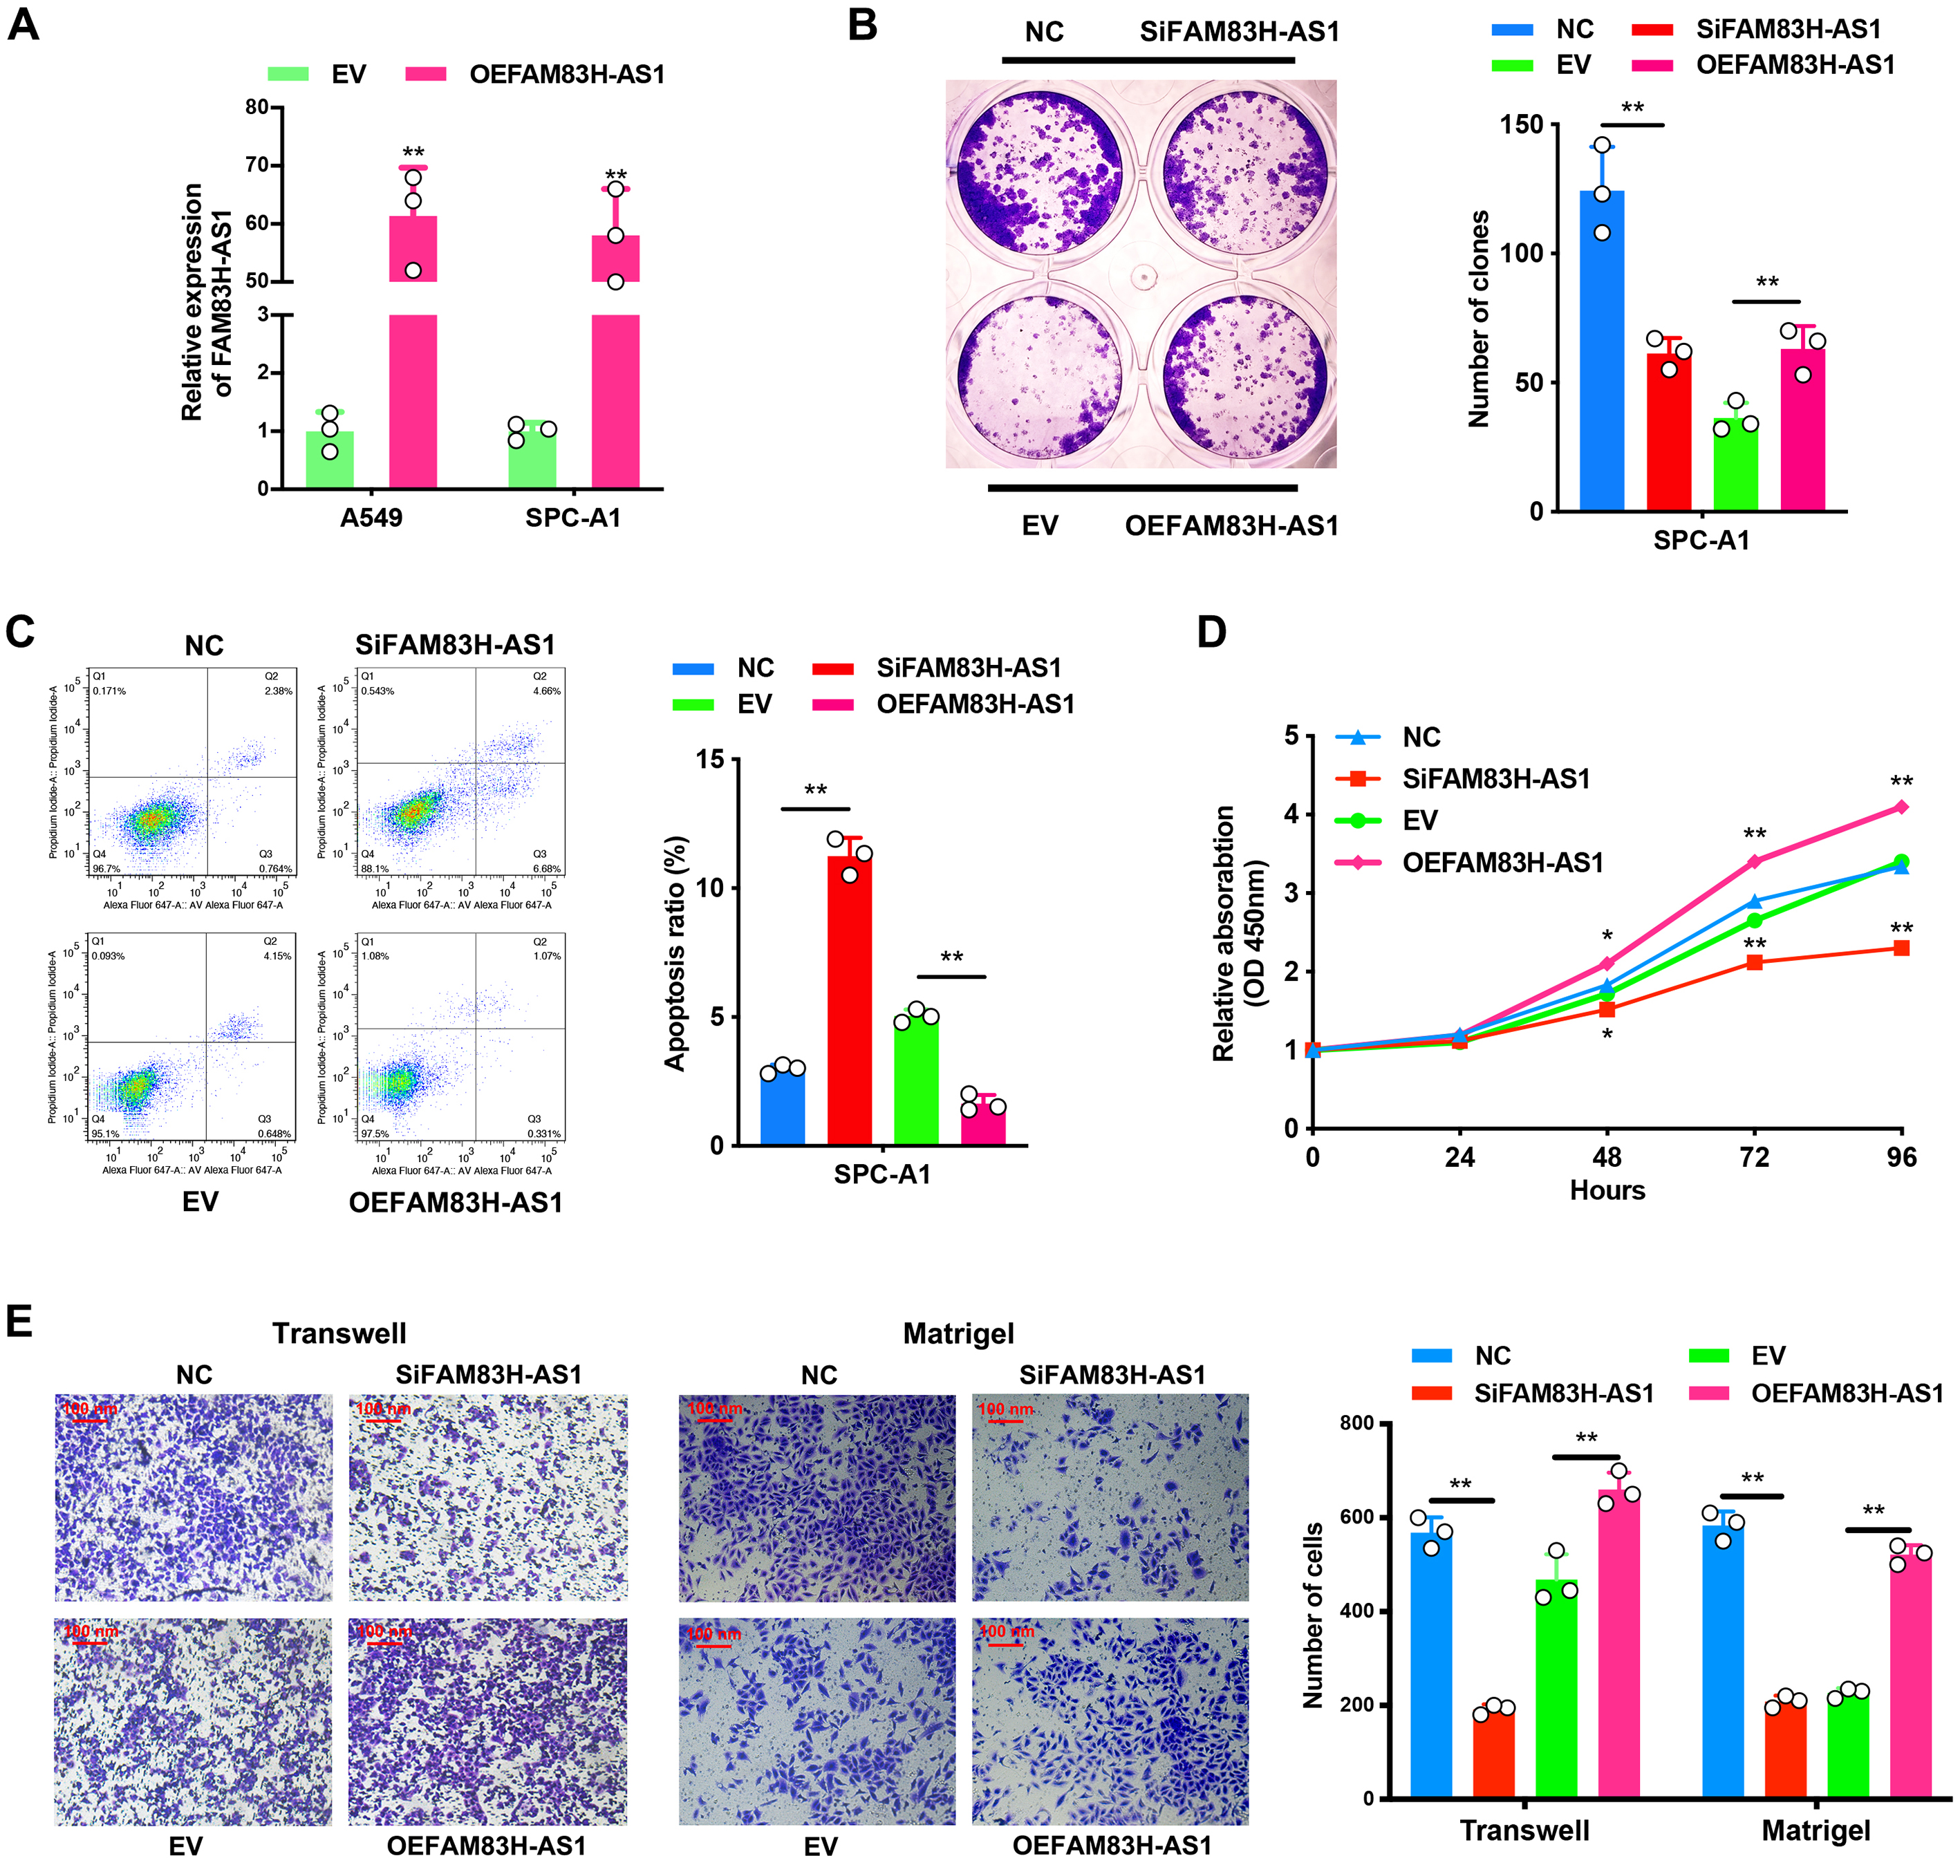
Cell proliferation was examined using a CCK-8 Kit (Roche Applied Science) and Real time xCELLigence analysis system (RTCA) following the research protocol afforded by the manufacturer (ACEA Biosciences). Colony formation assays were performed to monitor LUAD cell cloning capability. Flow cytometer (FACScan; BD Biosciences) equipped with CellQuest software (BD Biosciences) was used to detect apoptosis level.
RNA extraction, genome DNA extraction,Western blot and qRT-PCR analysis, andnuclear and cytoplasmic fractions extraction
RNA extraction, DNA extraction, and qRT-PCR were performed as described previously [16]. GAPDH, β-Actin and snRNA U6 were used as internal controls. All primer sequences were listed in Additional file 1: Table S1. Protein was extracted from transfected cells and quantified as previously described [17] using 12% or 4%–20% poly-acrylamide gradient SDS gel. All antibodies were listed in Additional file 1: Table S2. RNA and protein isolation of nuclear and cytoplasmic fractions were applied with using PARIS Kit according to the manufacturer's protocol (Ambion, Life Technologies).
SiRNA and plasmid construction and cell transfection
The siRNAs were provided by Realgene Biotechnology (Nanjing, China). The full-length cDNA of human FAM83H-AS1 was synthesized and cloned into the expression vector pCDNA3.1 by Vigene Bioscience (Jinan, China). The final construct was verified by sequencing. SiRNA and plasmid vectors transfection was performed as described previously [16]. All siRNA sequences used are listed in Additional file 1: Table S3.
RACE (Rapid amplification of cDNA ends)
5′-RACE, 3′-RACE, and full-length amplification of FAM83H-AS1 were performed using a SMART RACE cDNA Amplification Kit (Clontech) according to the manufacturer’s instructions. The gene-specific primers used for RACE analysis are presented in Additional file 1: Table S1.
RNA immunoprecipitation and pull-down assays
RNA immunoprecipitation was performed as described previously [16], and magnetic beads were conjugated with anti-HNRNPK or control anti-IgG antibody. In vitro translation assays were performed using mMESSAGE mMACHINE T7 Transcription Kit (Invitrogen) according to the manufacturer’s instructions. Then, FAM83H-AS1 RNAs were labeled with desthiobiotinylation using the Pierce RNA 3′ End Desthiobiotinylation Kit (Magnetic RNA-Protein Pull-Down Kit, Components; Thermo Fisher). RNA pull-down assays were performed with Magnetic RNA-Protein Pull-Down Kit according to the manufacturer’s instructions. After elution of lncRNA-interacting proteins, they were subjected to mass spectrometric analysis. Liquid chromatography mass spectrometry (LC-MS) experiments were performed with a linear ion trap quadrupole mass spectrometer (Thermo Finnigan) equipped with a micro-spray source.
Luciferase reporter assays
The mRNA internal ribosome entry segment (IRES) of RAB8B and RAB14 was predicted by IRESite (http://iresite.org). The HNRNPK-binding sites of RAB8B and RAB14 mRNA were identified by the Blast program. The sequences of different fragments were synthesized and then inserted into the pGL3-basic vector (Vigene Bioscience). All constructs were verified by sequencing, and luciferase activity was assessed using the Dual Luciferase Assay Kit (Promega) according to the manufacturer's instructions.
RNA sequencing and quantitative mass spectrometry
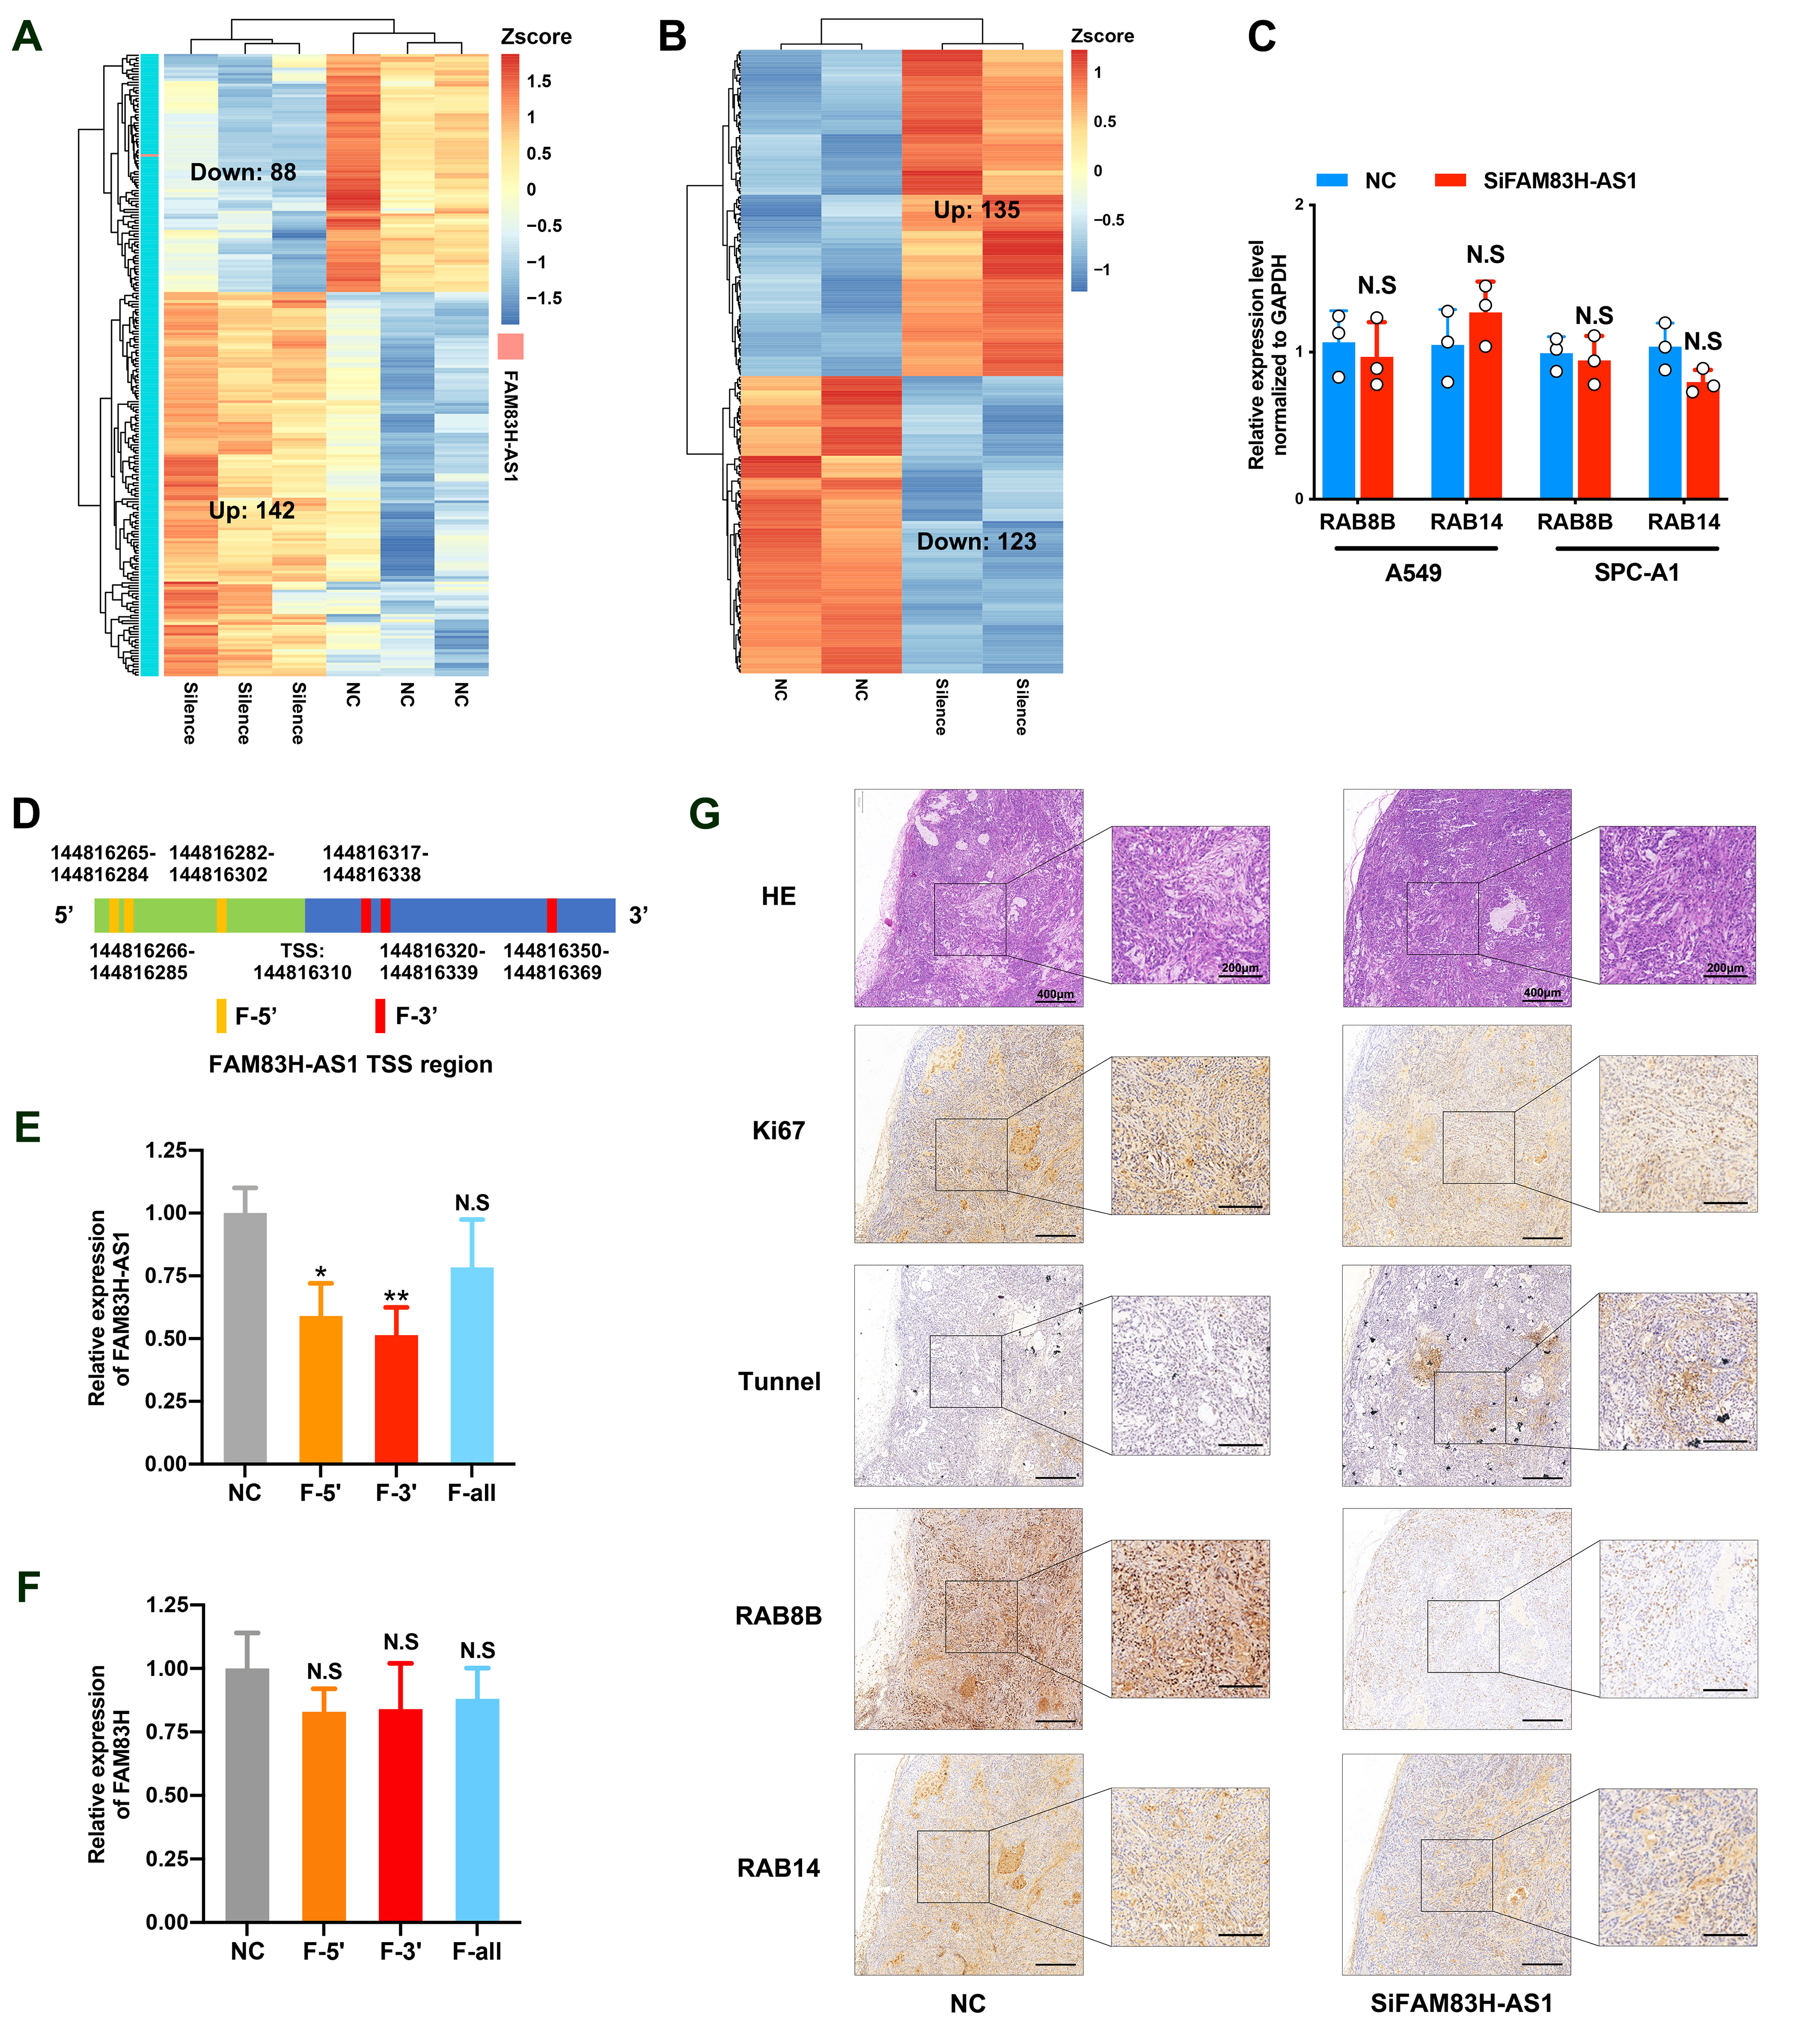
A549 cells were plated in a 6-well plate and transfected with an siRNA targeting FAM83H-AS1 or a negative control. Twenty-four hours after transfection, cells were harvested for RNA extraction and subsequent library construction and sequencing (CapitalBio Technology, Beijing, China). Similarly, cells were harvested for protein extraction and subsequent iTRAQ (Isobaric Tag for Relative Absolute Quantitation)/TMT (Tandem Mass Tags) detection (PTM Bio, Hangzhou, China).
CRISPR interference (CRISPRi)-mediated generation of FAM83H-AS1 knockdown LUAD cells
For the CRISPRi experiments, six paired small guide RNAs (sgRNAs) were designed to target near the transcription start site (TSS) of FAM83H-AS1 (within 250 bp upstream and downstream). The location of the TSS was determined using NCBI (http://www.ncbi.nlm.nih.gov/). The sgRNA oligos were designed, phosphorylated, annealed, and cloned into a pBHCas-ZXS 023 vector using a BsmBI ligation strategy. Additional details and a list of the sgRNA sequences can be found in Additional file 1: Table S1.
In vivo tumor growth assays, tumor engraftment, and PDTX maintenance
All animal experiments were approved by the Nanjing Medical Experimental Animal Care Commission. The zebrafish tumor model was constructed according to the previous study [18]. In brief, 4 Í 102 A549 cells of control or silenced group were labeled by CellTracker CM-DiI (Invitrogen), and zebrafish embryos were monitored 96 hours for investigating tumor invasion and metastasis using a fluorescent microscope. BALB/c nude mice (4 to 6 weeks), purchased from the Vital River Laboratory Animal Technology (Beijing, China), were maintained under specific pathogen-free conditions. For the tumor formation assay, 106 CRISPRi constructed or control cells were subcutaneously injected into one flank of each mouse. Tumor volume was calculated using the following equation: V = 0.5 Í D Í d2 (V, volume; D, longitudinal diameter; d, transverse diameter). The method of building PDTX model has been described in the previous study [16].
Statistical analysis
GraphPad prism 8, R software version 3.5.1 and SPSS 23 were used to plot the figures. Differences between groups were assessed by two-tailed Student’s t test. The strength of the association between continuous variables was tested with Pearson’s correlation test. Uni- and Multi-variate Cox regressions were used to identify independent risk factors of LUAD. For survival analysis, overall survival was calculated using the Kaplan-Meier method and the log-rank test. All P values were two sided and P value < 0.05 were considered to be statistically significant.