3.1 ScRNA-seq and SnRNA-seq analyses of TLE and control hippocampi
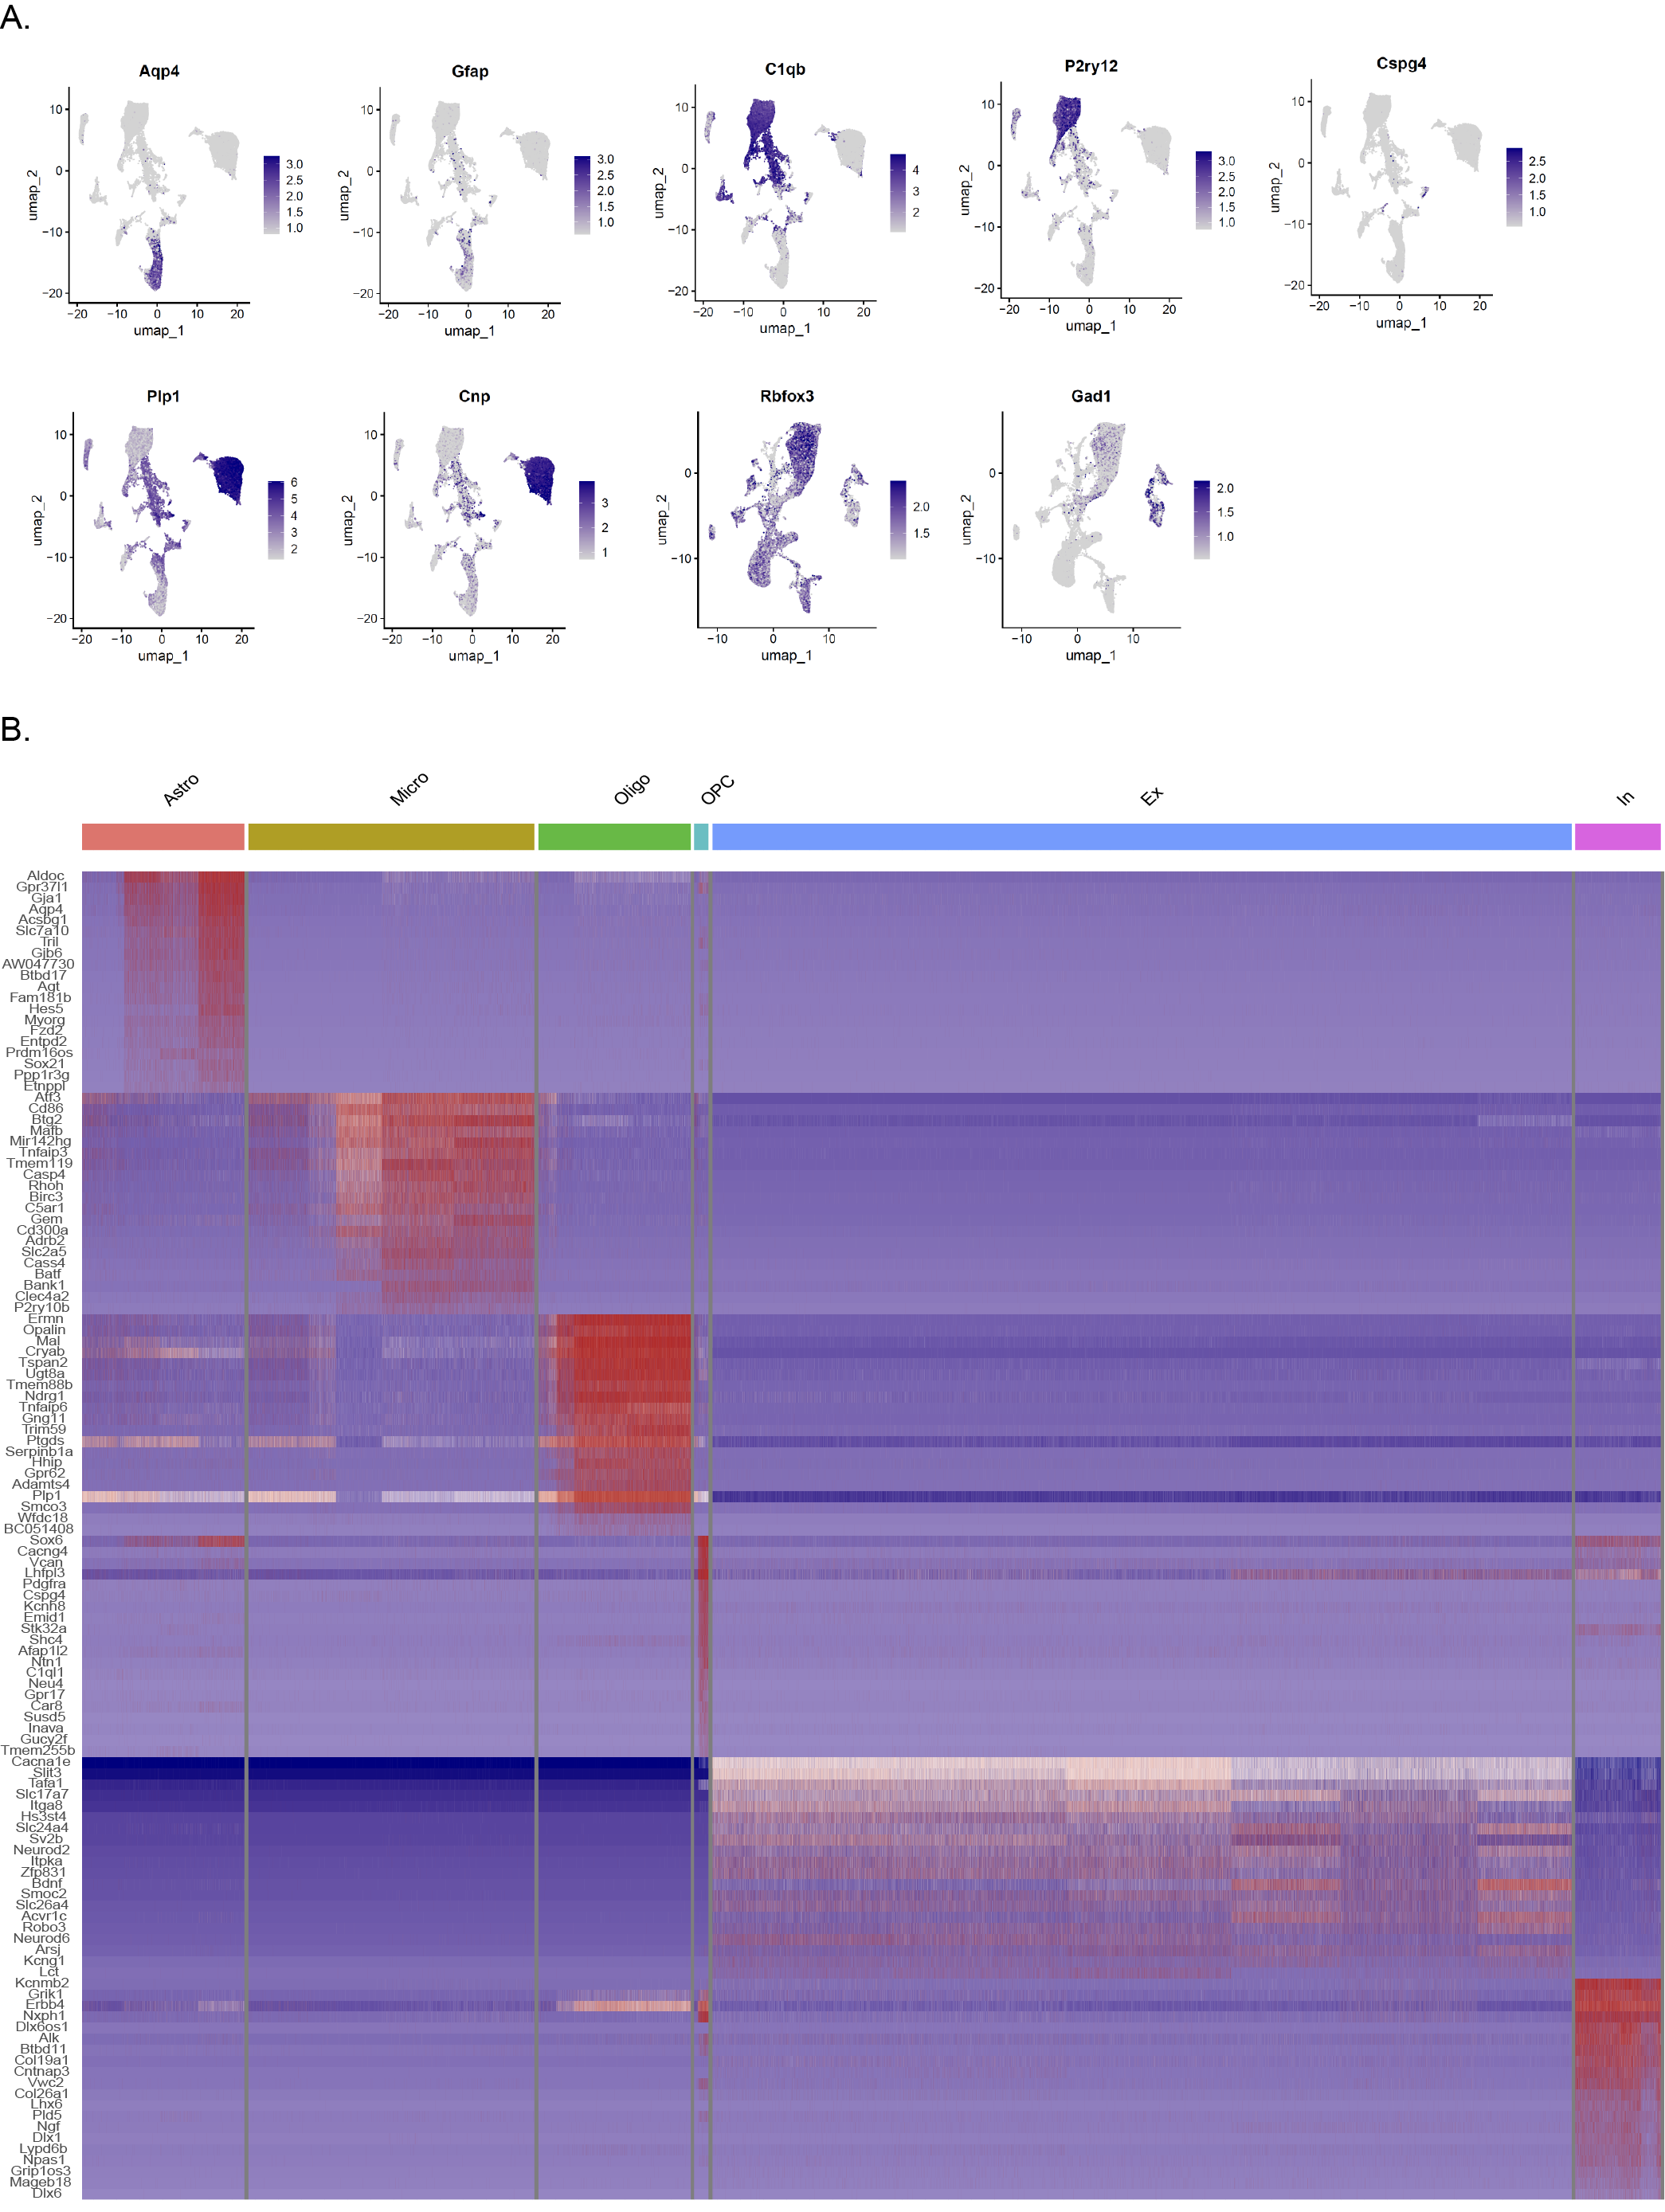
Six mice that developed significant status epilepticus (SE) following KA CA1 injection were selected for this study. The hippocampi of three mice with TLE and three control mice were subjected to ScRNA-seq analysis, while the hippocampi of another set of three mice with TLE and three control mice were subjected to SnRNA-seq analysis. This investigation yielded transcriptomic data from a total of 47,573 single cells and 69,239 single nuclei. Following dimensionality reduction and clustering using the UMAP algorithm, we selected 31,390 glial cells and 48,221 neuronal cell nuclei for further analysis (Fig. 2E). The cell type distributions in the control and TLE groups were as follows: 5949 oligodendrocytes, 465 oligodendrocyte precursor cells (OPCs), 7809 microglia, 6133 astrocytes, 26509 excitatory neurons (EXNs) and 2910 inhibitory neurons (INNs) in the control group and 1810 oligodendrocytes, 245 OPCs, 6820 microglia, 2159 astrocytes, 17378 EXNs and 1424 INNs in the TLE group (Fig. 2F, Table S1). The following cell types were identified based on their specific marker genes (Fig. 2G): astrocytes (Aqp4, Slc1a2, Gfap), microglia (C1qb, Tmem119, P2ry12), oligodendrocytes (Mbp, Plp1, Cnp), OPCs (Tnr, Cspg4), EXNs (Rbfox3, Slc17a7), and INNs (Gad1, Gad2). UMAP plots were used to visualize the overall distribution of cells in both the TLE and control groups as well as the distribution of each cell type across the entire dataset (Fig. 2A-D). Additionally, we analysed the distributions of different marker genes within the overall sample set (Fig. 2I-J, FIG. S1A). Gene expression heatmaps were further generated to visualize significant transcriptional differences between various cell types (Fig. 2H; the full version is available in FIG. S1B).
3.2 Transcriptomic Alterations in Mouse Hippocampal Glial Cells and Neurons Following KA-Induced TLE
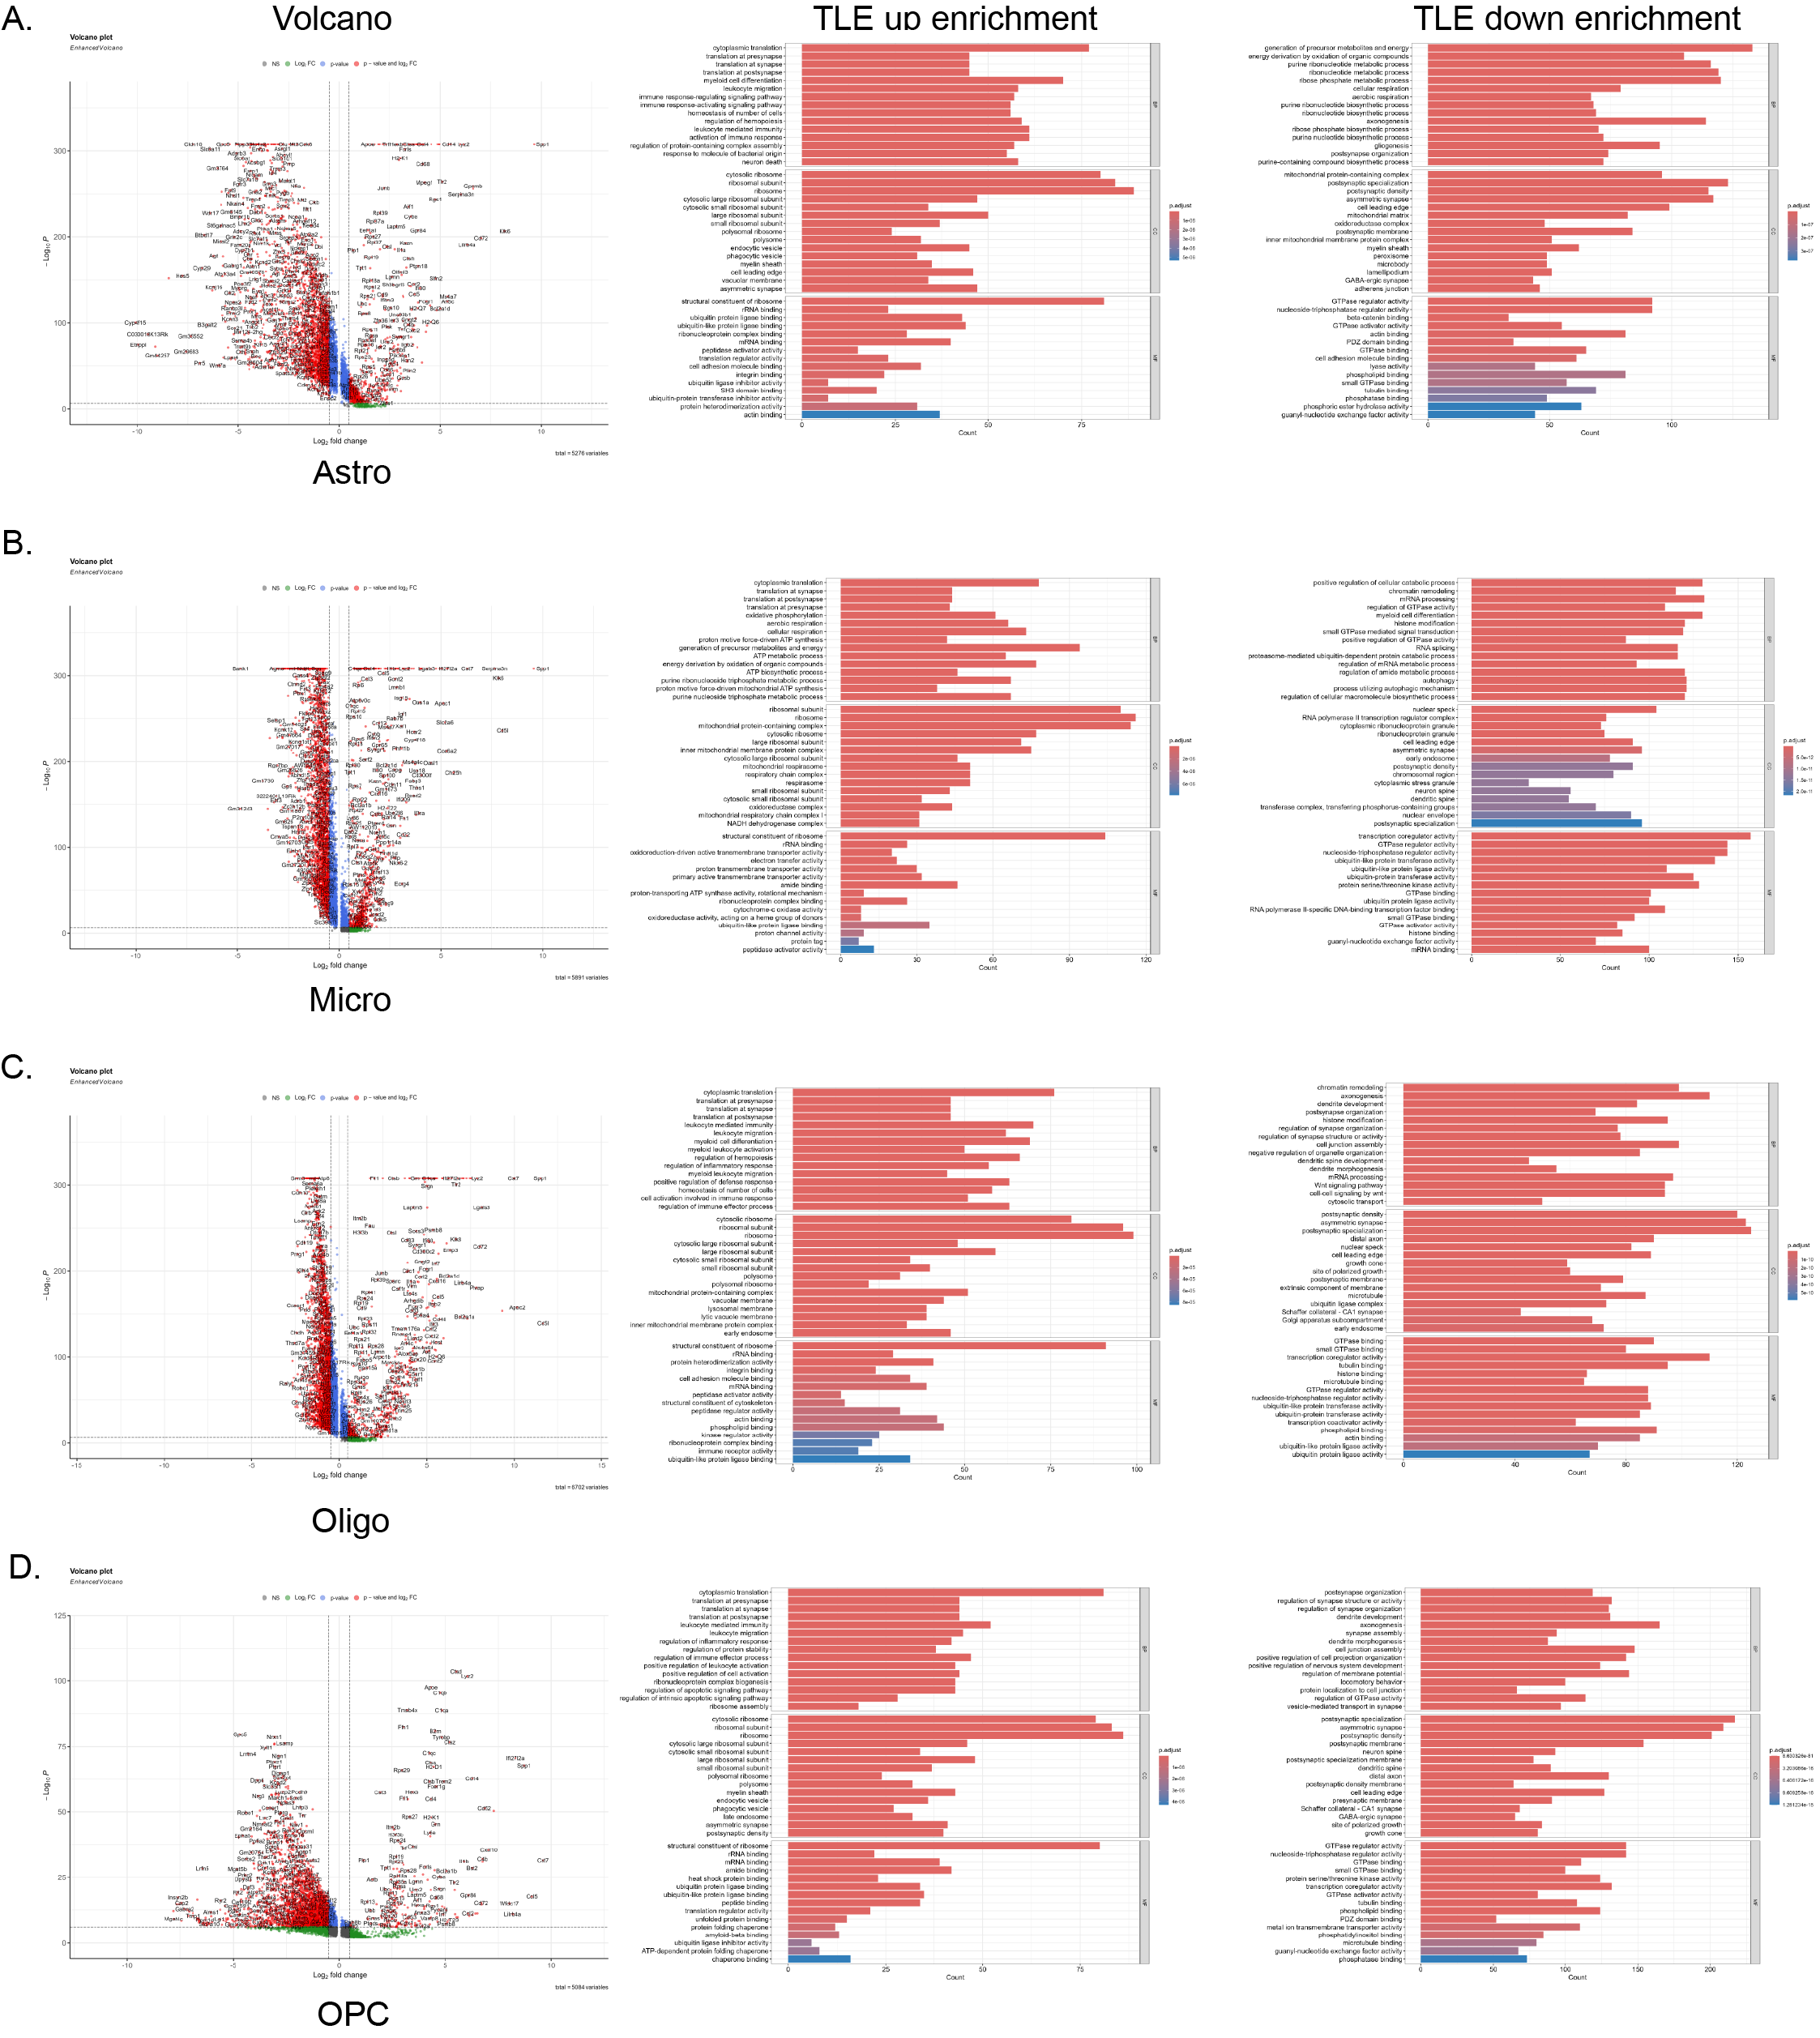
Following KA-induced seizures, hippocampal glial cells in the mice exhibited profound transcriptional dysregulation leading to a widespread and intense stress response. Specifically, the expression levels of 834 genes, including Spp1, Cd5l, Gpnmb, Cst7, Serpina3n, and Apoc2, were elevated (p < 0.05 and Log2FC > 0.5) (Fig. 3A-B, Table S2). Conversely, 2939 genes, including Slc6a11, Cldn10, Wdr17, Btbd17, Agt, and Slc4a4, exhibited reduced expression. GO enrichment analysis of these DEGs revealed that those with elevated expression in glial cells from mice with TLE exhibited enrichment predominantly in pathways related to translation at the synapse, leukocyte-mediated activity, phagocytic vesicles, and immune receptor activity. In contrast, the genes with decreased expression were associated primarily with axonogenesis, dendrite development, neuron spine formation, and tubulin binding pathways. These findings suggest significant activation of immune- and inflammation-related pathways in glial cells, accompanied by widespread loss of supportive functions for neurons (Fig. 3C). Analysis of specific glial cell types further revealed that in mice with TLE, astrocytes exhibited upregulation of 830 genes and downregulation of 2538 genes, microglia showed upregulation of 845 genes and downregulation of 2790 genes, oligodendrocytes exhibited upregulation of 889 genes and downregulation of 2603 genes, and OPCs displayed upregulation of 234 genes and downregulation of 2735 genes. The expression of proinflammatory genes, such as Spp1, Lyz2, and Cd14, was increased in each glial cell type, indicating intense inflammatory activation. Enrichment analysis also indicated the activation of inflammatory pathways and a reduction in or complete loss of neurosupportive capacity across these glial cells (Fig. 3D-G, FIG. S2A-D, Tables S3-6).
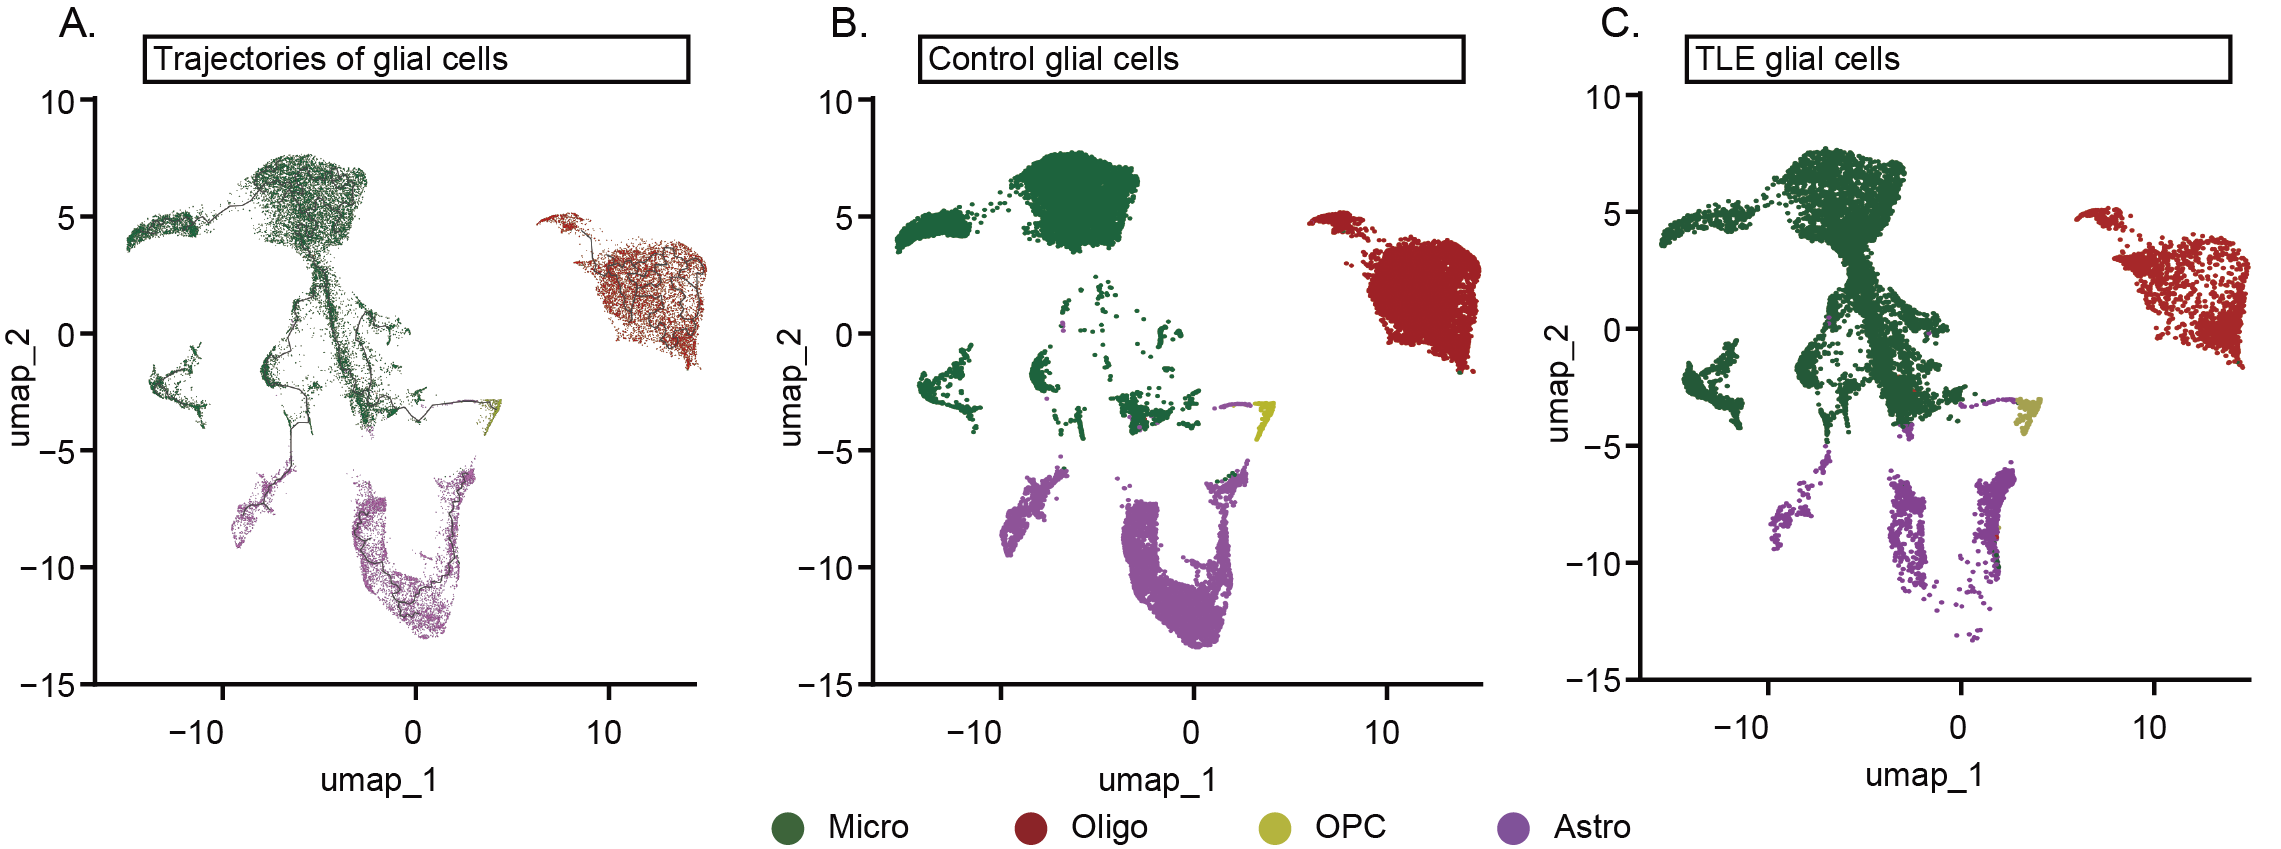
To determine the intrinsic heterogeneity driving glial cells towards this proinflammatory transition, pseudotime analysis was performed. The results showed a stark contrast in the distribution of glial cells between the TLE and control groups on the UMAP plots. Glial cells from the control group were located predominantly at the starting points of trajectories, while glial cells from the TLE groups were concentrated at the endpoints, displaying centripetal convergence on the UMAP plots (FIG. S3A-C). This pattern indicates that the extensive inflammatory phenotypic transformation is accompanied by increased transcriptional homogeneity among various glial cells. However, whether this transition is driven primarily by intrinsic mechanisms or intercellular interactions remains unclear.
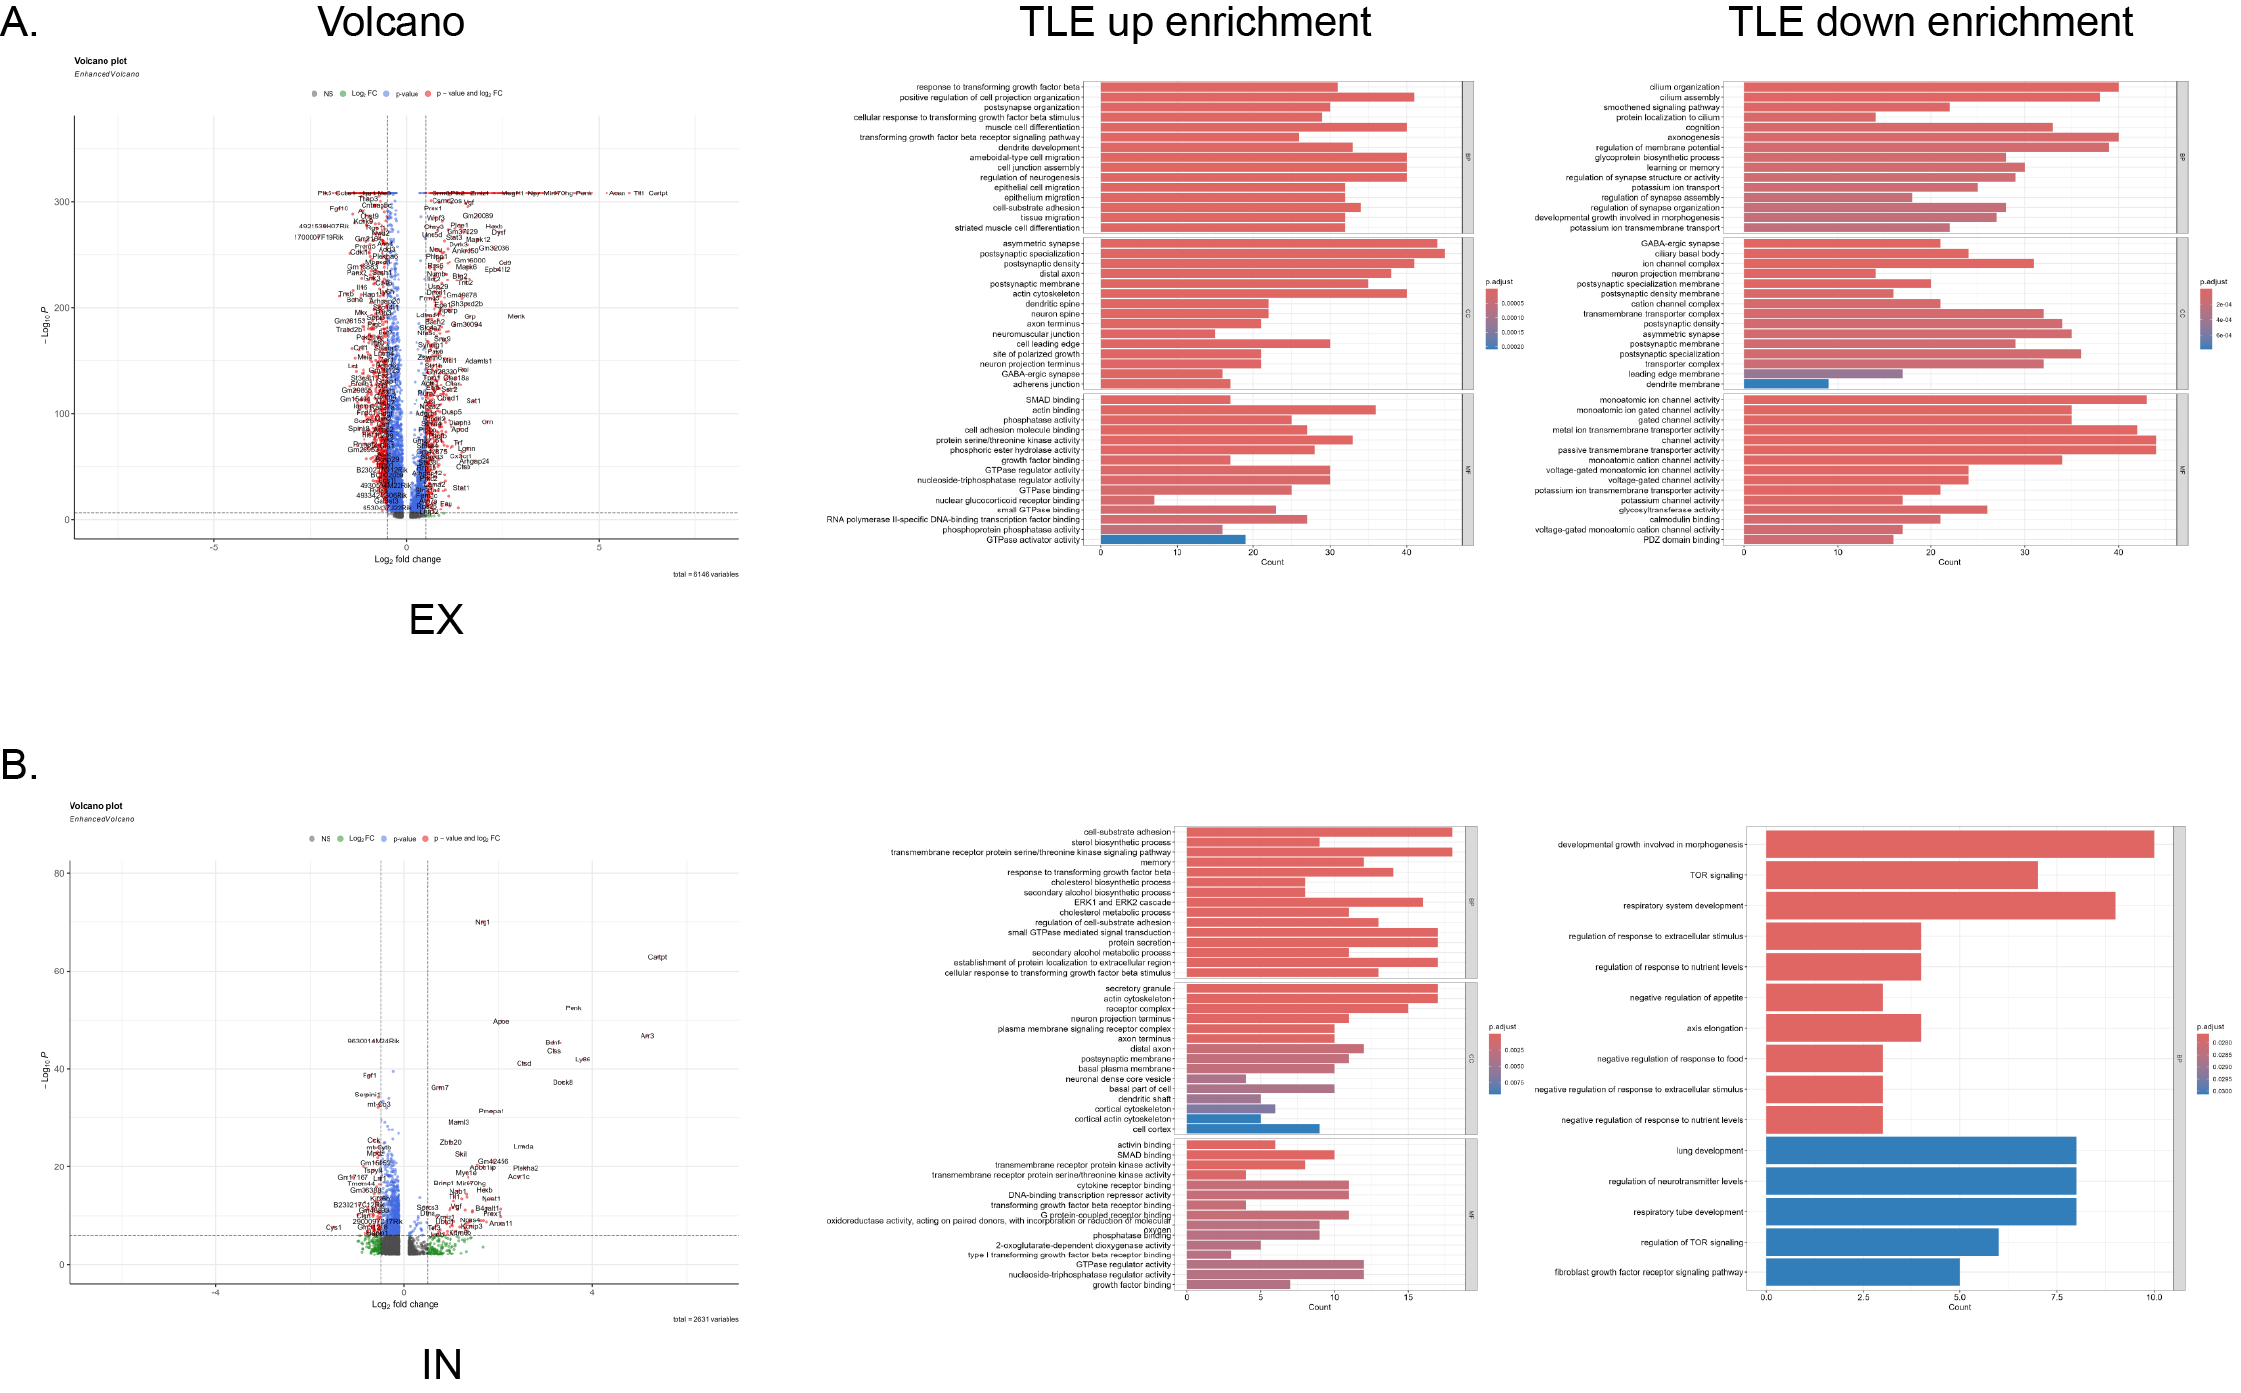
Due to limitations in obtaining neuronal transcriptomic data solely via ScRNA-seq, we performed SnRNA-seq on hippocampal tissues from the same batch of mice. Differential gene expression analysis of all neurons revealed elevated expression of 671 genes (identified by p < 0.05 and Log2FC > 0.5), including Cartpt, Acan, Tll1, Ly86, Pappa, and Gm50430 (Fig. 4A-B, Table S7), and reduced expression of 942 genes, including Plk5, Ntf3, Vwa3a, Cys1, Igfbp5, and Fgf10. GO enrichment analysis indicated that the genes with elevated expression in neurons from the TLE group exhibited significant enrichment in pathways such as postsynapse organization, regulation of neurogenesis, asymmetric synapse formation, and phosphate activity. In contrast, the downregulated genes exhibited enrichment in synapse assembly, axonogenesis, GABAergic synapse formation, and voltage-gated potassium channel activity. Then, we analysed specific neuronal cell types, finding 723 upregulated and 1052 downregulated genes in EXNs and 91 upregulated and 103 downregulated genes in INNs. The primary DEGs for each neuronal cell type are detailed in Fig. 4D-E, FIG. S4A-B, and Tables S8-9.
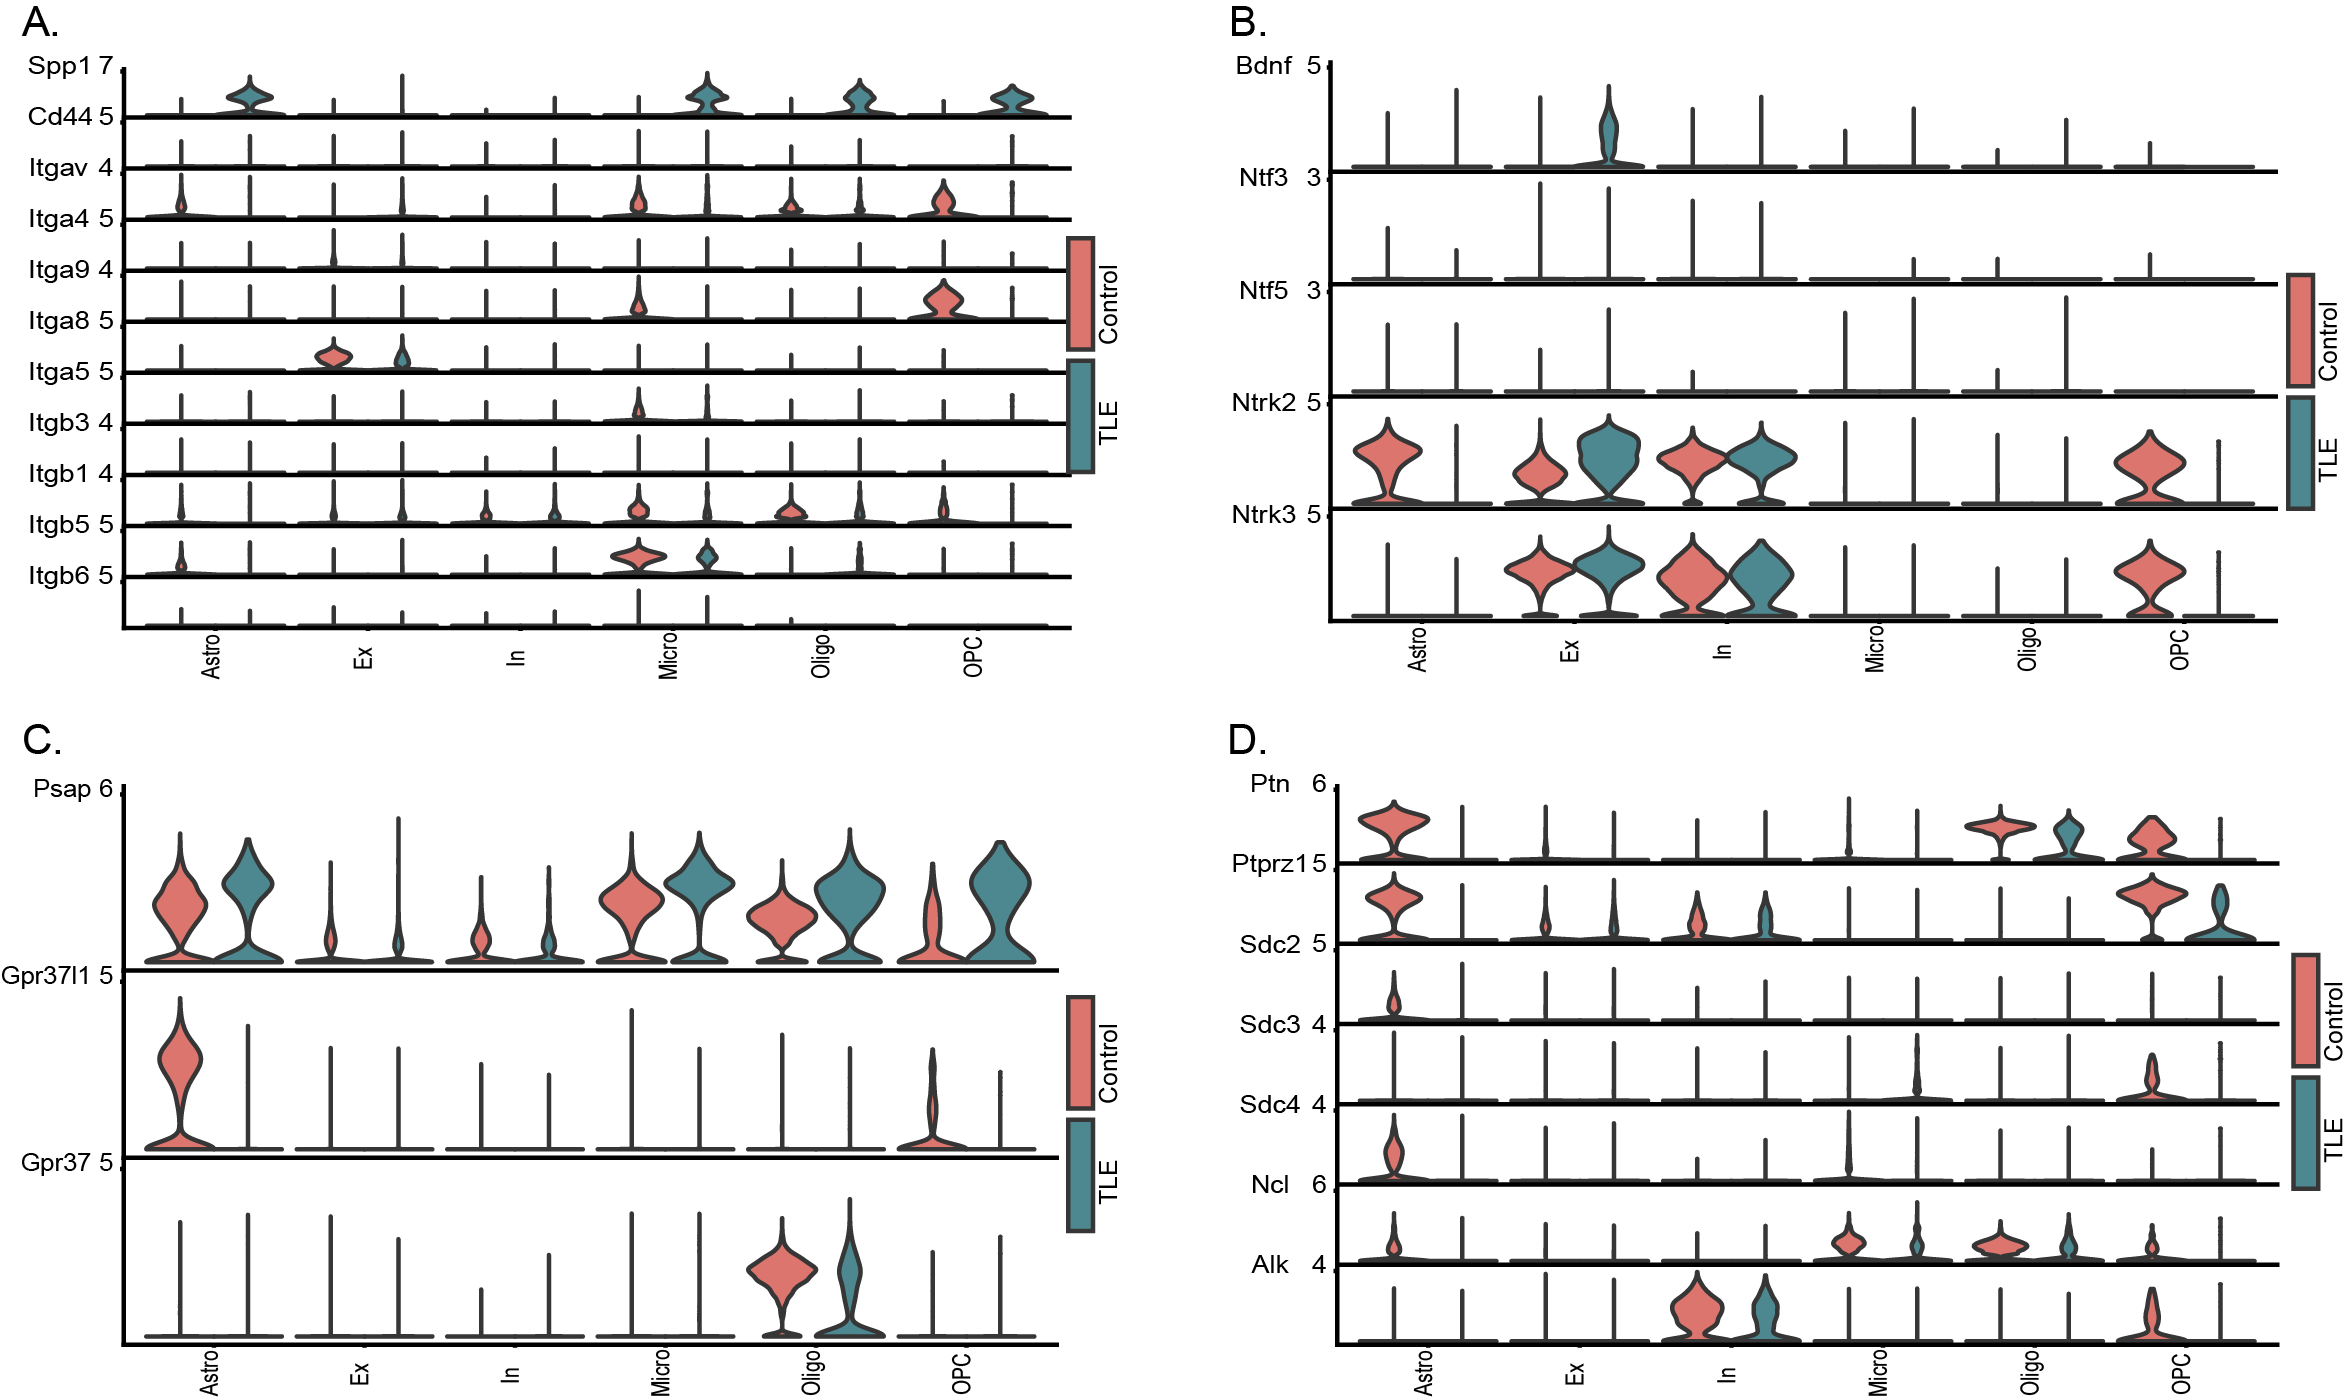
3.3 Cellular Communication Analysis Based on Glial and Neuronal Transcriptomic Data
Based on the results of transcriptomic analysis of glial cells and neurons, we performed a cellular communication analysis using the CellChat package. By integrating the transcriptomic data of neurons and glial cells, we evaluated the mRNA levels of numerous cytokines and their receptors across various cell types. We specifically detailed the cytokine–receptor pairs that showed significant changes in the TLE group. Notably, hippocampal EXNs and microglia, followed by oligodendrocytes and microglia, exhibited the most significant changes in the number of interactions (Fig. 5A). Although the number of altered interactions among neurons (between EXNs and INNs or among EXNs themselves) was lower than that among glial cells, these interactions showed the greatest changes in strength (Fig. 5B). Next, we analysed the specific signalling pathways enriched in these altered cellular interactions and their differences between the control and TLE groups. In the TLE group, the intercellular interaction pathways with the most significant increases in communication strength were the Spp1 and NT pathways, whereas the PTN and PASP pathways exhibited the most significant decreases in communication strength (Fig. 5C-D). The communication strength of the Spp1 pathway, which was significantly increased in the TLE group, was particularly notable. This pathway was almost completely inactive in the hippocampus in the control group but became highly active post-seizure, with various cells acting as both senders and receivers, thus forming an intricate network of interactions among different glial cells and EXNs (Fig. 5E, FIG. S5A). Similarly, the activity of the NT pathway, which is composed primarily of BDNF and its receptors and downstream genes, was increased. The upstream mediator BDNF was expressed mainly in EXNs in the TLE group, while its receptors were distributed predominantly among INNs and EXNs (Fig. 5F, FIG. S5B). Conversely, the Psap and Ptn pathways presented a more complex interaction profile but were generally suppressed in the TLE group, with simplified interaction networks. Specifically, a significant decrease in receptor levels in the Psap pathway was observed in the TLE group, while the decrease in Ptn pathway activity was mediated mainly by the almost complete loss of Ptn expression in astrocytes and OPCs (Fig. 5G-H, FIG. S5C-D). In summary, the intercellular interactions within the hippocampi of mice with TLE exhibited alterations consistent with the transcriptomic alterations. These changes may indicate a shift in glial cell function from providing support to promoting damage, possibly driven by overactive interactions among neurons and leading to excessive synchronization.
3.4 Xenium-Based Spatial Transcriptomic Analysis of TLE and Control Mouse Brain Sections
The KA CA1 injection-induced seizure model is a model of focal epilepsy. However, neither the ScRNA-seq data of glial cells nor the SnRNA-seq data of neurons can be used to elucidate the spatial distribution and cellular localization of mRNA transcripts within the damaged and relatively normal regions of the TLE hippocampus. To address this limitation, we performed Xenium-based spatial transcriptomic sequencing on two paraffin-embedded coronal sections containing the dorsal hippocampus (one from the TLE group and one from the control group). We detected a total of 245925 spots (131833 from TLE slice and 114092 from Control slice), and by this approach we determined the expression levels of all 247 genes in the mouse brain panel across all 5-µm spots.
Based on the spatial clustering results for these genes, we reconstructed the somatic presence of 27 cell types and delineated their spatial distribution features across both entire sections and specific hippocampal regions in the TLE and control groups (Fig. 6A). We designated regions of interest (ROIs) in the KA-injected epileptic hippocampus and the control hippocampus for further analysis. Within these ROIs, all 27 cell types were reconstructed, but the cellular composition shifted dramatically, showing significant morphological differences and transcriptomic heterogeneity between the TLE and control hippocampi (Fig. 6B, Table S11). Additionally, we performed dimensionality reduction clustering based on the gene expression levels of each somatic cell body and visualized the distribution in a UMAP plot (Fig. 6C).
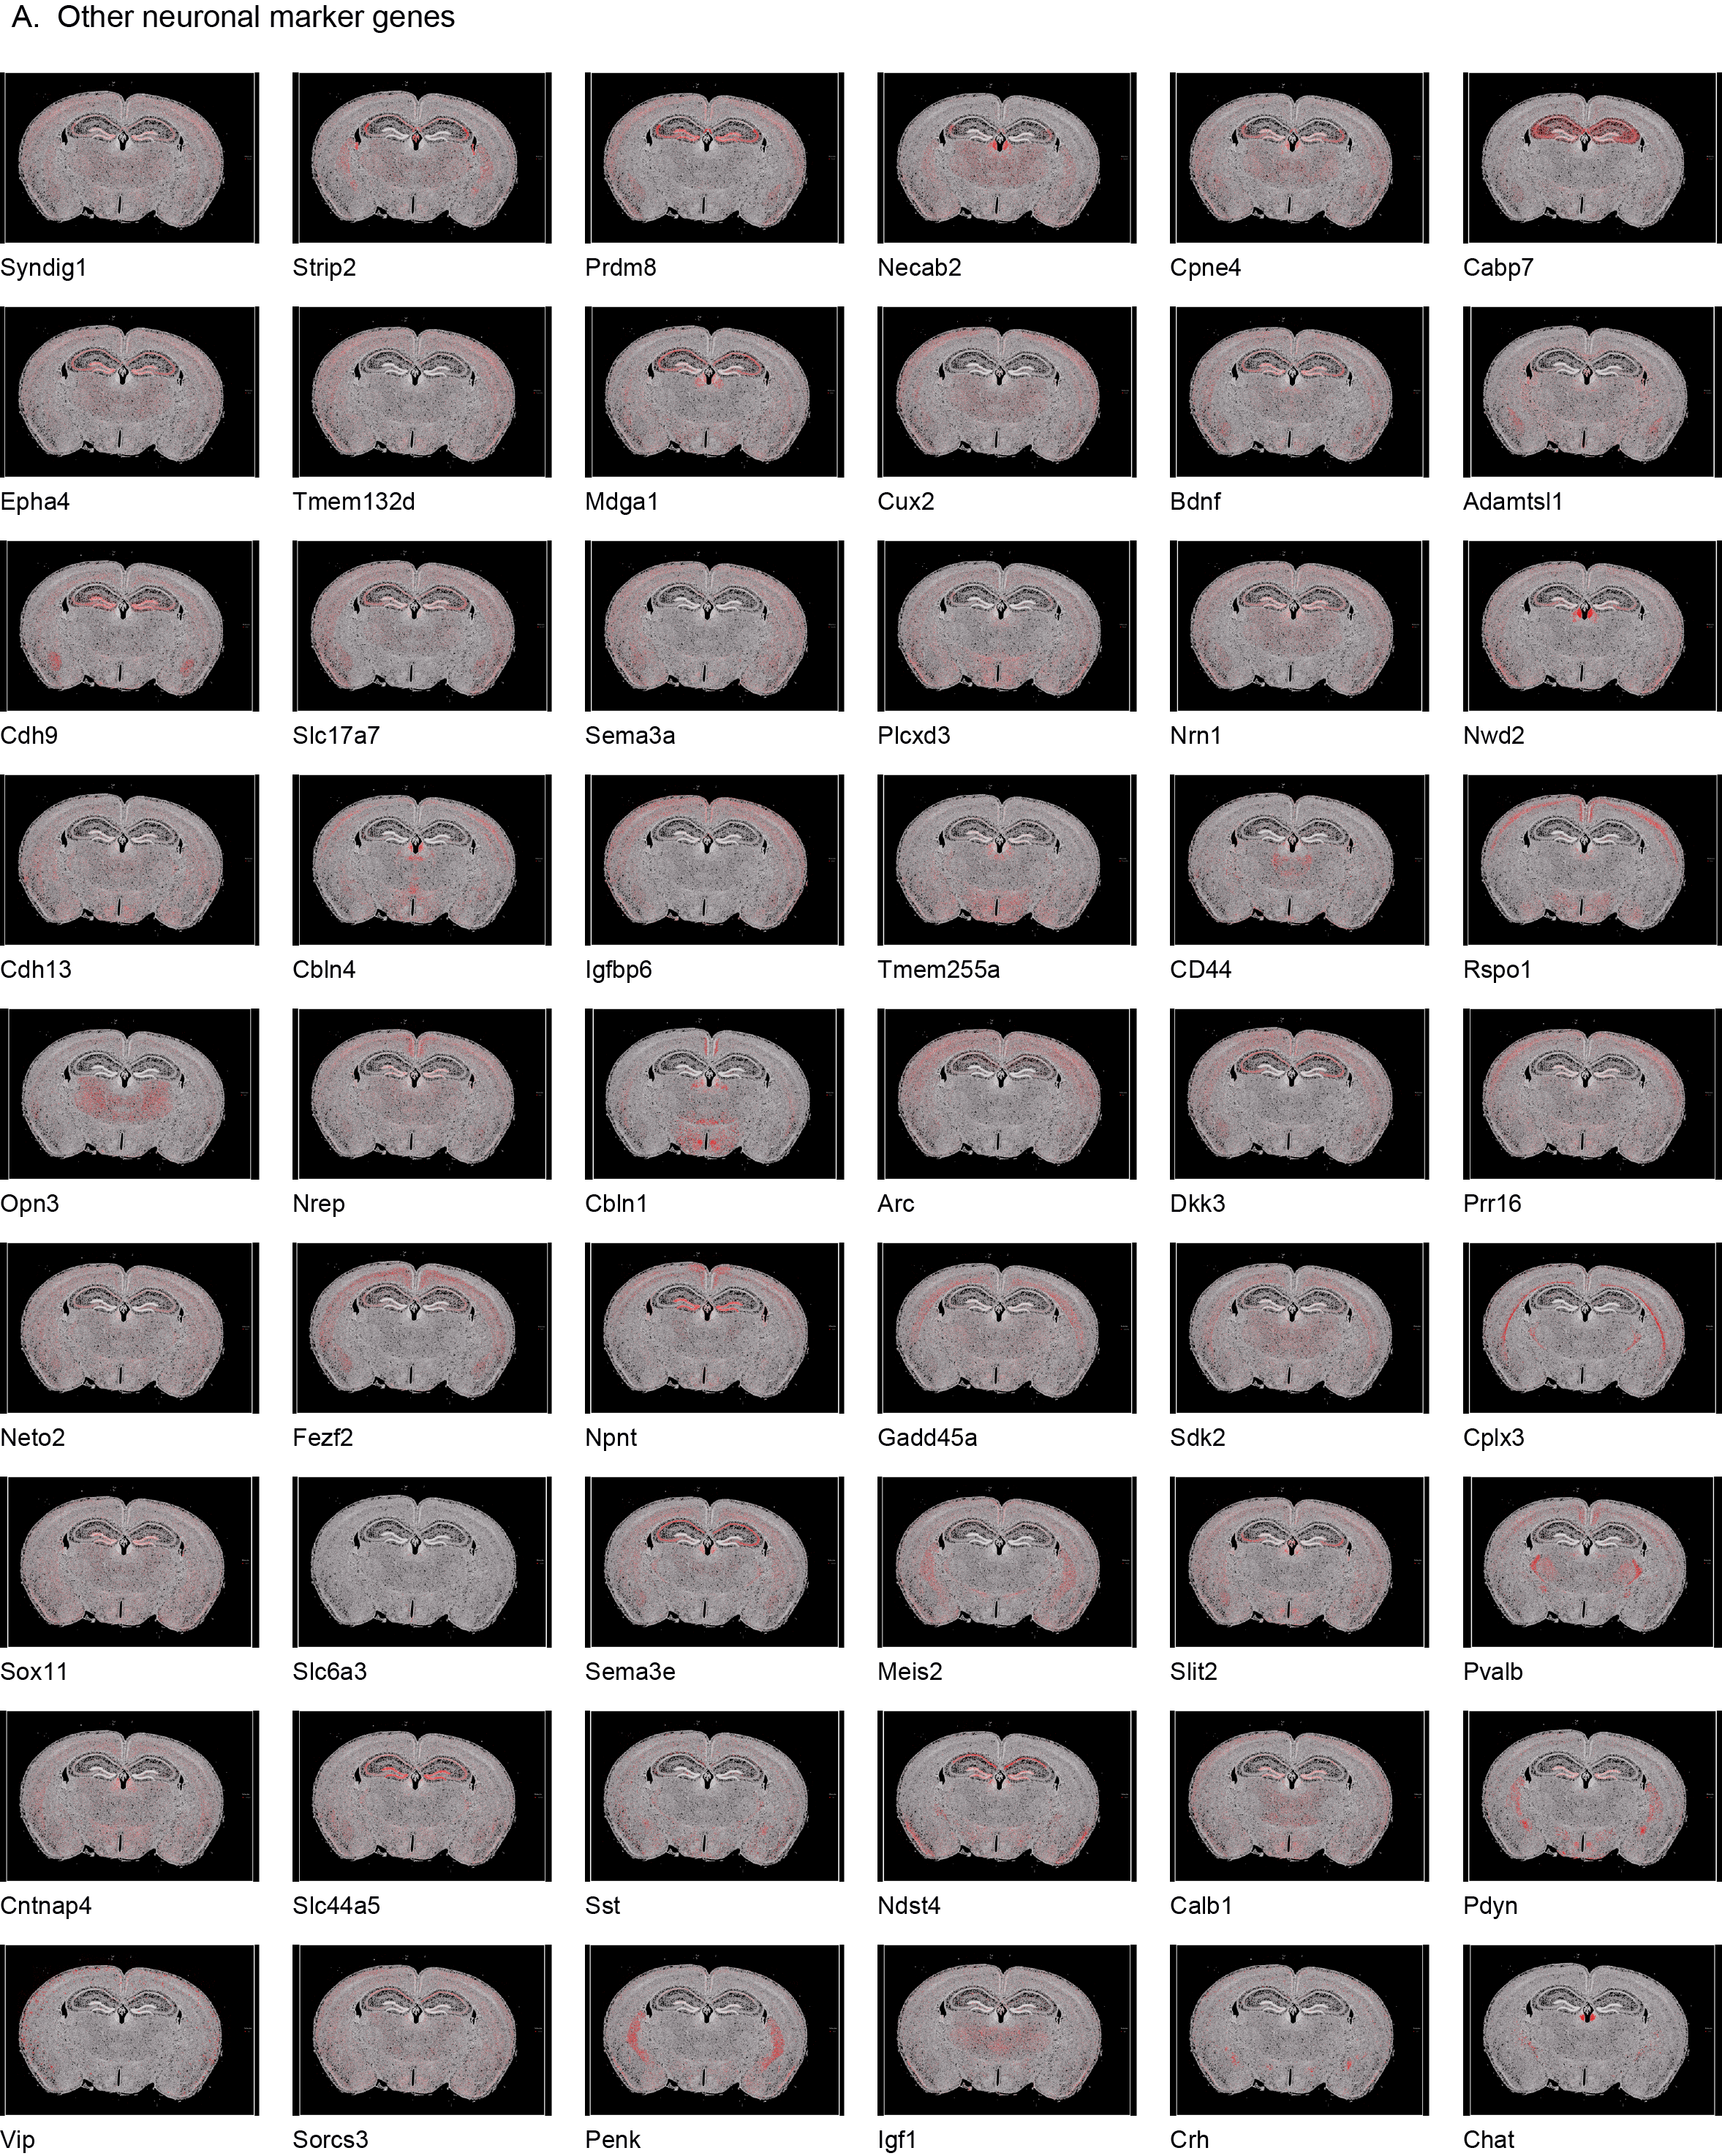
In the control mouse brain section, we demonstrated the high-resolution spatial distributions of different marker genes used to define the primary cell types (Fig. 6D-I): astrocytes (Slc39a12, Gfap, Aqp4, Mapk4), microglia (Cd68, Trem2, Cd53, Cd300c2), oligodendrocytes (Sox10, Sema6a, Opalin, Gjc3), CA1 pyramidal neurons (Wfs1, Sipa1l3, Fibcd1, Arhgap12), dentate granule cells (Prox1, Tanc1, Rasl10a, Orial2), and CA3 pyramidal neurons (NPY2r, Neurod6, Nrp2, Cpne6). The detailed spatial expression profiles of other marker genes (e.g., Syndig1 and Strip2) are provided in FIG. S6.
We then compared the genes exhibiting significant changes in the TLE hippocampus within the Xenium ROIs. The spatial variation in mRNA expression in the Xenium data was significantly more pronounced than that in the ScRNA-seq and SnRNA-seq data. We listed the top 28 genes with increased expression and the top 40 genes with decreased expression (identified by p < 0.01 and Log2FC > 20) (Fig. 7A). The main genes with increased expression included Gfap, Aqp4, Laptm5, Spp1, and Cd68, while those with decreased expression included Cpne6, Slc17a7, Neurod6, Rab3b, and Epha4 (Fig. 7A-B).
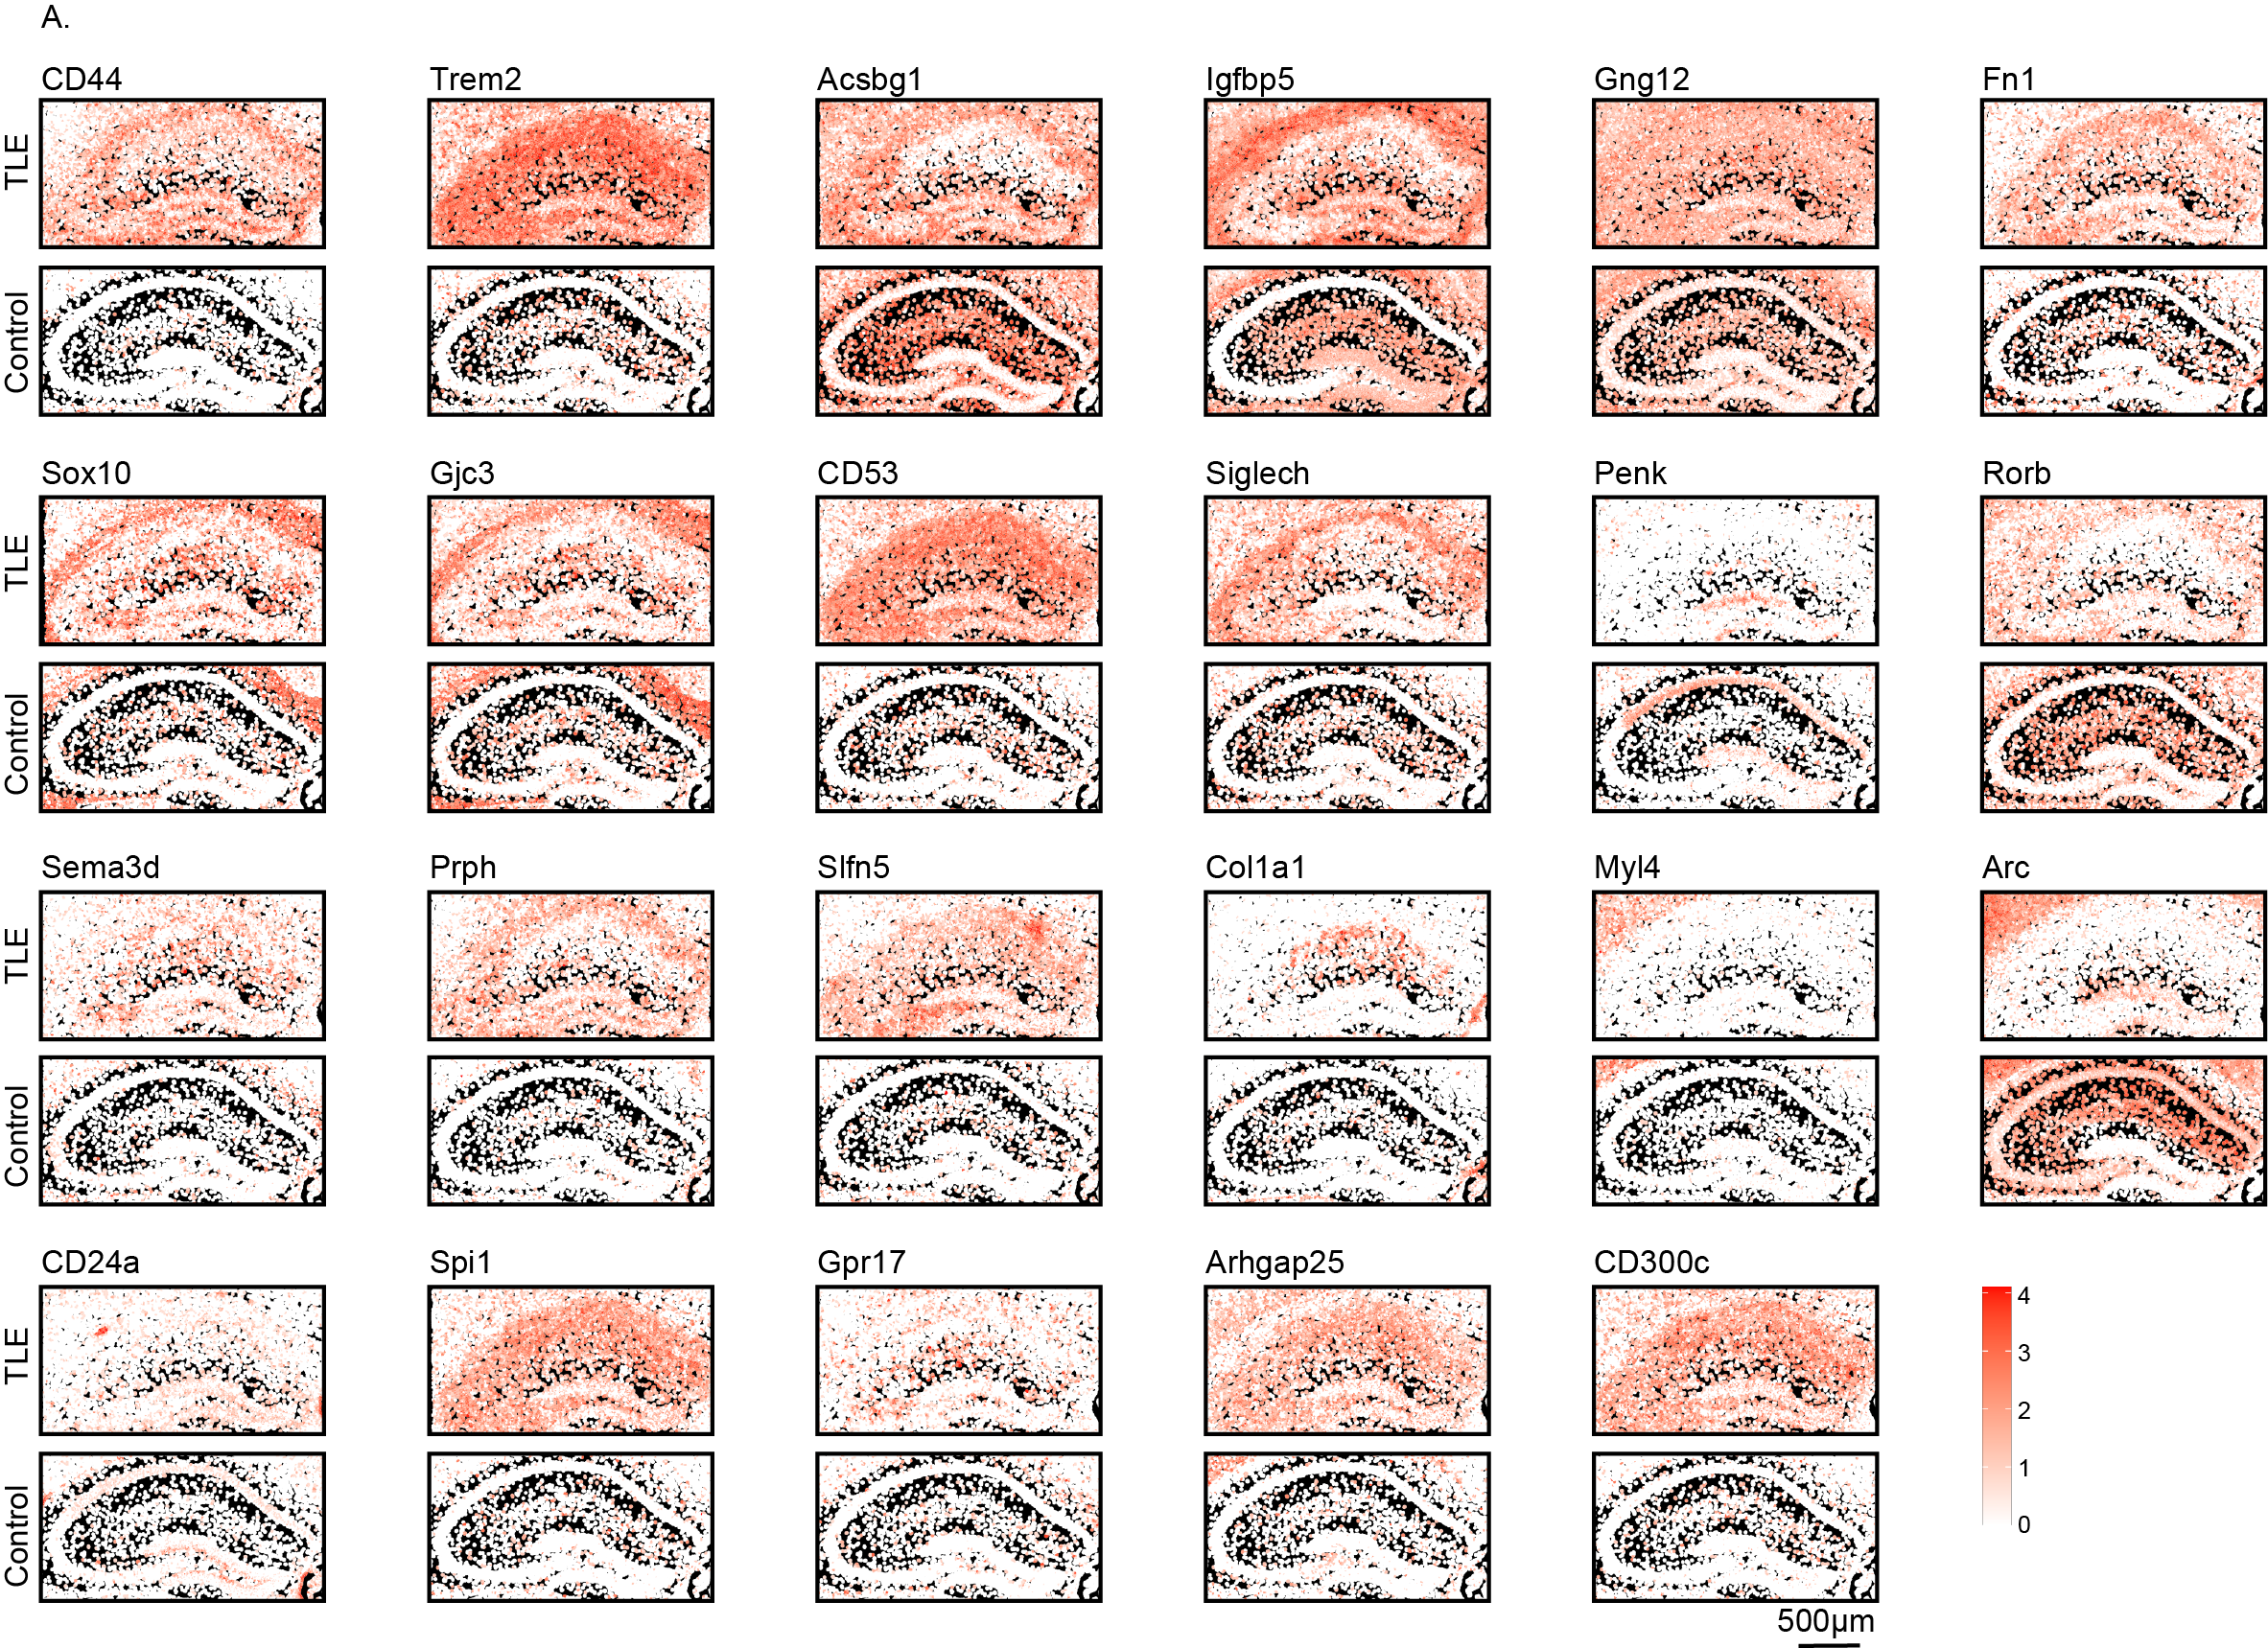
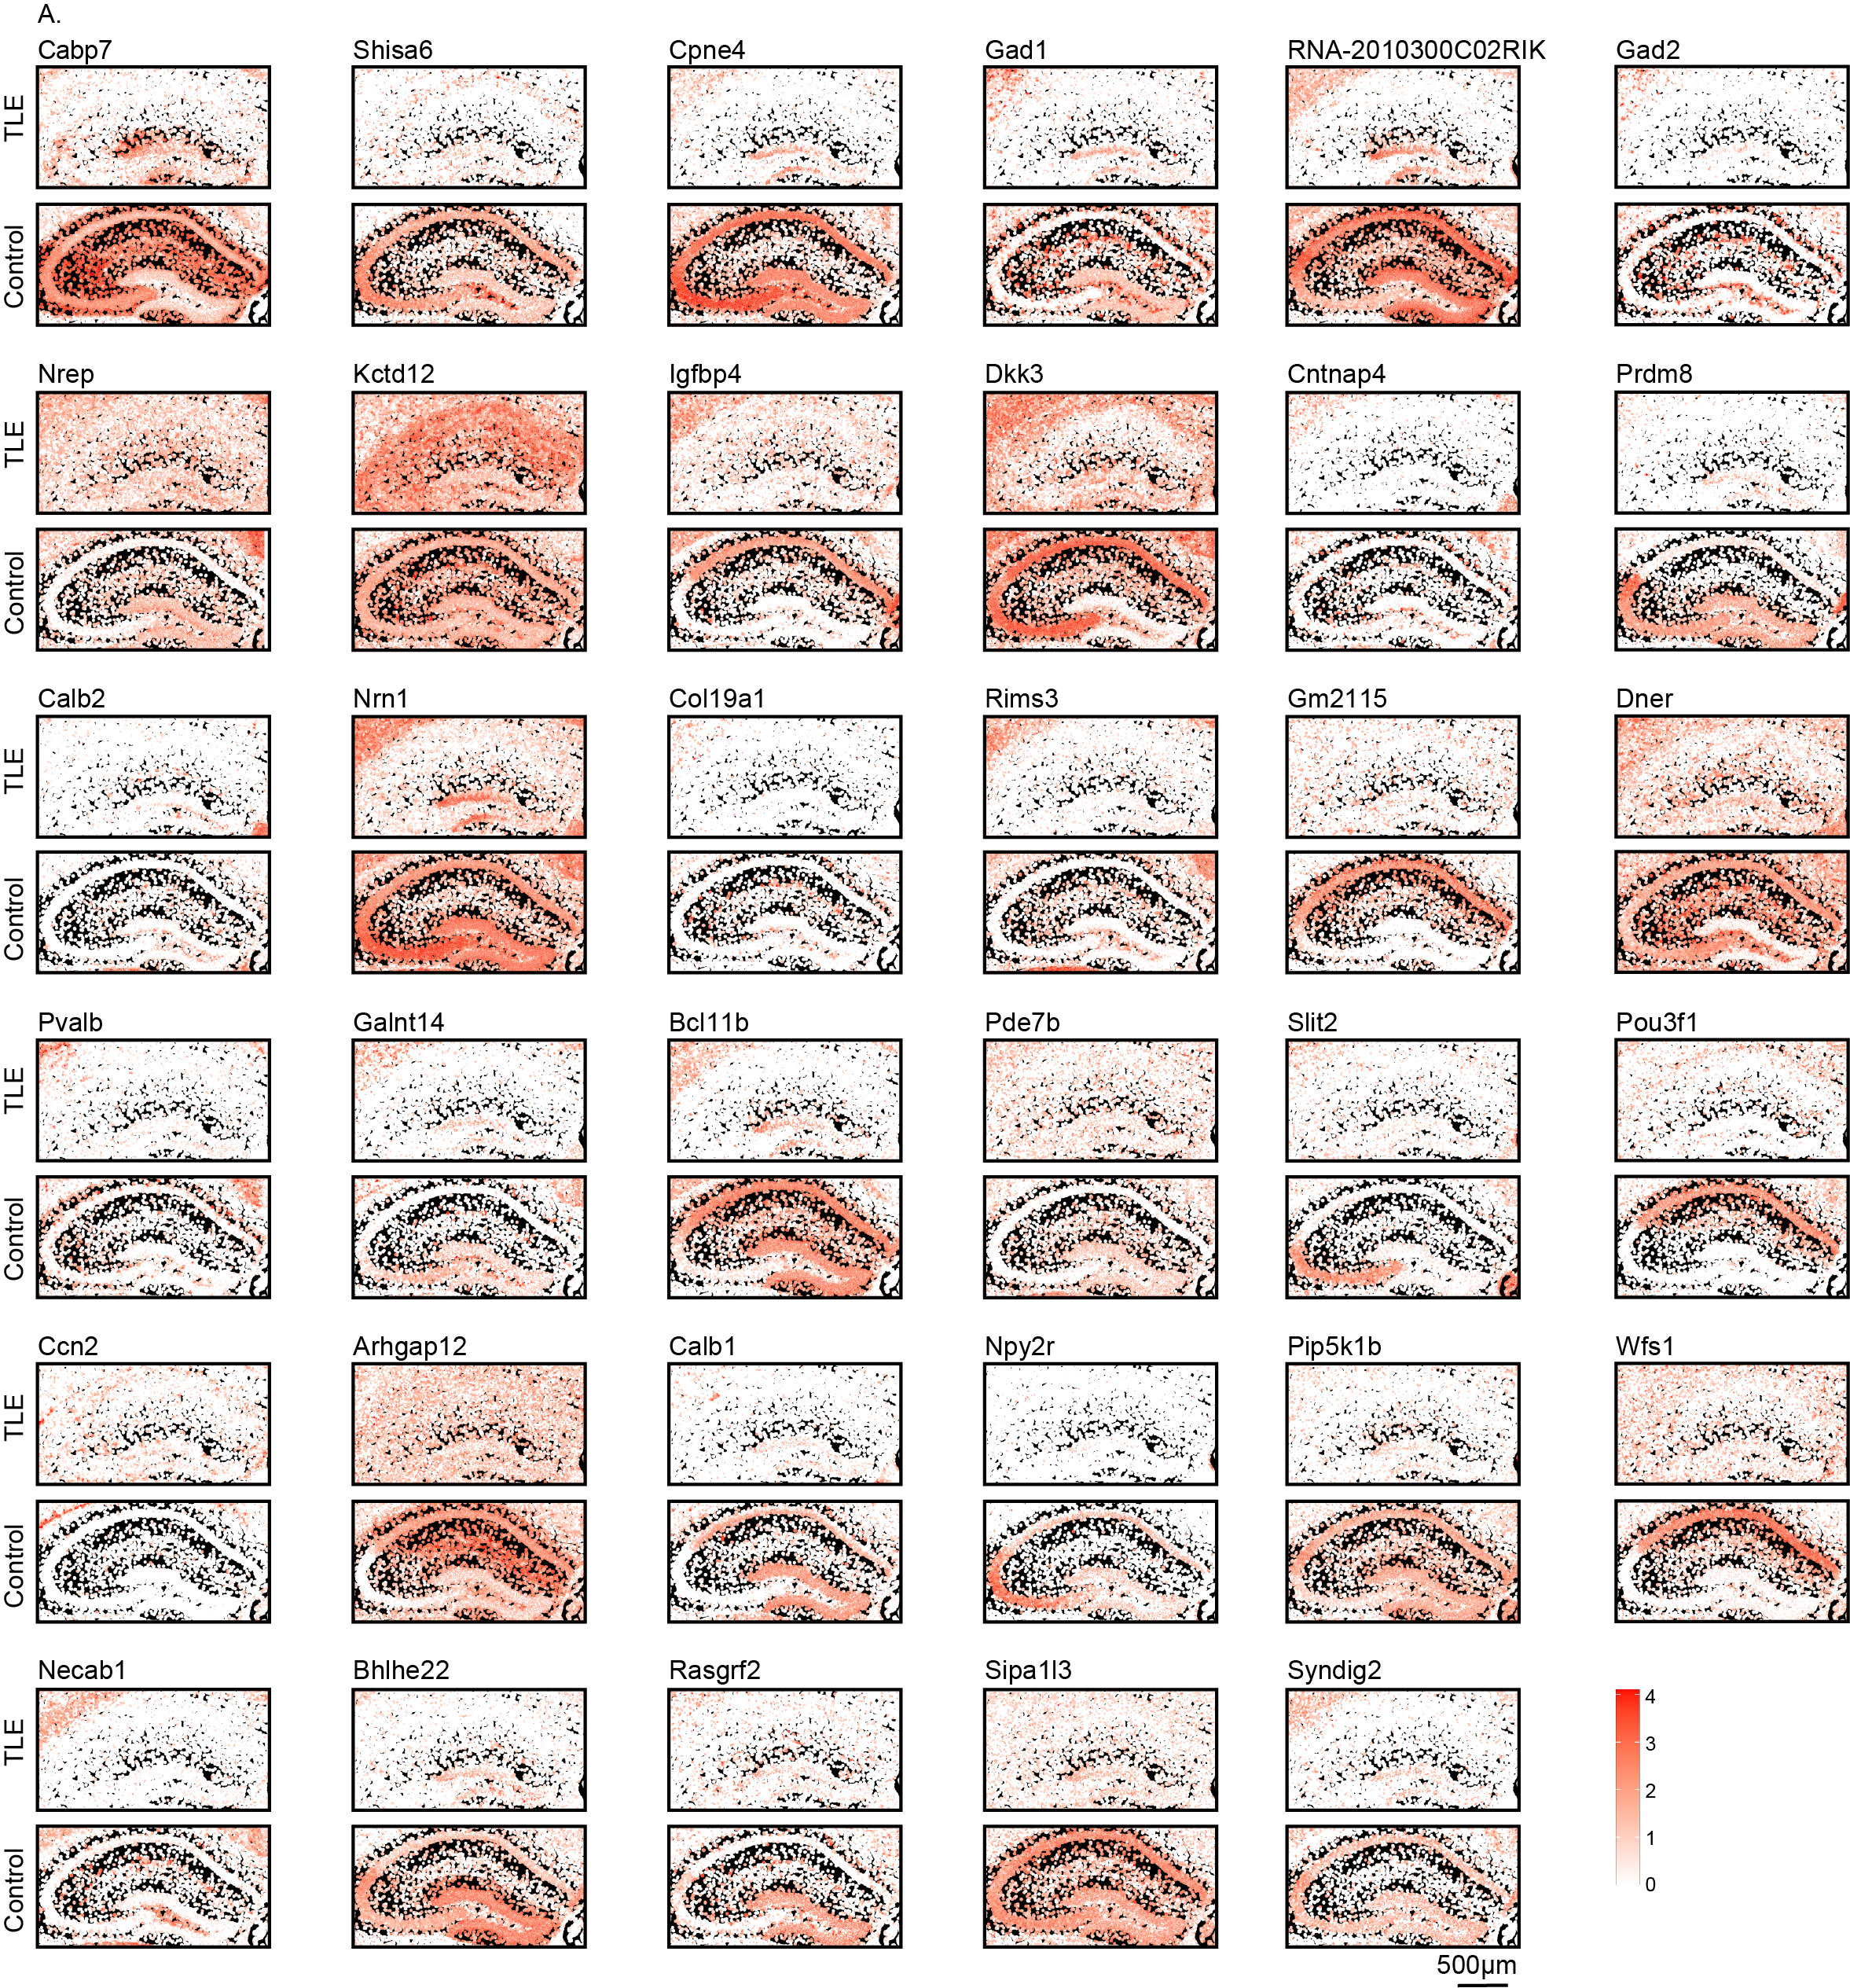
Enrichment analysis based on these genes indicated the activation of pathways such as positive regulation of leukocyte differentiation and astrocyte projection in the TLE hippocampus, consistent with the reactive changes in microglia and astrocytes. Conversely, pathways such as axonogenesis, neuron projection terminus, and synaptic vesicle function were inhibited. To visually compare the differential gene expression between the TLE and control hippocampi, we generated high-resolution spatial maps of these DEGs across various subregions of the hippocampus in both groups (Fig. 7D-E, FIG. S7-S8). The DEGs enriched in glial cells exhibited obvious diffuse intergroup differences across the entire hippocampus, whereas the genes enriched in neurons displayed comparatively spatially specific alterations within different hippocampal subregions. These genes could thus be significantly associated with reactive glial proliferation and neuronal reduction.
3.5 Integrated Differential Analysis of Xenium, ScRNA-seq, and SnRNA-seq Data
The DEGs identified in the Xenium data could not be used for true spatial single-cell mapping. Therefore, we examined the expression distribution of the DEGs identified in the Xenium data across various cell types based on the ScRNA-seq and SnRNA-seq data (FIG. 8A, FIG. 9A). The 28 upregulated genes were primarily distributed among different types of glial cells, whereas the 40 downregulated genes were expressed found in neurons. However, many genes exhibited expression trends different from those in the Xenium data.
To identify key changes in the hippocampus of mice with TLE, we integrated data from the Xenium, ScRNA-seq, and SnRNA-seq analyses to compare the common and unique DEGs across different cell types and spatial transcriptomes (criteria: p < 0.05 and Log2FC > 0.5). Analysis of these data in conjunction with glial cell types revealed that 57 genes were uniquely upregulated in the Xenium data, 821 genes were uniquely upregulated in glial cells, and 13 genes were upregulated in both the Xenium data and glial cells. Further classification of glial cells indicated that 50 genes were uniquely upregulated in the Xenium data, whereas 353, 436, 357, and 8 genes were uniquely upregulated in astrocytes, microglia, oligodendrocytes, and OPCs, respectively. Additionally, 153 genes were upregulated in all four glial cell types, with only Spp1, Trem2, and Cd68 upregulated in both the Xenium data and the four types of glial cells (Fig. 8B-C).
By integrating the spatial transcriptomic data with sequencing data from neurons, we found that 64 genes were uniquely upregulated in the Xenium data, 665 genes were uniquely upregulated in neurons, and 6 genes were upregulated in both the Xenium data and neurons. Further classification of neurons revealed that 64 genes were uniquely upregulated in the Xenium data, whereas 643 and 14 genes were uniquely upregulated in EXNs and INNs, respectively. Additionally, 74 genes were upregulated in both neuron subtypes, with only Penk, Sorcs3, and Plekha2 upregulated in both the Xenium data and these two neuron subtypes (FIG. 8D-E). The specificity of the downregulated genes in the hippocampus of mice with TLE is shown in FIG. 9. According to our analysis, only Tle4 and Sipa1l3 were downregulated in both the Xenium data and all four types of glial cells, and no genes were downregulated in both the Xenium data and the two neuron subsets.