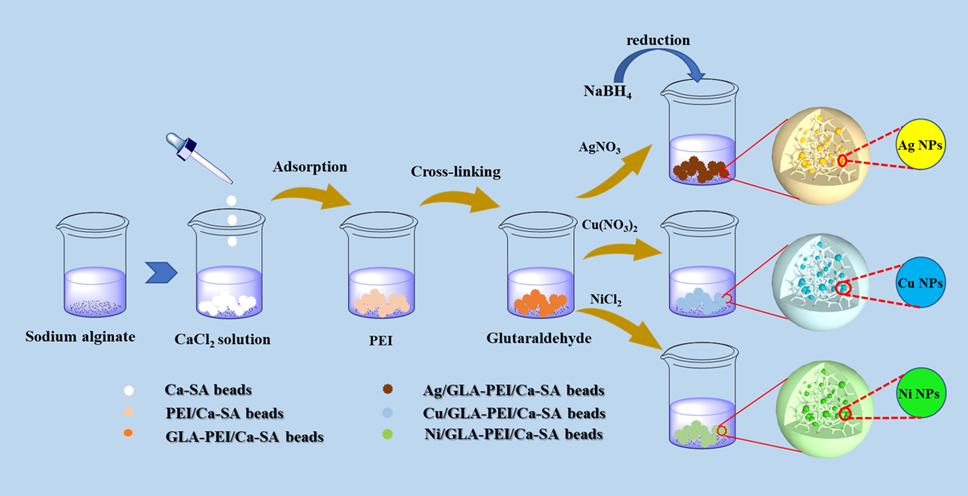
The entire preparation processes of Ag/GLA-PEI/Ca-SA, Cu/GLA-PEI/Ca-SA, and Ni/GLA-PEI/Ca-SA hydrogel beads are shown in Scheme 1. Typically, sodium alginate solution is added dropwise into CaCl2 solution to obtain Ca-SA hydrogel beads. The obtained hydrogel beads were completely solidified through stirring in the CaCl2 solution for 24 h. Afterward, the Ca-SA beads are added into the solution containing a certain amount of PEI. After a reaction for 24 h, the resulting hydrogel beads are added into a GLA solution to carry out the chemical crosslinking to enhance the mechanical property. The prepared samples are named as GLA-PEI/Ca-SA hydrogel beads, which are shown in Fig. S1. Subsequently, the obtained GLA-PEI/Ca-SA beads are put into a solution containing the metallic ions (Ag+, Cu2+, and Ni2+ ). Due to the complexation effect, the metallic ions are prone to being absorbed on the surface of the hydrogel beads. Then, upon addition of NaBH4 into the suspension contained GLA-PEI/Ca-SA beads, the ions are reduced to the corresponding metal nanoparticles.
FT-IR is widely used to investigate the chemical structure of the samples. As shown in Fig. 1, while the infrared spectra of the two samples are very similar, the Ca-SA beads have a strong absorption peak at 3416.3 cm− 1, corresponding to the stretching vibration of the -OH group[32]. Additionally, a weak peak near 2929.2 cm− 1 is caused by the stretching band of the C-H group. Peaks at 1600.6 and 1425.8 cm− 1 correspond to symmetric and asymmetric stretching vibrations of the C = O group[33]. After grafting PEI onto Ca-SA beads, a distinctive new characteristic peak is observed at 1630.8 cm− 1, indicating the formation of amide groups due to the reaction between the -NH2 on PEI and the -O = C-O- groups on SA, resulting in -N-H bending vibration[34]. These findings unequivocally establish the successful grafting of PEI onto the Ca-SA hydrogel beads.
SEM analysis provides more information about the surface morphology and internal structure. Figure 2 shows the corresponding SEM images and EDS mapping micrographs of Ag/GLA-PEI/Ca-SA, Cu/GLA-PEI/Ca-SA, and Ni/GLA-PEI/Ca-SA beads. It can be seen that Ag/GLA/Ca-SA beads without PEI modification have a 3D interconnected and honeycomb-like porous structure, which can enhance the mass transfer of reactants during the catalytic reactions, as shown in Fig. 2a. With the addition of PEI, the pores in the beads become smaller. It means that the beads can be used as a support for the catalysts. Our previous work has already proved that the alginate-based beads crosslinked by Ca2+ can be used as a support for Ag nanoparticles. By following the same procedure, Cu/GLA-PEI/Ca-SA and Ni/GLA-PEI/Ca-SA beads were also obtained, as shown in Fig. 2e and 1f. The SEM images reveal that both beads exhibit a similar structure with the Ag/GLA-PEI/Ca-SA beads. To obtain the detail element distribution, EDS analysis was conducted, as shown in Fig. 2g, 1m and 1n. It can be found that Ag, Cu and Ni nanoparticles are dispersed uniformly on the hydrogel beads, respectively. No aggregations or mass clusters are observed.
To observe the shape and size of nanoparticles on the beads, the as-prepared samples were characterized by TEM. TEM images of Ag, Cu, and Ni nanoparticles in the beads are given in Fig. 3. As shown in Fig. 3a, Ag nanoparticles without PEI modification distribute unevenly in the Ca-SA beads, with sizes ranging from 10 nm to 30 nm. After PEI is introduced onto the surface of Ca-SA beads, Ag nanoparticles with a narrow size distribution of 3.2–4.3 nm are well deposited on the beads. Due to their high surface area to volume ratio, these ultra-small Ag nanoparticles are expected to exhibit high catalytic activity during the catalytic reaction. For Cu/GLA-PEI/Ca-SA beads, as shown in Fig. 3c, a large amount of Cu nanoparticles with an average of 2.6 nm is uniformly dispersed on GLA-PEI/Ca-SA beads. Furthermore, the TEM image in Fig. 3d clearly shows that Ni nanoparticles are also well distributed in the beads and their size can be controlled in the range of 3.5–4.8 nm. These results demonstrate that the introduction of PEI in the beads induces the formation of metal nanoparticles with ultrafine size and high dispersion.
In order to demonstrate the ultrosamll metal nanoparticles are uniformly deposited on the hydrogel beads. XRD measurements were performed. The XRD patterns are shown in Fig. 4. The XRD pattern of Cu/GLA-PEI/Ca-SA in Fig. 4a reveals a broad diffraction peak at 20.8°, primarily attributed to the amorphous alginate structure[35]. In both the EDS analysis (Fig. 2m) and XPS results (Table 1), the presence of Cu in Cu/GLA-PEI/Ca-SA is confirmed. However, the absence of distinct Cu diffraction peaks in the XRD pattern demonstrates the existence of ultrafine Cu nanoparticles within the sample. These findings prove that Cu nanoparticles throughout the hydrogel spherical catalyst are well dispersed and quite small[36, 37]. The XRD pattern of Ni/GLA-PEI/Ca-SA in Fig. 4b is similar to the Cu/GLA-PEI/Ca-SA. As shown in Fig. 4c, Ag/GLA-PEI/Ca-SA shows an amorphous alginate diffraction peak at approximately 20°, along with a characteristic diffraction peak corresponding to the Ag (111) crystal plane at 39.3°[38]. According to Sherrer's formula, \(\text{D}=\text{K}{\lambda }/{\beta }\text{c}\text{o}\text{s}{\theta }\), where D is the grain size, β is the half-peak width of the diffraction peak, θ is the diffraction angle, k is the spherical factor, and λ equals 0.154056 nm[39]. We calculate the grain size perpendicular to the (111) crystal plane to be around 4 nm, which is consistent with the TEM results in Fig. 3.
XPS measurements were conducted in order to study the chemical composition of the samples. Figure 5a presents the wide-scan survey XPS spectrum of Ag/GLA-PEI/Ca-SA, Cu/GLA-PEI/Ca-SA, and Ni/GLA-PEI/Ca-SA beads. The peaks at the binding energies of 536.9, 400.2, 283.6, and 354.4 eV, corresponding to the O 1s, N 1s, C 1s, and Ca 2p peaks, are observed in the three kinds of beads. As shown in Fig. 5b, the high-resolution spectrum of Ag 3d in Ag/GLA-PEI/Ca-SA beads includes two peaks at 365.1 and 371.3 eV, which are assigned to Ag 3d5/2 and Ag 3d3/2 peaks of metallic Ag[36]. Generally, the difference between the peak positions of the two peaks is 6 eV, which indicates the existence of Ag nanoparticles[40]. Figure 5c shows the high-resolution XPS spectra of the Cu/GLA-PEI/Ca-SA beads, in which two peaks are observed at 930.2 and 950. 4 eV, which are assigned to Cu 2p3/2 and Cu 2p1/2 peaks of Cu[41]. As the size of Cu nanoparticles decreases, the peak position of the XPS map moves to the higher binding energy, and our experimental results are consistent with the fact. There is a satellite peak of Cu2+ at 943.4 eV, which may be caused by the oxidation of Cu on the catalyst surface to CuO by oxygen in the air[42]. For the Ni/GLA-PEI/Ca-SA beads in Fig. 5d, the peak position of Ni 2p is in the range of 863.1 to 865.4 eV, which demonstrates that metallic Ni nanoparticles are formed in the beads. In addition, the XPS spectrum of Fig. S2 shows that the peaks at the binding energy of 397.2 and 399.1 eV belong to = N − and − NH2 groups, respectively. Previous study has shown that the nitrogen functional groups are key elements in the binding of metal ions to the surface of Ca-SA hydrogel[43]. According to the XPS results, the atom content of Ag, Cu, and Ni can be calculated, as listed in Table 1. The Ag nanoparticle content in the Ag/GLA-PEI/Ca-SA beads is 1.40 at%. And the contents of copper and nickel atoms are 0.88 at% and 0.49 at%, respectively. This further proves that Ag, Cu, and Ni nanoparticles are successfully grown on the surface of the Ca-SA support. The presence of nitrogen element is attributed to the grafting of PEI on the beads.
Table 1
Elemental compositions of the Ag/GLA-PEI/Ca-SA, Cu/GLA-PEI/Ca-SA and Ni/GLA-PEI/Ca-SA beads quantified by XPS.
| Sample | N at% | Ca at% | Ag at% | Cu at% | Ni at% |
| Ag/GLA-PEI/Ca-SA | 4.51 | 1.47 | 1.40 | | |
| Cu/GLA-PEI/Ca-SA | 5.10 | 1.30 | | 0.88 | |
| Ni/GLA-PEI/Ca-SA | 4.33 | 1.46 | | | 0.49 |
Generally, the N2 adsorption-desorption technique was employed to study the structural property of the product. The textural characteristics were summarized in Table 2. By comparison, Ag/GLA-PEI/Ca-SA beads obviously exhibit higher specific surface area and total pore volumes than Ag/GLA/Ca-SA, which indicates that PEI grafting has an important influence on the structure of the as-prepared samples. Through PEI coating and GLA crosslinking, much more mesopores are formed in the Ag/GLA-PEI/Ca-SA beads. Moreover, Cu/GLA-PEI/Ca-SA and Ni/GLA-PEI/Ca-SA beads also exhibit high specific surface areas of 58.1and 86.2 m2 g− 1, with total pore volumes of 0.31 and 0.51 cm3 g− 1, respectively. The N2 adsorption-desorption isotherms and pore size distribution curves of these beads are shown in Fig. 6. As shown in Fig. 6a, all the N2 adsorption-desorption isotherms are of type Ⅳ. A shape that rises at high pressure from 0.9 to 1 (P/P0) indicates that lots of mesopores and macropores are generated during the freezing-dry process. Figure 6b displays the pore size distribution. We can observe that the Ag/GLA/Ca-SA, Ag/GLA-PEI/Ca-SA, Cu/GLA-PEI/Ca-SA, and Ni/GLA-PEI/Ca-SA beads present mesopore sizes centered at 15.1, 28.2, 21.0, and 23.5 nm, respectively. These results of pore size can be proved with those obtained from the TEM images in Fig. 3.
Table 2
Textural characteristics of the Ag/GLA/Ca-SA, Ag/GLA-PEI/Ca-SA, Cu/GLA-PEI/Ca-SA and Ni/GLA-PEI/Ca-SA beads.
| Sample | Stotal (m2 g− 1) | Vtotal (cm3 g− 1) | Average pore size (nm) |
| Ag/GLA/Ca-SA | 28.2 | 0.11 | 15.1 |
| Ag/GLA-PEI/Ca-SA | 83.5 | 0.56 | 28.2 |
| Cu/GLA-PEI/Ca-SA | 58.1 | 0.31 | 21.0 |
| Ni/GLA-PEI/Ca-SA | 86.2 | 0.51 | 23.5 |
To demonstrate the catalytic ability of all the samples, the reduction of 4-NP to 4-AP is selected as a model reaction to evaluate their catalytic performance. Figure 7a shows the photographs of Ag/GLA-PEI/Ca-SA, Cu/GLA-PEI/Ca-SA, and Ni/GLA-PEI/Ca-SA hydrogel beads. The diameter of the hydrogel beads is around 4 mm. Therefore, through simple filtration, the catalysts can be effectively recovered and reused, thus extending the catalysts life cycle. As shown in Fig. 7b, the solution containing 4-NP displays an absorption peak at 318 nm in the UV-Vis spectrum. With the addition of NaBH4, the characteristic peak shifts to 400 nm, and the color of the solution changes from light yellow to bright yellow. When the Ag/GLA/Ca-SA hydrogel beads are introduced into the solution, the peak at 400 nm decreases gradually, and a new peak appears at 300 nm. This new peak corresponds to 4-AP (Fig. 7e). Compared with the Ag/GLA/Ca-SA beads, the Ag/GLA-PEI/Ca-SA beads exhibit enhanced catalytic performance. And the reduction of 4-NP is completed within 360 s, 480 seconds shorter than the Ag/GLA/Ca-SA beads, as shown in Fig. 7f. It means that the PEI introduction on the beads allows the formation of catalysts with ultrafine and monodispersed Ag nanoparticles within 5 nm, which can provide more catalytic active sites for the reduction of 4-NP. As shown in Fig. 7c, the Cu/GLA-PEI/Ca-SA hydrogel beads exhibit the highest catalytic activity for 4-NP reduction. The reduction is completed within 210 s. For the Ni/GLA-PEI/Ca-SA beads (Fig. 7d, 4-NP is completely transformed to 4-AP within 720 s. The reaction follows a first-order law, and the kinetic equation can be written as: ln(C/C0) =-kt. It can be calculated that the k values are 1.42×10− 3 s− 1 (Ag/PEI/Ca-SA), 1.01×10− 2 s− 1 (Ag/GLA-PEI/Ca-SA), 1.56×10− 2 s− 1 (Cu/GLA-PEI/Ca-SA), and 5.68×10− 3 s− 1 (Ni/GLA-PEI/Ca-SA), respectively. Among them, the catalytic stability of the Ag/GLA-PEI/Ca-SA beads was further studied. It can be found that only 5% loss in the conversion is observed after the beads were recycled for 7 times, which demonstrates that the catalyst possesses high stability and durable activity. Moreover, we made a comparison of the catalytic activity of the three samples with other catalysts, as shown in Table 3. These catalysts display much higher catalytic activity. In particular, kinetic rate constant of the Cu/GLA-PEI/Ca-SA beads is as high as 1.56×10− 2 s− 1. The results demonstrate that a general and robust method is provided to fabricate the alginate-based supported metallic nanoparticle catalysts with excellent catalytic activity for the reduction of 4-NP.
Table 3
Comparison of the catalytic activity of different catalysts for the reduction of 4-NP.
| No. | catalyst | 4-NP (mM) | NaBH4 (mM) | k (×10− 3 s− 1) | references |
| 1 | Ag/GLA-PEI/Ca-SA | 0.25 | 15 | 10.1 | This work |
| 2 | Cu/GLA-PEI/Ca-SA | 0.25 | 15 | 15.6 | This work |
| 3 | Ni/GLA-PEI/Ca-SA | 0.25 | 15 | 5.68 | This work |
| 4 | Ni-RGO hybrids | 0.1 | 100 | 1.8 | Aslam [44] et al., 2021 |
| 5 | Au@C particles | 0.11 | 10 | 0.6 | Ye[45] et al., 2019 |
| 6 | Pd/GDYO | 0.1 | 10 | 5.37 | Ma[46] et al., 2019 |
| 7 | Pt-PDA/rGO | 0.1 | 100 | 3.43 | Xu[47] et al., 2023 |
| 8 | Ag-Au-rGO | 5 | 10 | 3.47 | Wang[48] et al., 2022 |