General methods. All reactants and reagents were of commercial grade and were used without further purification. All solutions were prepared from MilliQ water. Metal-free buffer solutions used for radiolabeling were prepared using Chelex 100 Resin (100-200 mesh, BioRad). All animal experiments were performed in compliance with institutional guidelines and approved by the Institutional Animal Care and Use Committee at Massachusetts General Hospital (Boston, MA).
Synthesis of NODAGA-MN-anti-miR10b.
The steps for the synthesis of nat/64Cu-MN-anti-miR10b are outlined in Scheme 1. Amine-derivatized iron oxide nanoparticles (MN) were prepared from dextran-coated iron oxide nanoparticles through modification with epichlorohydrin and ammonium hydroxide as described previously 17. The nanoparticles were conjugated with NODAGA-NHS (Chematech, France) by reacting 1 ml of MN (87 μM, 10 mg Fe/ml, 54 NH2/MN) with 2.54 mg of NODAGA-NHS ester (3.47 mmol, 40 eq. to MN) in 100 μl PBS buffer (100 mM, pH 7.4). The reaction was carried out overnight at 4°C, then the resulting NODAGA-conjugated nanoparticles (NODAGA-MN) were purified with a size exclusion column (PD-10, GE Healthcare) using nuclease free PBS buffer as an eluent. NODAGA-MN was treated with excess amounts of SPDP (250 eq.) for 4 hrs at 4°C to form NODAGA-MN-SPDP, which was again purified with a size exclusion column using nuclease free PBS buffer as an eluent. The LNA antagomir, anti-miR10b is synthesized and provided by Biospring (Frankfurt, Germany) following a GLP protocol. The anti-miR10b LNA antagomir was modified with the 5’-Thiol-Modifier C6 disulfide (5’-ThioMC6), which was utilized for conjugation to MN. The disulfide on the oligonucleotide was activated by 3% Tris (2-carboxyethyl) phosphine hydrochloride (TCEP, Thermoscientific Co.), followed by purification with ammonium acetate/ethanol precipitation treatment prior to conjugation to MN. After TCEP activation and purification, the oligo was dissolved in nuclease free water and incubated with NODAGA-MN-SPDP overnight. The final product, NODAGA-MN-anti-miR10b, was freshly prepared prior to animal studies.
Preparation of non-radioactive natCu-MN-anti-miR10b
Nonradioactive natCu-MN-anti-miR10b was prepared to evaluate the inhibitory effect of miR-10b in 4T1 cells. 0.6 mg Fe of NODAGA-MN-anti-miR10b were dispersed in acetate buffer (500 µL, pH 6.8, 0.1 M) followed by the addition of CuCl2 (0.7 mg, 50 equiv. Cu2+ to NODAGA). The reaction mixture was stirred at 60˚C for 20 min and EDTA (100 µL, 100 mM, pH 7.4) was added to the mixture to remove any unlabeled free Cu2+ ions followed by purification with size exclusion column (PD-10, GE Healthcare) using nuclease free PBS buffer as an eluent. Fractions containing the desired product were combined and the concentration of natCu-MN-anti-miR10b was determined by ICP-MS.
Preparation of radiolabeled MN-anti-miR10b (64Cu-MN-anti-miR10b)
Radiolabeling was performed following commonly used procedures 18. Briefly, 200 µg (as Fe) of NODAGA-MN-anti-miR10b in PBS was added to a solution of 64CuCl2 (4 mCi, 148 MBq, the University of Wisconsin at Madison, WI) in sodium acetate buffer (0.1 M, pH 6.8, 500 µL). The reaction mixture was heated at 60˚C for 20 min and then purified with a size exclusion column (PD-10 column) using nuclease free PBS buffer as an eluent and each 500 µL of eluent was collected as a fraction. The radiochemical purity of each fraction was controlled by iTLC (Agilent, iTLC-SG, Santa Clara, CA) with an EDTA solution as an eluent (50 mM, pH 5) using a radio-TLC imaging scanner (AR-2000, Eckert & Ziegler, Berlin, Germany). Fractions with a radiochemical purity > 99% were combined and used for in vivo animal studies. Radiochemical identity of the final solution of 64Cu-MN-anti-miR10b was confirmed by analytical HPLC (Agilent 1100 HPLC system, Santa Clara, CA) with a size exclusion column (TSK gel QC-PAK-300, isocratic, 100% sodium phosphate 0.1 M pH 7.4, 20 min) and a Carroll/Ramsey radioactivity detector with a silicon PIN photodiode and with UV detection at 254 nm.
Characterization of MN-anti-miR10b and natCu-MN-anti-miR10b
ICP-MS analysis (Agilent 8800-QQQ system, Santa Clara, CA) was carried out to determine the concentrations of copper and iron. All samples were prepared by weight. Calibration standards were prepared by diluting certified copper and iron standards (1000 mg/L). Calibration curve was obtained from 5 standard solutions in the range from 0.1 to 400 ppb. Lutetium (1 ppm) was used as an external standard to ensure the proper introduction of the sample. The hydrodynamic diameter and Zeta-potential were measured by a dynamic light scattering spectrometer (Zetasizer Nano, Malvern, UK) and the size of the iron oxide core was determined by transmission electron microscopy (JEM 2100 TEM, Jeol, Tokyo, Japan). To quantify the number of NODAGA per MN, the number of amines per MN was subtracted from the number of amines per MN after conjugation with NODAGA. The number of amines per MN was quantified by pyridine-2-thione (343nm, 8080 M-1cm-1) released from SPDP that was conjugated to the amine groups at a one-to-one ratio (ThermoFisher, Waltham, MA). Finally, the number of oligonucleotides per MN was determined by spectrophotometry with multiple standards of different concentrations. Briefly, MN-anti-miR10b and natCu-MN-anti-miR10b were purified using a magnetic column (MACS column, Miltenyi, Cambridge, MA) to remove unbound anti-miR10b oligo. The purified nanoparticles were assayed to determine iron concentration (410 nm) and the concentration of oligo (260 nm) by spectrophotometry (Spectramax M2 microplate reader, Molecular Devices, Sunnyvale, CA).
Cellular uptake
The cellular uptake of natCu-MN-anti-miR10b was compared with that of MN-anti-miR10b and parent MN. 4T1-luc cells were seeded in a 12-well plate and incubated with natCu-MN-anti-miR10b, MN-anti-miR10b, and MN for 24 hrs at 37 °C. After washing with DPBS, the cells were lysed (Cell lysis buffer, Sigma-Aldrich, St. Louis, MO) and analyzed by ICP-MS to determine the concentration of iron. The protein concentration was determined by BCA assay (Sigma-Aldrich, St. Louis, MO). The cellular uptake of nanoparticles was normalized by total protein.
Real-time quantitative reverse transcription-PCR
To assess target engagement by natCu-MN-anti-miR10b as compared to the unlabeled MN-anti-miR10b, 4T1-luc cells were incubated with natCu-MN-anti-miR10b, MN-anti-miR10b, and MN for 48 hrs at 37 °C. From the cell lysates, the microRNA-enriched fraction was harvested using a miRNeasy mini kit following the manufacturer’s protocol (Qiagen Inc., Hilden, Germany). Relative expression of miR-10b was determined by real-time quantitative reverse transcription-PCR (qRT-PCR; Taqman protocol) and normalized to the internal housekeeping gene, SNORD44. Taqman analysis was carried out using an ABI Prism 7700 sequence detection system (Applied Biosystems, Foster City, CA). The primers (Hs-miR-10b-3 miScript Primer, Hs-SNORD44-11 miScript Primer) and assay kit (miScript PCR Starter Kit, Qiagen, Hilden, Germany).
Animal model and administration of 64Cu-MN-anti-miR10b.
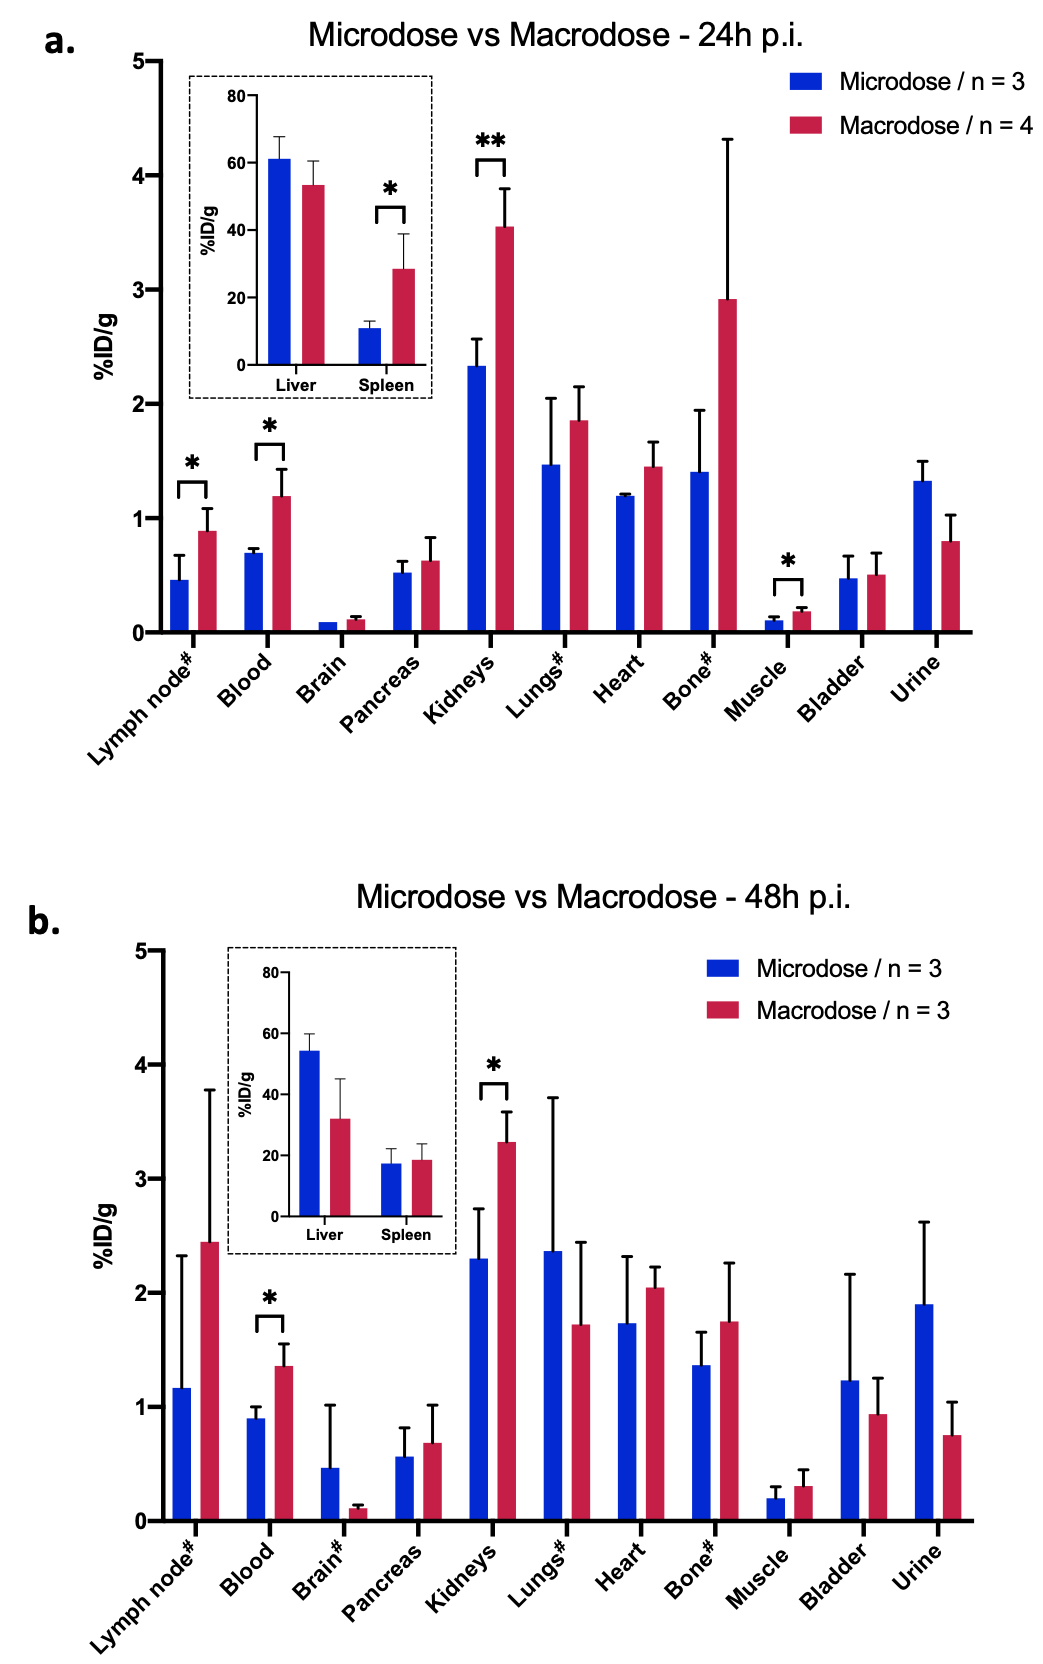
Eight-week-old female Balb/c mice (The Jackson Laboratory; Bar Harbor, ME) were implanted orthotopically under the top right third mammary fat pad with the 4T1-Red-Fluc cell line (0.5 x 10⁶ cells). The cells express luciferase and can be detected by non-invasive bioluminescence imaging (BLI) for corresponding analysis of tumor burden. All animals were scanned by BLI to keep track of metastasis formation twice a week. Two weeks after cell inoculation, mice were injected intravenously with 64Cu-MN-anti-miR10b. For the microdosing studies, 64Cu-MN-anti-miR10b prepared as described above, was injected at a dose of 20 mg as Fe, 118-190 mCi per mouse, n = 6. For the carrier-added macrodosing studies, 64Cu-MN-anti-miR10b was mixed with NODAGA-MN-anti-miR10b and injected at a dose of 300 µg as Fe, 127-135 µCi per mouse, n = 7. An aliquot of the injected dose was analyzed for %ID/g calculations.
After PET-MR imaging, mice were sacrificed at 24 hr post injection (n = 3 in microdose group and n = 4 in macrodose group) and 48 hr post injection (n = 3 in each group) for ex vivo biodistribution analysis.
Bioluminescence optical imaging (BLI)
BLI was used to identify metastases. Imaging was performed using the IVIS Spectrum imaging system (Perkin Elmer, Hopkinton, MA). Anesthetized mice were injected intraperitoneally with D-luciferin potassium salt in DPBS (200 mL of 15 mg/mL; Perkin Elmer, Hopkinton, MA) 12 minutes before image acquisition. Identical imaging acquisition settings (time, ~ 0.5–60 seconds; F-stop, 2; binning, medium) and the same ROI were used to obtain total radiance (photons/sec/cm2/sr) over the whole body. BLI was performed for about 6 to 15 minutes to obtain the maximum radiance. All images were processed using the Living Image Software (ver 4.5, IVIS Spectrum, Perkin Elmer, Hopkinton, MA). The total radiance from the bioluminescence readings was used for signal quantification.
PET-MR imaging
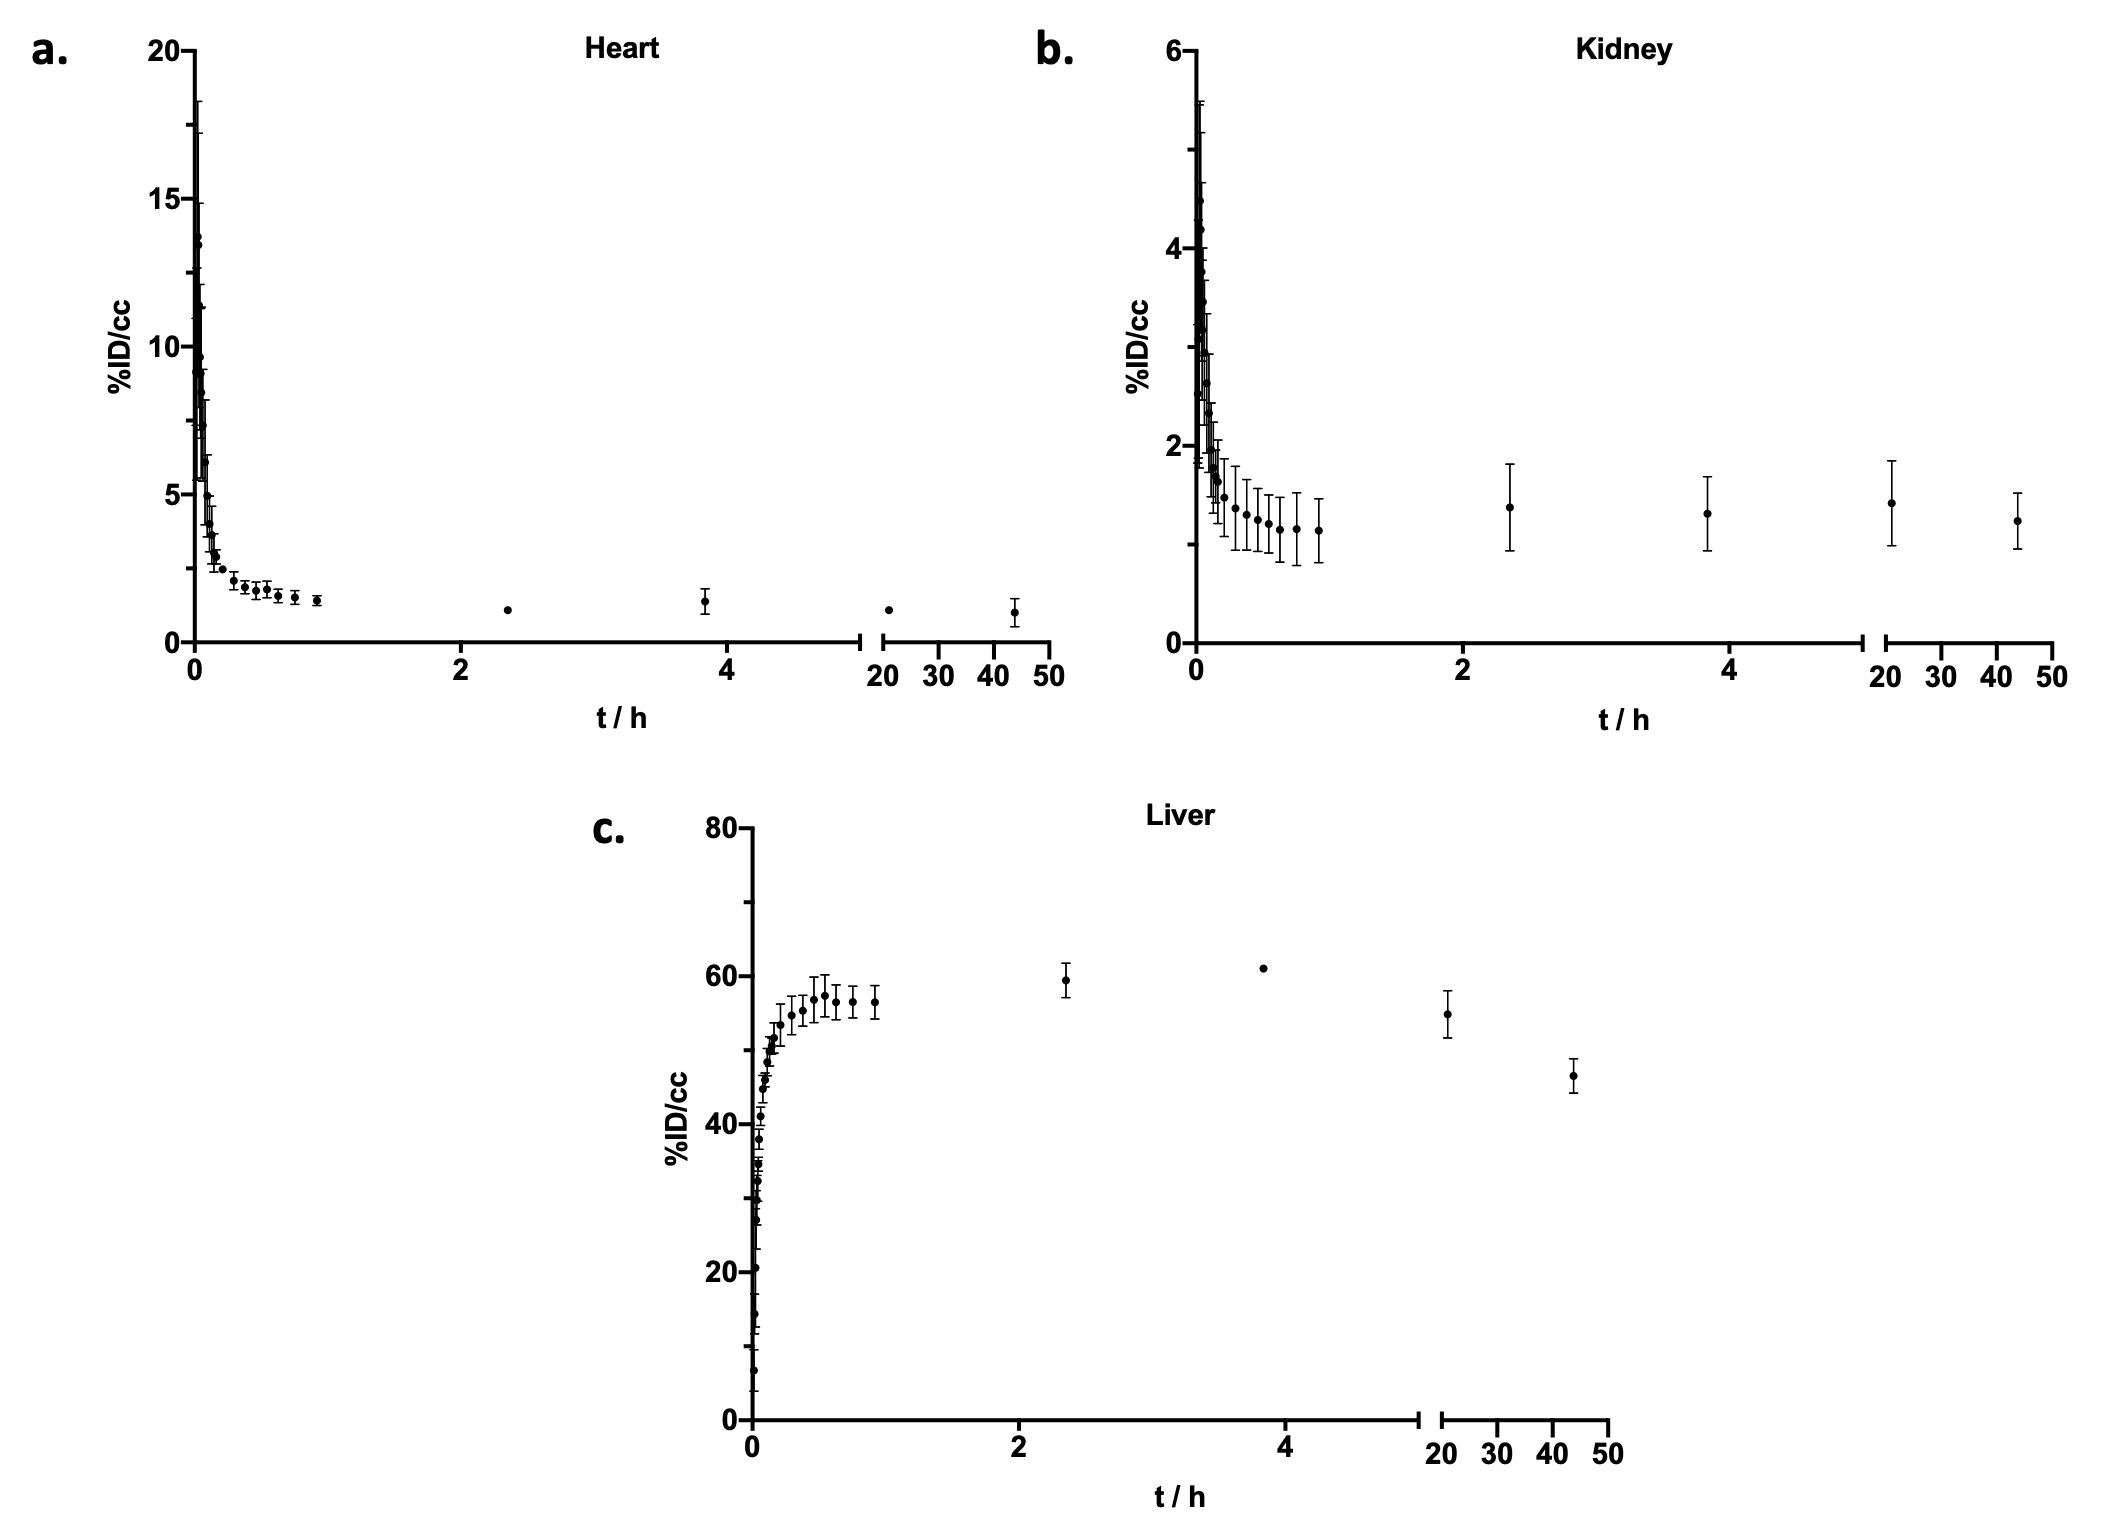
Mice were imaged in a 4.7 Tesla MRI scanner equipped with a PET insert (Bruker, Billerica MA). Mice were anesthetized with 1-2% isoflurane in medical air. Mice were kept warm using an air heater system and body temperature and respiration rate monitored by a physiological monitoring system (SA Instruments Inc., Stony Brook NY) throughout the imaging session. For the microdosing studies, dynamic PET acquisition was performed continuously for 1 hr after injection of 64Cu-MN-anti-miR10b. Mice were then returned to their cages and imaged again at 2 hr, 4 hr, 24 hr and 48 hr post-injection for a period of 30 mins, 30 mins, 60 mins, and 60 mins, respectively. For the macrodosing studies, mice were scanned at 24 hr after injection of 64Cu-MN-anti-miR10b for 60 mins. For ex-vivo imaging, organs were positioned onto a plastic holder and scanned for 15 minutes.
Anatomic MR images were obtained simultaneously with PET acquisition, including T1-weighted 3D FLASH (Fast Low Angle Shot) sequences with the following parameters: echo time (TE) = 3 ms, repetition time (TR) = 20 ms, imaging resolution = 0.25 x 0.25 x 0.5 mm3/voxel, and flip angle = 12 degrees.
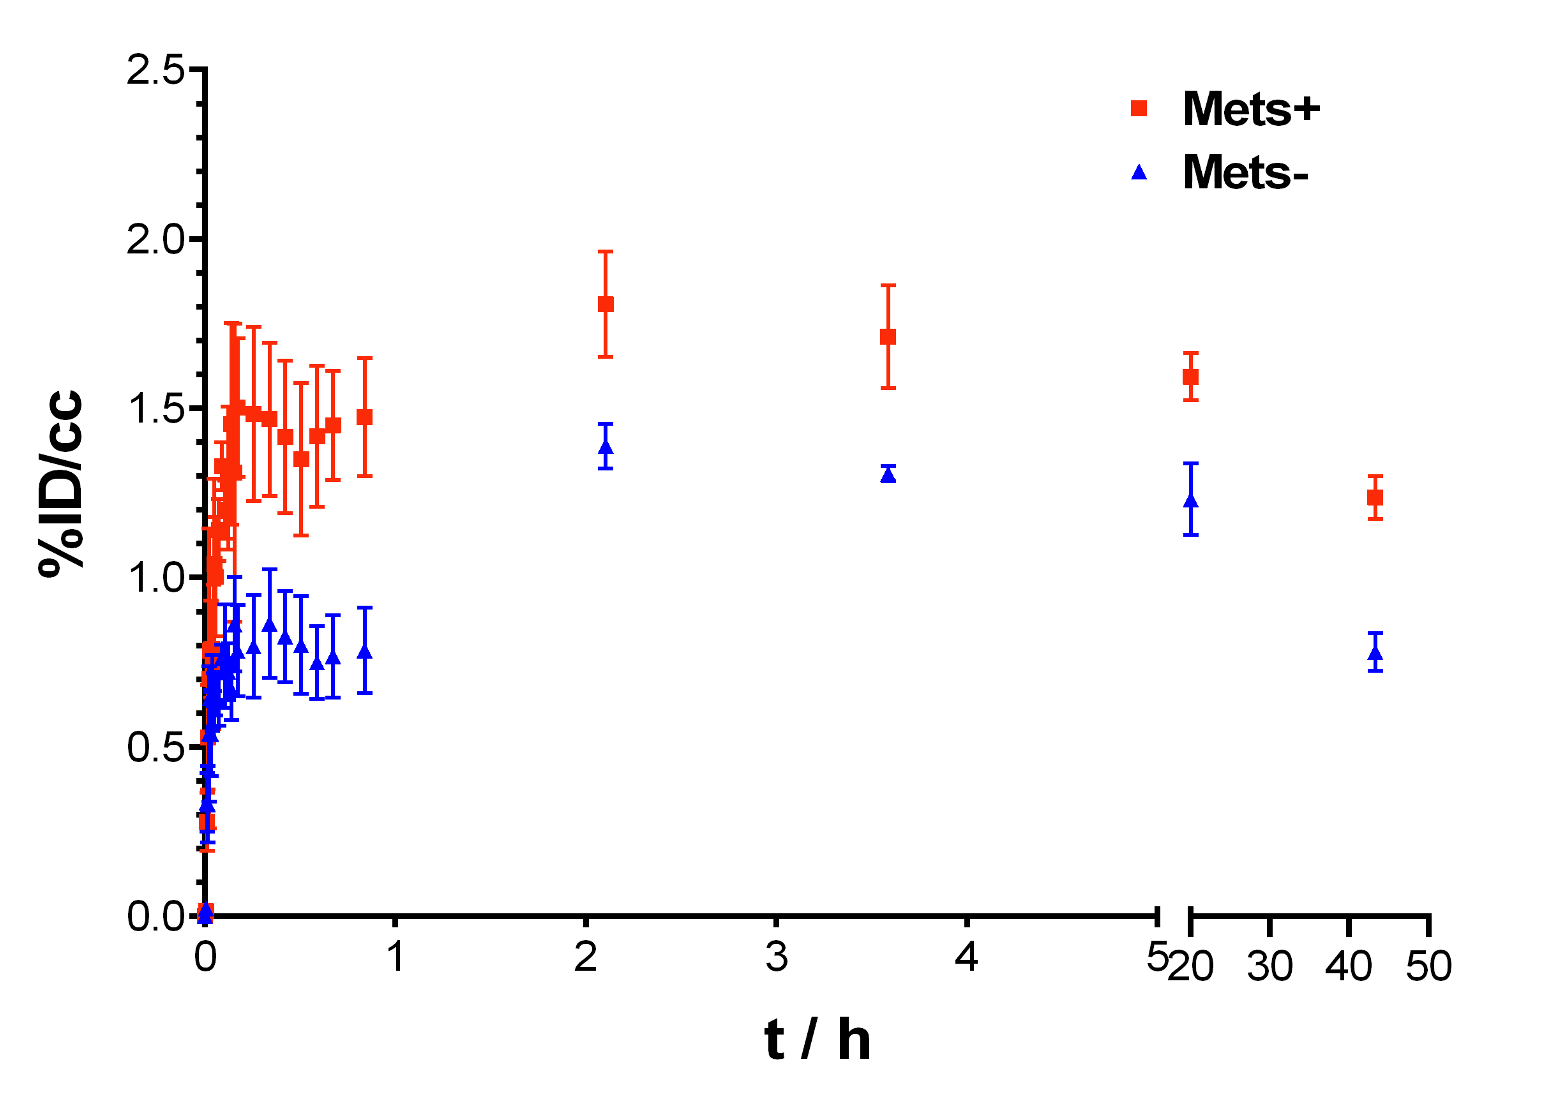
PET-MR imaging data were analyzed to estimate the biodistribution and clearance of 64Cu-MN-anti-miR10b. Regions of interest (ROIs) were drawn on the MR images over major organs, including heart, liver and kidneys using AMIDE software package 19, and used for quantifying radioactivity for each PET frame. The uptake of 64Cu-MN-anti-miR10b in metastases and corresponding tissues without metastases was quantified using ROIs over metastatic bone and lymph node identified by BLI and their non-metastatic contralateral counterparts. Results were expressed as percentage of injected dose per cubic centimeter of tissue (%ID/cc).
Ex vivo biodistribution
Animals were sacrificed at 24 hr and 48 hr post injection. The following organs and tissues were collected: lymph nodes, blood, urine, kidneys, liver, spleen, pancreas, heart, lungs, brain, femur, bladder and muscle. After resection and ex vivo scanning, organs were weighed and the counts in each organ were measured using a gamma counter (Wizard, Perkin Elmer) with correction for decay.
Statistical Analysis
Data were expressed as mean ± s.d. Statistical comparisons were made using a two-tailed t-test using GraphPad Prism software. A P value of less than 0.05 was considered statistically significant.