Characteristics of Anoikis-Related Genes at the Single-Cell Transcriptomic Level
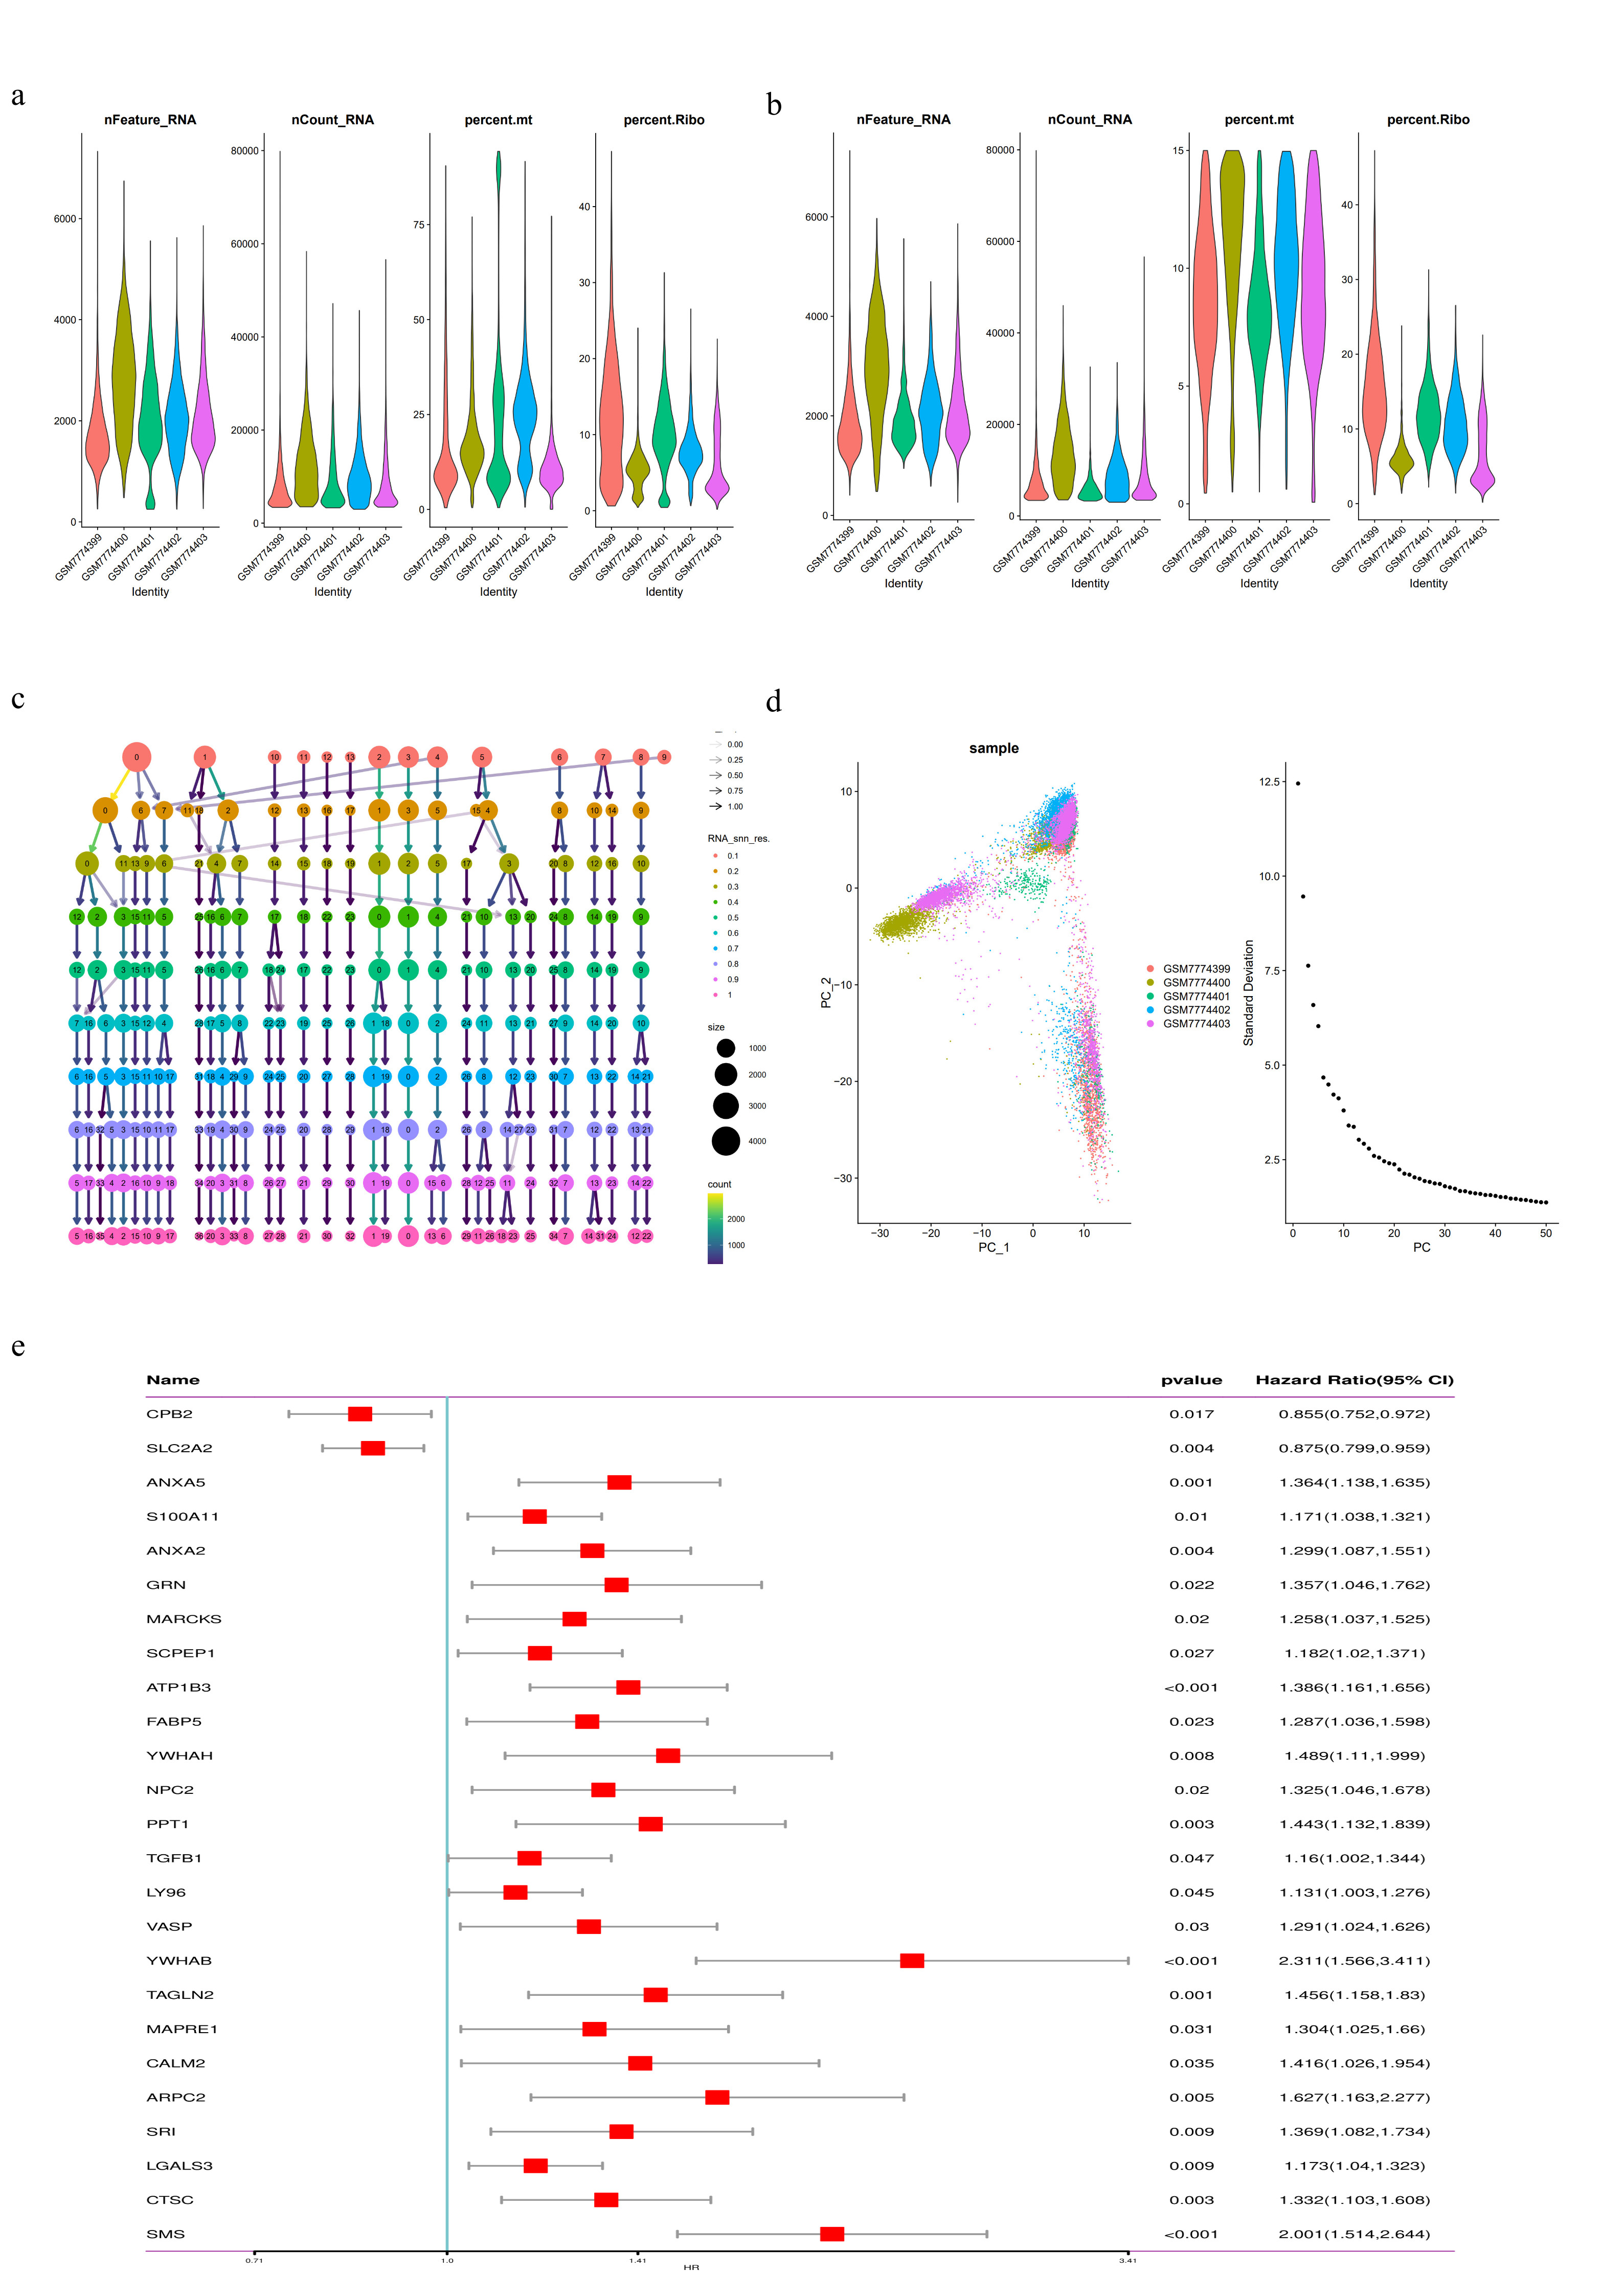
We analyzed 32,830 single-cell data from five HCC patients from the GEO dataset (GSE242889). Using the "Seurat" package, we first conducted quality control by filtering cells with a total gene count (nFeature-RNA) ranging from 100 to 7500, total gene expression count (nCount-RNA) exceeding 1000, and mitochondrial gene expression percentage (percent.mito) less than 15% (Supplementary Figs. 1a, b). Subsequently, principal component analysis (PCA) was performed on the top 2000 highly variable genes, followed by dimensionality reduction based on the top 40 principal components (PCs). Different resolution clustering trees were constructed using the R package "Clustertree" with specific resolutions selected for clustering and visualized using the t-SNE method (Supplementary Figs. 1c, d, and Fig. 1a). Based on marker genes for different cell types from previous studies, cells were categorized into nine clusters: macrophages, monocytes, plasma cells, T cells, tumor cells, dendritic cells, fibroblasts, adipocytes, and endothelial cells (Fig. 1b), and heatmaps displayed the top five marker genes within each cluster (Fig. 1c).
Subsequently, the activity of anoikis-related genes in each cell was calculated using the "AddModuleScore" function in the Seurat package (Figs. 1d, e). Among the nine cell types, we observed higher activities of anoikis-related genes in fibroblasts, endothelial cells, and macrophages (Fig. 1e). Based on the scoring of anoikis-related genes, all cells were divided into high and low scoring groups, and an analysis of 1537 differentially expressed genes between these groups was conducted for further study (Supplementary Table 3).
Identification of Anoikis-Related Genes at Single-Cell and Bulk Transcriptomic Levels
We employed the ssGSEA algorithm to calculate activity scores for genes associated with anoikis in TCGA-LIHC samples, using these scores to conduct WGCNA analysis for identifying gene modules significantly related to these genes. Further, we constructed a co-expression network with 1537 differential genes identified from single-cell analyses, as shown in Fig. 3a. An optimal power threshold of 8 was selected to ensure a scale-free topology of the network (Fig. 3b). By setting the minimum module size to 50 and the merge cut height to 0.15, we identified five modules (Figs. 3c, d). Results demonstrated a strong correlation between the MEBrown module and the Anoikis-related genes in Bulk RNA-Seq (correlation coefficient = 0.73, p-value = 7e-58, Fig. 3d). Moreover, a scatter plot illustrating the relationship between gene significance (GS) and module membership (MM) for the 252 genes in this module revealed a significant correlation (correlation coefficient = 0.58, p-value = 4.7e-24, Fig. 3e), suggesting a potential association of these genes with anoikis.
Next, we performed GO enrichment analysis on anoikis-related genes (Fig. 3f). The results indicated significant enrichment in cellular components (CC) such as the collagen-containing extracellular matrix, vesicle lumen, cytoplasmic vesicle lumen, and secretory granule lumen. In biological processes (BP), significant enrichment was observed in maintenance of location and cell killing. Additionally, in molecular functions (MF), significant enrichment was found in actin binding and cadherin binding.
The volcano plot (Fig. 4a) displays DEGs between tumor and normal liver tissues within the TCGA-LIHC bulk RNA-seq data, with selection criteria of |logFC| > log2(1.5) and adjusted p-value < 0.05. An intersection analysis of 252 genes from the brown module (Supplementary Table 3) with the DEGs identified in the bulk RNA-seq resulted in 84 genes (Fig. 4b, Supplementary Table 5). These genes are considered to be associated with anoikis at both the bulk RNA and single-cell RNA levels.
Development of a Prognostic Prediction Model Based on Anoikis-Related Genes
Univariate Cox regression analysis was performed on these 84 genes, identifying 27 genes significantly associated with overall survival (OS) (p < 0.05). Cross-validation with the external ICGC-LIRI dataset extracted 25 common genes (Supplementary Fig. 1e). Further analysis of these 25 genes included their interaction networks and the frequency of copy number variations (CNVs), revealing that the frequency of CNV loss in CPB2 exceeded 18%, and the increase in CNV loss in S100A11 was over 16% (Fig. 4c).
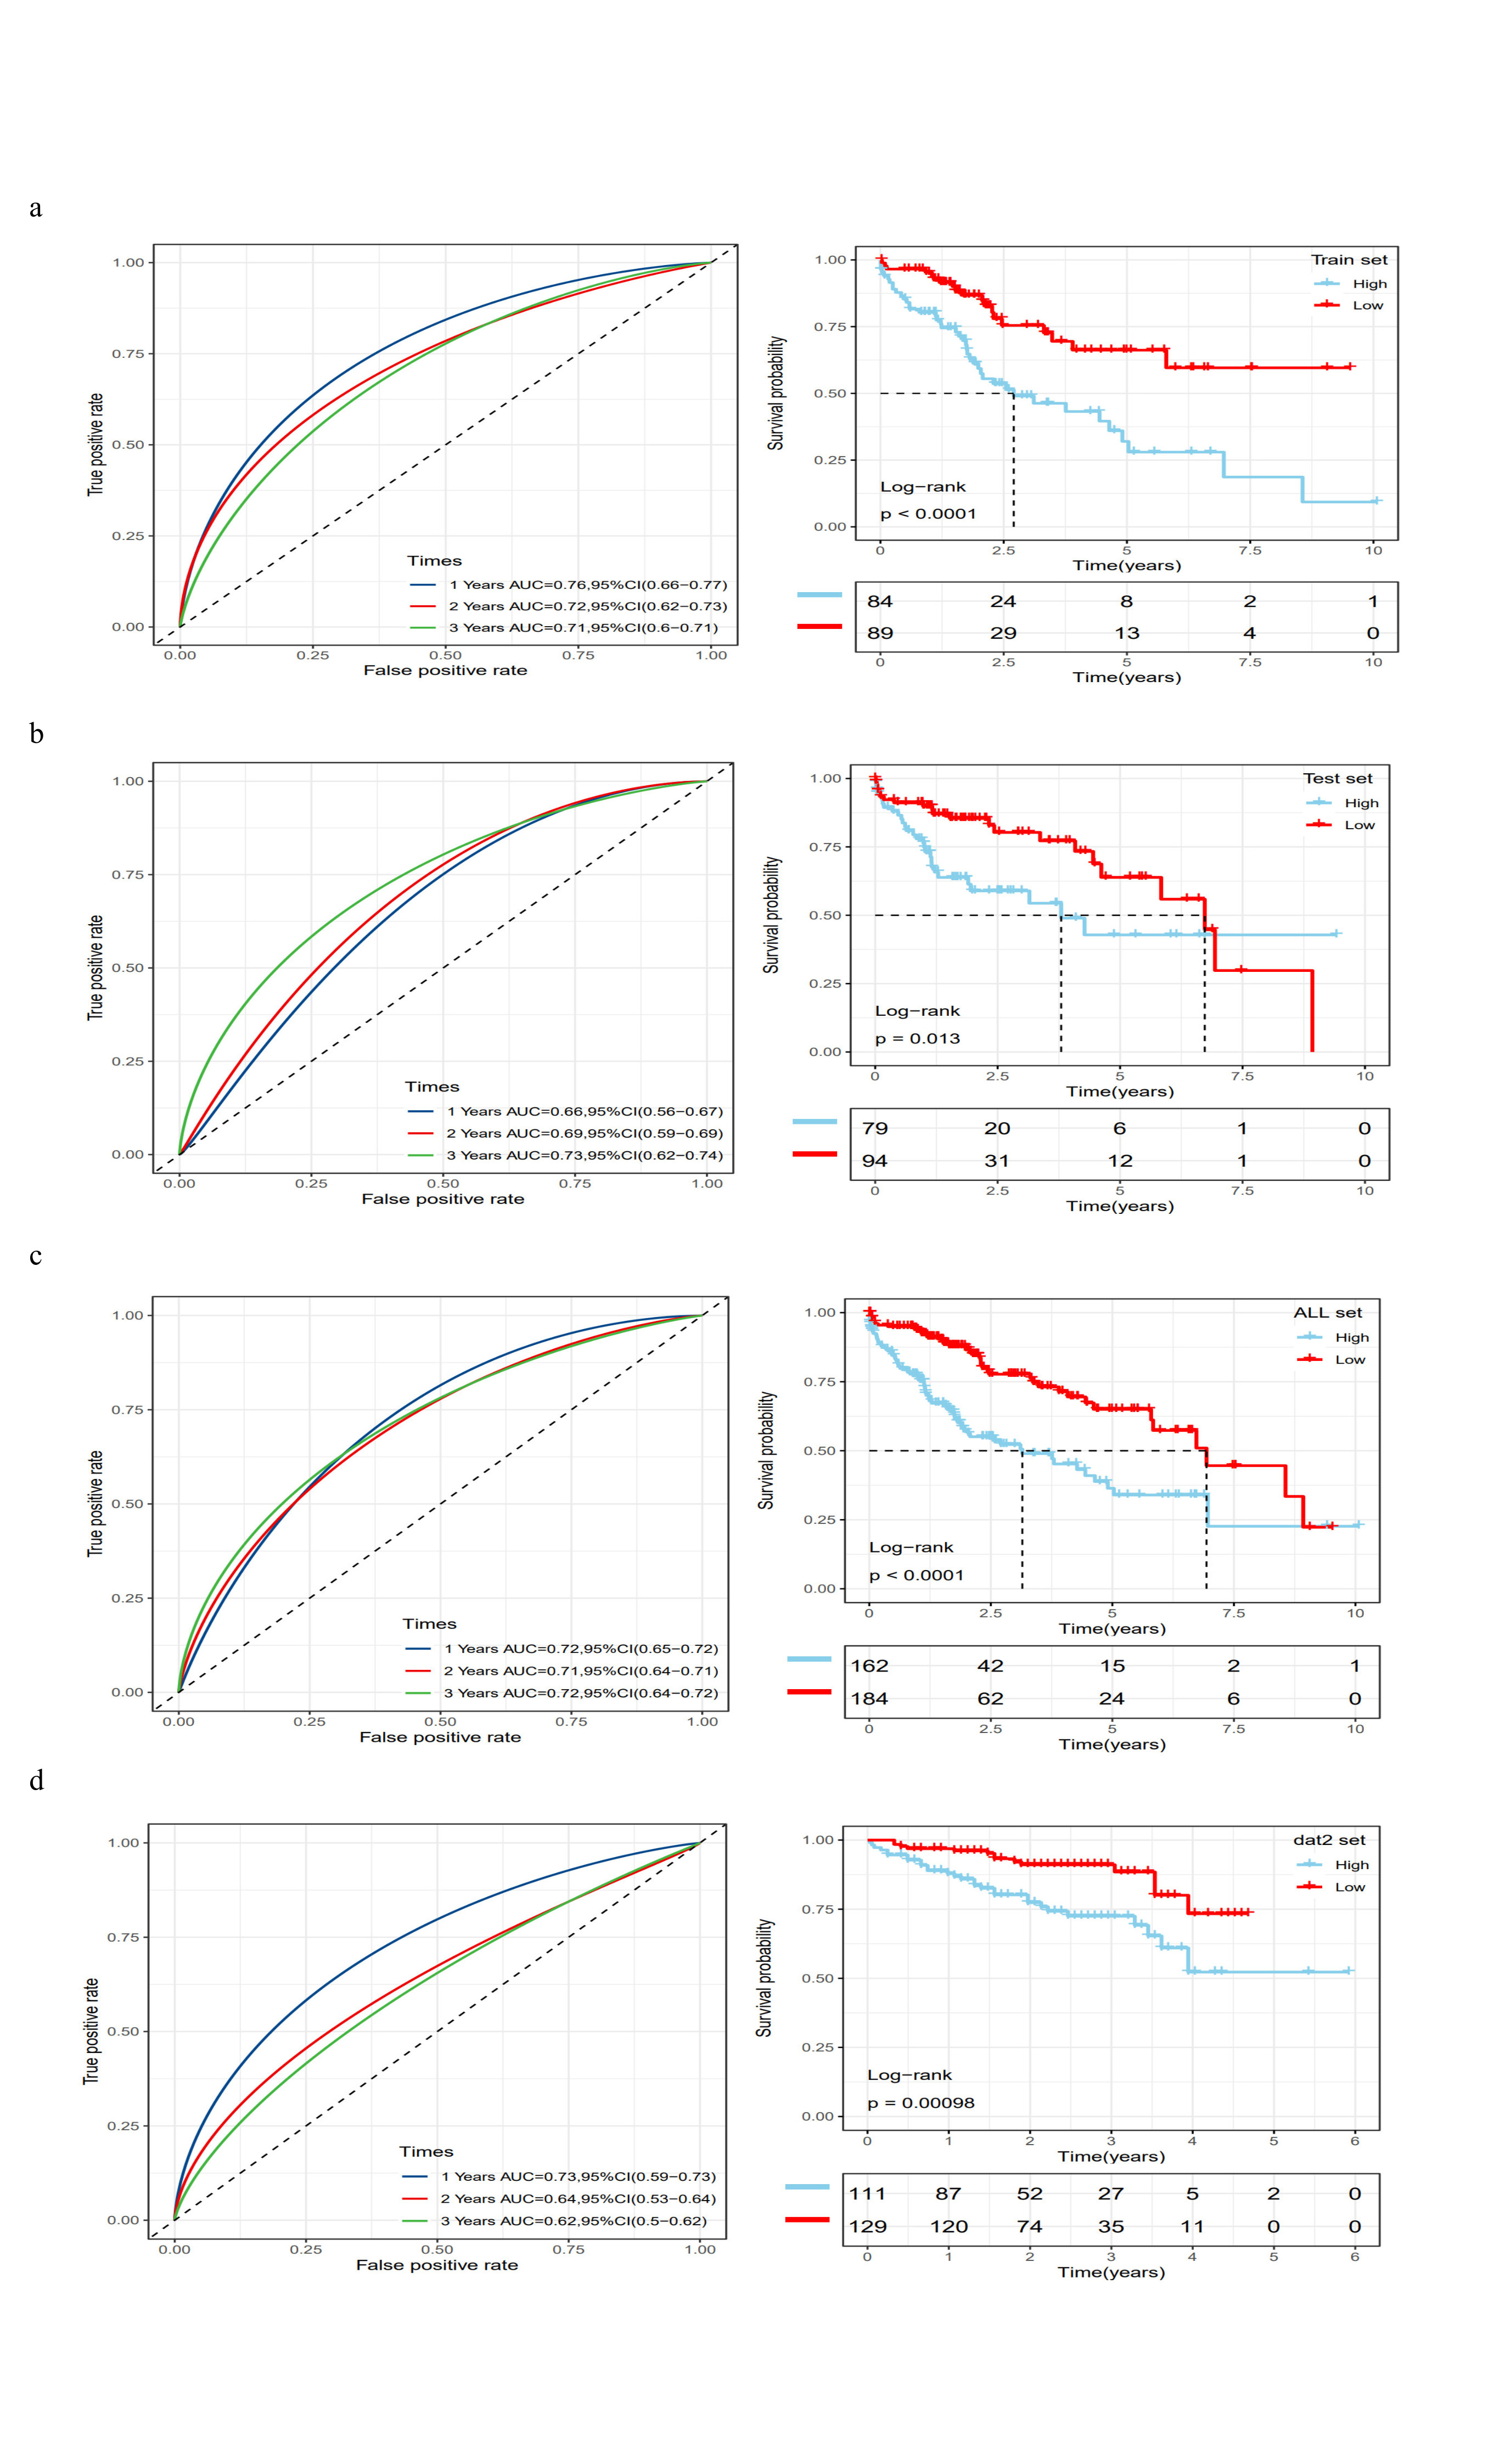
Subsequently, the TCGA-LIHC dataset was randomly divided into two groups at a 1:1 ratio, one serving as the training set (n = 174) and the other as the internal validation set (n = 173). In the training set, stepwise regression and multivariate Cox analysis identified eight genes as independent prognostic markers: SLC2A2, ANXA2, ATP1B3, YWHAH, YWHAB, MAPRE1, ARPC2, and SMS (Fig. 4d). The risk scores for samples were calculated as the sum of the products of these eight genes and their risk coefficients, standardized using a z-score, with scores above zero indicating a high-risk group, and below zero a low-risk group. Clinical characteristics and risk scores for each dataset are shown in Supplementary Tables 6–9. Survival analyses based on risk scores were conducted in the training, internal validation, and external validation sets, with Kaplan-Meier curves consistently demonstrating poorer prognosis in the high-risk group compared to the low-risk group (Figs. 4e-g). Time-dependent ROC curve analysis was employed to evaluate the sensitivity and specificity of the prognostic risk score model. Results showed that the AUCs for the TCGA-LIHC training dataset at 1, 2, and 3 years were 0.76, 0.72, and 0.71 respectively (Supplementary Fig. 2a); for the internal validation dataset at 1, 2, and 3 years were 0.66, 0.69, and 0.73 respectively (Supplementary Fig. 2b); for the ICGC validation dataset at 1, 2, and 3 years were 0.73, 0.64, and 0.62 respectively (Supplementary Fig. 2c). Further survival analysis of the entire TCGA-LIHC dataset and corresponding ROC curves indicated that the high-risk group had a worse prognosis compared to the low-risk group, with 1, 2, and 3-year AUCs of 0.72, 0.71, and 0.72 respectively (Supplementary Fig. 2d). These results collectively demonstrate that this predictive model has good sensitivity and specificity for prognosticating outcomes in HCC patients.
The C-index (Concordance Index) is a metric used to evaluate the accuracy of survival models, indicating the consistency between the model's predictions and the actual survival times. A higher C-index value suggests better predictive performance of the model. Furthermore, we compared the C-index of AnoRGs with previously published prognostic models related to anoikis-related genes[21–27]. Our results showed that the C-index of our model was the highest (Fig. 4h, Supplementary Table 10), demonstrating the superior predictive capability of AnoRGs.
The relationship AnoRGs and clinical characteristics
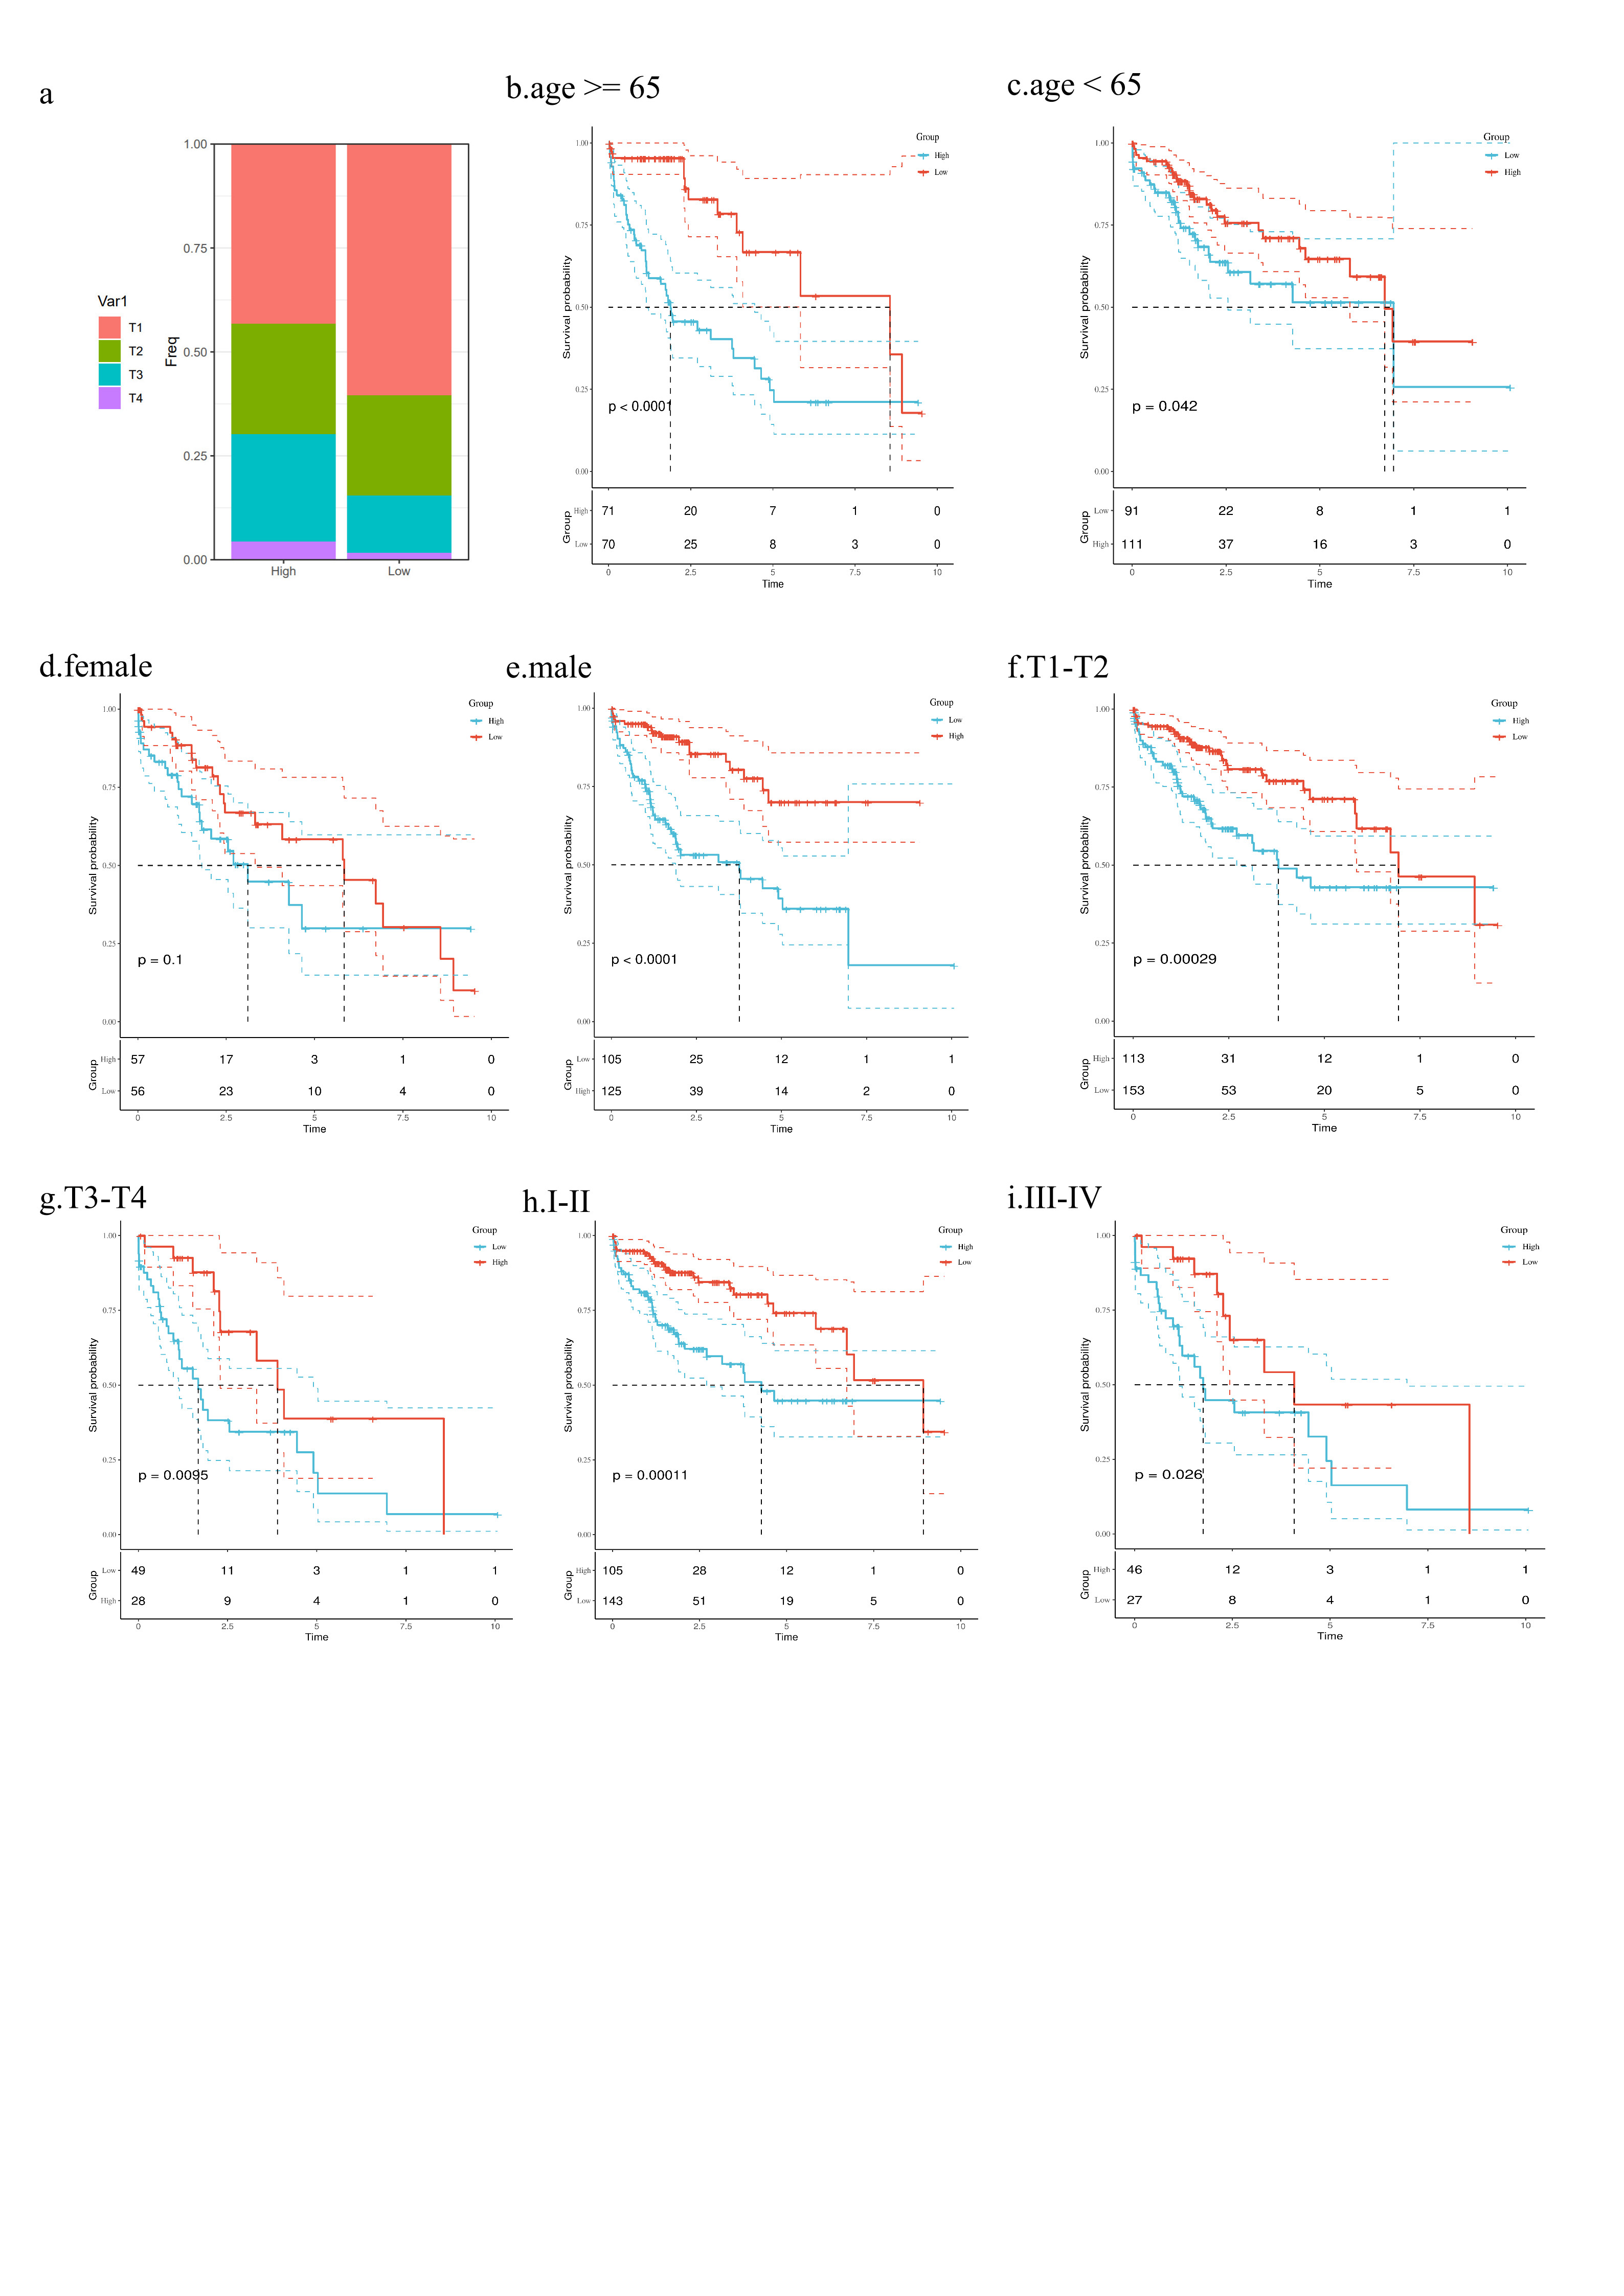
We analyzed the correlation between risk scores and clinical characteristics. In the TCGA-LIHC dataset, we found significant differences in the distribution of T stage and grade between the high-risk and low-risk groups (Fig. 5a, Supplementary Fig. 3a) (p < 0.001, chi-squared test). In the high-risk group, the expression levels of seven genes—ANXA2, ATP1B3, YWHAH, YWHAB, MAPRE1, ARPC2, and SMS—were significantly higher, while the SLC2A2 gene was more highly expressed in the low-risk group (Fig. 5a). Patients with T3-T4 stage or III-IV grade had significantly higher risk scores than those with T1-T2 stage or I-II grade (Fig. 5b, c) (p < 0.001, Wilcox test). Survival analysis across different clinical subgroups consistently indicated worse prognosis for the high-risk group (Supplementary Fig. 3b-h), demonstrating that the model retains predictive value across various clinical feature subgroups. Further univariate and multivariate Cox regression analyses revealed that the risk score is an independent prognostic factor for HCC (Fig. 5d, e).
Exploring the molecular mechanisms related to prognosis associated with anoikis-related risk scores
To further explore the molecular mechanisms between risk scores and prognosis, we conducted a functional enrichment analysis on TCGA data. Utilizing the Hallmark Gene Sets for GSEA analysis, we found that pathways enriched in the high-risk group primarily included HALLMARK_E2F_TARGETS, HALLMARK_EPITHELIAL_MESENCHYMAL_TRANSITION, and HALLMARK_G2M_CHECKPOINT, whereas the low-risk group was mainly enriched in pathways such as HALLMARK_BILE_ACID_METABOLISM, HALLMARK_COAGULATION, and HALLMARK_FATTY_ACID_METABOLISM (Figs. 6a, b). Further analysis using GSVA on TCGA expression data, followed by differential analysis with the "Limma" R package, showed significant enrichment in cancer-related pathways including HALLMARK_G2M_CHECKPOINT, HALLMARK_MITOTIC_SPINDLE, HALLMARK_E2F_TARGETS, and HALLMARK_MYC_TARGETS_V1 in the high-risk group, and in metabolic process-related pathways such as HALLMARK_FATTY_ACID_METABOLISM, HALLMARK_BILE_ACID_METABOLISM, and HALLMARK_XENOBIOTIC_METABOLISM in the low-risk group (Fig. 6c). These findings suggest a strong correlation between model scores and biological processes related to cancer. Further prognostic analysis of the Hallmark pathways revealed that pathways positively correlated with model scores, such as HALLMARK_G2M_CHECKPOINT, HALLMARK_E2F_TARGETS, and HALLMARK_MYC_TARGETS_V1, are associated with poor prognosis (Figs. 6d, e). Conversely, pathways negatively correlated with model scores, like HALLMARK_FATTY_ACID_METABOLISM, are associated with better prognosis, revealing a connection between the activation status of these pathways and disease prognosis.
Analysis of the genetic mutation landscape across risk subgroups
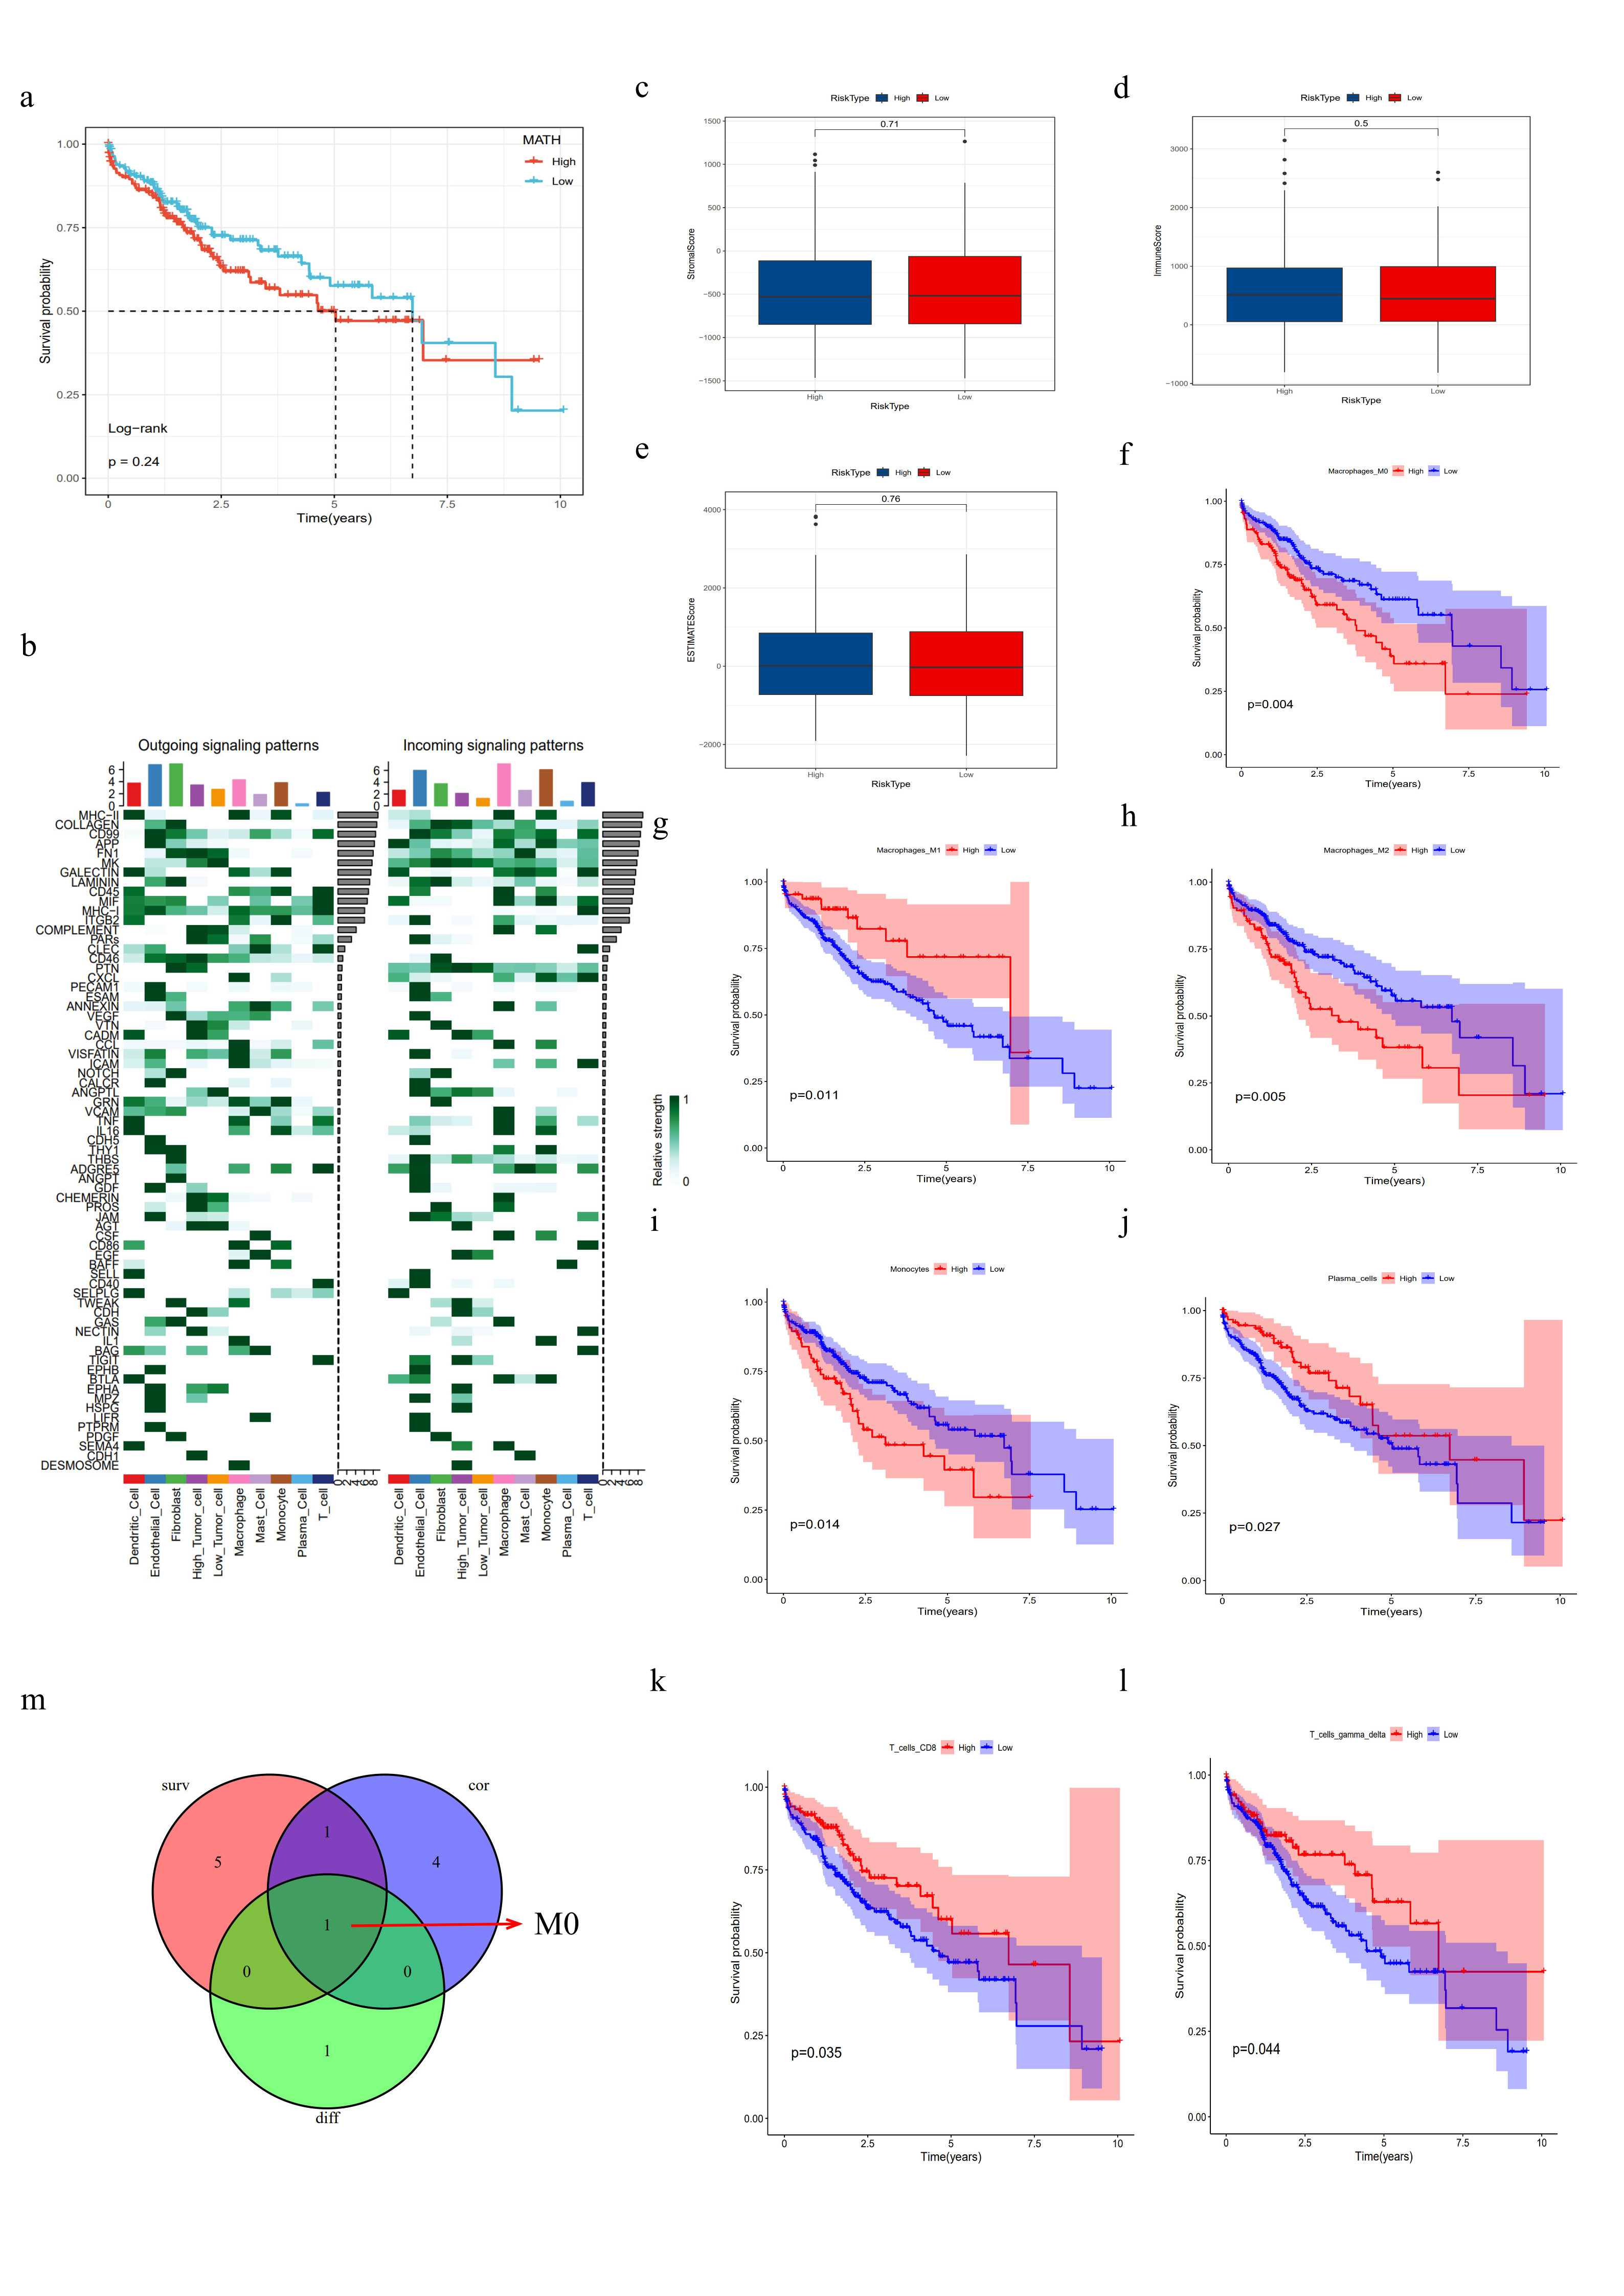
In this study, we employed the Mutant-Allele Tumor Heterogeneity (MATH) algorithm to assess intra-tumor heterogeneity (ITH) in patients from the TCGA cohort, with higher MATH scores indicating greater ITH. Our analysis revealed significant differences in MATH scores between different risk subgroups (Fig. 7a). However, MATH scores alone did not show a significant correlation with patient prognosis (Supplementary Fig. 4a). When combining MATH scores with our risk model, we found that patients with high MATH scores and high risk had significantly worse prognoses compared to those with low MATH scores and low risk (Fig. 7b, log-rank test, p < 0.0001).
Additionally, we utilized the "Maftools" R package[28] to analyze the genetic mutation landscape across different risk subgroups, identifying clear differences between groups (Figs. 7c, d). The TP53 gene, a crucial tumor suppressor regulating cell cycle, apoptosis, aging, and genomic stability[29], showed a mutation rate of 21% in the low-risk group and 35% in the high-risk group, predominantly missense mutations. The ALB gene, liver-specific and known for its encoded albumin inhibiting HCC progression[30, 31], had mutation rates of 8% in the low-risk group and 16% in the high-risk group. The CTNNB1 gene, which encodes a protein regulating cell growth and adhesion and is associated with high tumor differentiation and better prognosis[32], had mutation rates of 22% in the high-risk group and 30% in the low-risk group, further validating our model’s effectiveness in predicting prognosis in HCC.
Some oncogenic drivers may exhibit synergistic mutation patterns, often occurring simultaneously or consecutively, and driving tumor progression[33]. By analyzing co-occurring and exclusive mutations among the top 25 genes in different risk subgroups, we observed more co-occurring mutations in the high-risk group (Figs. 7e, f), suggesting that synergistic interactions among gene mutations may be closely linked to cancer prognosis.
Analysis of AnoRGs and Single-Cell Characteristics
We analyzed the expression patterns of eight genes within the model across different cell types at the single-cell transcriptome level (Fig. 8a). The results showed that SLC2A2 was primarily expressed in hepatic tumor cells, while the other seven genes were mainly expressed in immune cells and endothelial cells. Based on the model scores, tumor cells were classified into high-risk and low-risk groups. Further analysis of intercellular interactions among tumor cells in different risk groups revealed that high-risk tumor cells exhibited stronger interactions and higher cell numbers with fibroblasts and endothelial cells (Fig. 8b). By using R package CellChat to simulate ligand-receptor interactions between different cell types, we generated a heatmap of intercellular interaction networks (Supplementary Fig. 4). The findings indicated that high-risk tumor cells played a more significant role in cell communication involving BAG, DESMOSOME, PTN, SEMA4, and TNF molecules (Figs. 8c-g), whereas the MIF signaling pathway was predominantly involved in ligand-receptor interactions between low-risk tumor cells and other cell types (Fig. 8h).
Immunomicroenvironment Analysis
First, we used the ESTIMATE algorithm to calculate the stromal score, immune score, and ESTIMATE score for the risk subgroups, finding no significant differences between the subgroups (Supplementary Fig. 4c-e). Next, using the ssGSEA algorithm, we obtained immune-related pathway scores. The results showed that the high-risk group exhibited higher activity in FcγR-mediated phagocytosis and the NOD-like receptor signaling pathway, while the low-risk group showed higher activity in the complement pathway (Fig. 9a). To further assess the roles of various immune cell infiltrations in different risk subgroups, we used the CIBERSORT tool to predict the proportions of 22 immune cell types based on RNA-seq data from the TCGA database. We found that the high-risk group had higher proportions of activated memory CD4 + T cells and M0 macrophages, whereas the low-risk group had higher proportions of naive B cells, resting NK cells, and resting macrophages (Fig. 9d). Similar results were validated using the ssGSEA method (Fig. 9e).
The correlation heatmap between model genes and immune cell infiltration is shown in Fig. 9b. It indicates a strong correlation between the eight model genes and M0 macrophages. Further, Spearman correlation analysis identified immune cells strongly associated with the model risk genes (p < 0.05) (Fig. 9c), highlighting six types: M0 macrophages, neutrophils, M1 macrophages, resting NK cells, resting macrophages, and naive B cells. Additionally, survival analysis showed that M0 macrophages, M1 macrophages, M2 macrophages, monocytes, plasma cells, CD8 + T cells, and γδ T cells were associated with patient prognosis (p < 0.05, Supplementary Fig. 4f-l). Finally, by intersecting differential analysis, survival analysis, and correlation analysis of immune cells, M0 macrophages were identified as potentially significant in HCC prognosis (Supplementary Fig. 4m). This suggests that M0 macrophages may play a crucial role in the prognosis of HCC.
AnoRGs for Predicting Immune Response and Drug Targets
To investigate the predictive value of the model on patients' responses to immunotherapy, we included the IMvigor210 cohort treated with atezolizumab and scored them according to the risk model. The results showed that the number of complete responses (CR) and partial responses (PR) in the low-risk group was higher than in the high-risk group (Fig. 10a). Additionally, the risk scores of CR/PR patients were significantly lower than those of patients with progressive disease (PD) or stable disease (SD) (Figs. 10b, c), suggesting that the low-risk group has a better response to immunotherapy compared to the high-risk group.
The main targeted therapies for HCC include bevacizumab, sorafenib, lenvatinib, donafenib, and regorafenib. However, due to tumor heterogeneity, drug resistance remains a significant challenge. We used the R package "oncoPredict" to predict drug sensitivity in different risk groups. The results showed differences in drug sensitivity between the risk groups. The high-risk group was more sensitive to Doramapimod, SB505124, IAP_5620, JAK1_8709, and Selumetinib, while the low-risk group showed higher sensitivity to Navitoclax, Axitinib, Wee1 inhibitor, Paclitaxel, and Tozasertib (Fig. 10d). This indicates that patients with different risk scores can select personalized treatment based on drug sensitivity analysis, potentially reducing issues related to drug resistance and improving treatment efficacy.