Characteristics of remotely triggered earthquakes
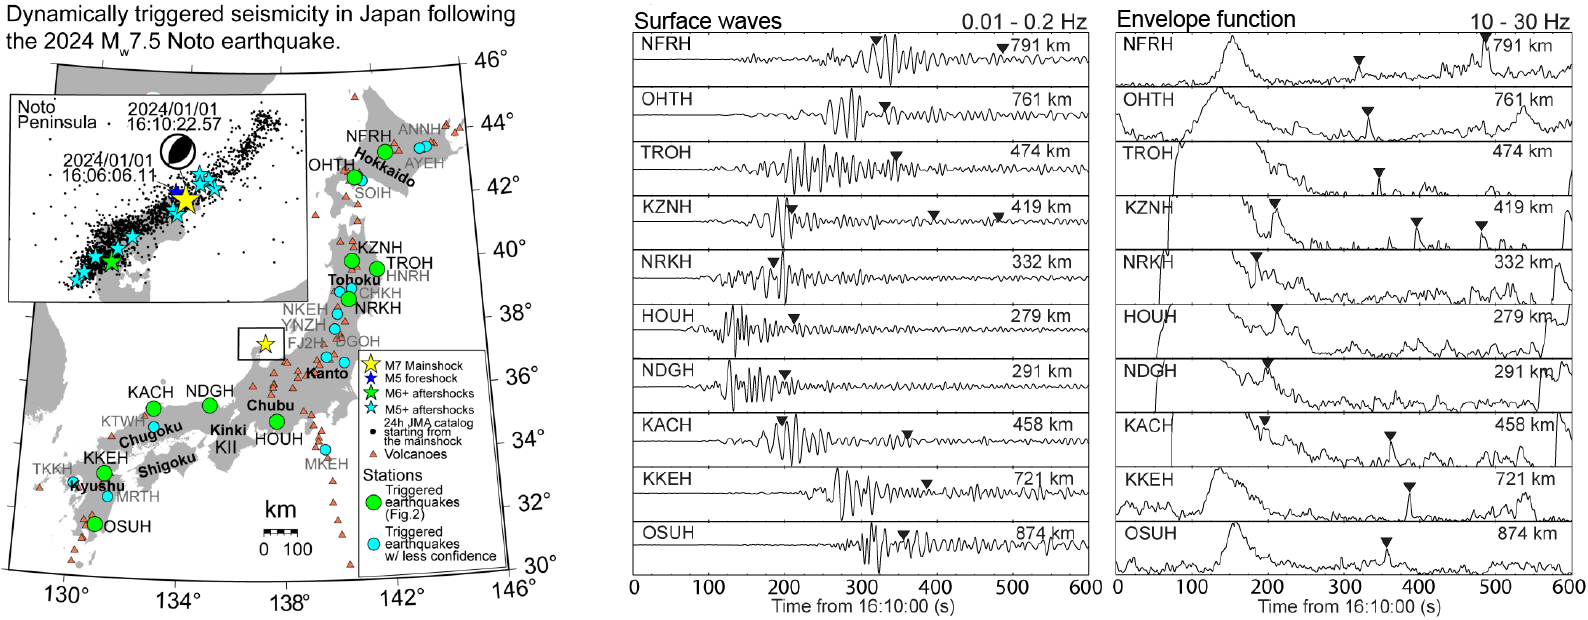
Triggered earthquakes following the 2024 Noto mainshock are mainly observed at or close to active volcanoes (Fig. 1). In central Hokkaido, one triggered earthquake is observed at station NFRH, which is ~ 13 km west of the Tokachi volcano. Another triggered earthquake is observed in Hokkaido at station OHTH (Fig. 1), which is also in a volcanic area (there are five surrounding volcanoes). The distance from station OHTH to the five volcanoes is around 20–25 km. In northern Tohoku, one triggered earthquake is observed at station KZNH, which is 11 km north of Akita-Yakeyama volcano. Next to the Akita-Yakeyama volcano, there are three other volcanoes, the Hachimantai, Iwate and Akita-Komagatake volcanos. After the 2016 Kumamoto earthquake, triggered earthquakes are also observed at five stations near these four volcanoes (Enescu et al., 2016). Additionally, during the passage of surface waves from nine teleseismic events, triggered earthquakes are observed repeatedly in this area (Takeda et al., 2024). In southern Tohoku, triggered earthquakes are observed at station NRKH, which is 15 km northwest of the Naruko volcano and 16 km southeast to the Kurikomayama volcano. During the Kumamoto earthquake, there is also a triggered earthquake observed in this area, but only at one station (Enescu et al., 2016). In the Chugoku region, one triggered earthquake was observed 34 km northeast of the Sabe volcano at station KACH. During the Kumamoto earthquake one triggered earthquake was also observed near the Sabe volcano but was located to the southwest (Enescu et al., 2016). In Kyushu, two triggered earthquakes are observed. One triggered earthquake is in northern Kyushu, at station KKEH which is 16 km west of the Yufu volcano. The other one is observed at station OSUH, which is 25 km southeast of the Wakamiko volcano. Both regions were triggered during the passage of surface waves from the 2011 Tohoku-Oki earthquake (Miyazawa, 2011).
In summary, remote triggering of microearthquakes following the 2024 Noto mainshock is mostly observed in volcanic regions, confirming previous research that shows such places are relatively easy to be activated dynamically, likely due to the excitation of fluids by the passage of mainshock surface waves (e.g., Hill and Prejean, 2015). In non-volcanic areas, triggered earthquakes are observed at stations TROH in northern Tohoku, HOUH in Chubu, and NDGH in Kinki region. At both HOUH and NDGH stations, triggered earthquakes were also observed during the passage of surface waves from Kumamoto earthquake (Enescu et al., 2016). Such repeated activation may indicate faults where the state-of-stress is close to the threshold of earthquake nucleation.
The predominant frequencies that are responsible for triggering earthquakes in this study are around 0.05–0.2 Hz (5–20 s), with a maximum spectral amplitude of around 10 m/s/Hz (Fig. 5). These predominant frequencies are consistent with those reported in the case of the triggered earthquakes following the 2016 Kumamoto earthquake (0.05–0.1 Hz; Enescu et al., 2016).
As in other dynamic triggering cases (i.e., Miyazawa, 2011; Enescu et al., 2016), an earthquake triggering front is also apparent in the case of the 2024 Noto earthquake which agrees with the surface wave propagating front (Fig. 3). The PGV values during the surface wave arrivals at the recording stations are equal to or larger than 0.17 cm/s, similar to those observed in the case of the Kumamoto earthquake, which were typically above 0.20 cm/s. One exception is in Hokkaido, where at one station, the PGV is of around 0.1 cm/s (Enescu et al., 2016).
It is also interesting to note that the PGVs caused by the 2016 Kumamoto mainshock observed in the Noto Peninsula, which triggered earthquakes, are in the range of 0.34–0.72 cm/s (~ 24–56 kPa) (Enescu et al., 2016). However, in the case of the larger 2024 Mw 7.5 Noto earthquake, the observed PGV in the Kumamoto region, caused by the Noto mainshock that triggered earthquakes is in the range of 0.20–0.52 cm/s (15–38 kPa). One possible explanation is that the Kumamoto earthquake is a strike-slip event while the Noto earthquake is a thrust event. Although the surface waves from both earthquakes traveled about the same distance, the 2016 Kumamoto earthquake was characterized by relatively strong Love wave shaking (Enescu et al., 2016), which is consistent with previous studies reporting that strike-slip events might have more energetic Love waves (Choy and Boatwright, 1995; Fukao and Abe, 1971). The relatively strong Love waves in the case of the Kumamoto earthquakes might be also responsible for the widespread seismicity activation, at distances as large as ~ 1650 km (Enescu et al., 2016). Similarly, a global transient increase of M > 5 events were found following the 2012 M8.6 and M8.2 Indian Ocean earthquake, which were also large strike-slip events, highlighting the importance of Love waves in triggering small to moderate-size earthquakes (Pollitz et al., 2012).
Magnitude estimations for the triggered earthquakes
So far, we did not explicitly discuss the magnitudes of the triggered earthquakes in this paper since, in general, they are recorded by a small number of stations and overlap on seismograms with the arrival of the mainshock surface waves, thus magnitude estimations may have a large degree of uncertainty and tend to be overestimated (Takeda et al., 2024, and references therein). To get some rough estimates for the magnitudes, we used the earthquakes that are recorded in the JMA catalog as reference. When a triggered earthquake has the same “tS-tP” and same S-wave amplitude as a JMA-catalog earthquake, at a recording station, we assign the triggered earthquake the same magnitude as that of the JMA-catalog event. Most of the dynamically triggered earthquakes have magnitudes around M1.0-M1.7, with one exception of the mainshock-triggered earthquake at station NRKH, which has a magnitude of around M2.3. Since these dynamically triggered earthquakes are only recorded at a single station, the magnitude estimations should be regarded with caution. Note that most of the triggered earthquakes we detected are not recorded in the JMA catalog, highlighting the importance of examining high-frequency radiations of continuous waveforms for identifying those triggered earthquakes.
Possible triggering by the Mw5.3 Noto foreshock
Four minutes before the Noto mainshock, an Mw 5.3 foreshock occurred 3 km northwest to the mainshock's epicenter. During the passage of both the foreshock and mainshock surface waves, triggered earthquakes are observed at station NRKH in the Tohoku region (Fig. 3 and S3). The PGV of the foreshock-triggered earthquake is around 300 nm/s while for the mainshock-triggered earthquake is around 3000 nm/s (Figure S3c and S3d). The calculated stress change caused by the passage of the mainshock’s surface wave is around 49–53 kPa, and the foreshock’s surface wave is around 0.15–0.16 kPa (Figure S2). Because the potential foreshock-triggered event is observed at a single station, it is difficult to carry out statistical tests to validate its identity. We investigated around 90 Mw5.2 ± 0.2 earthquakes occurred in Japan after 2011 and found a few possible triggering cases at the same station NRKH. However, due to low signal-noise ratio, only one triggered earthquake shows clear P and S arrivals (Figure S4). Since the cases of having such a low threshold (~ 0.1–0.2 kPa) triggering earthquake is rare, but still possible (i.e., Takeda et al., 2024; Gonzalez-Huizar et al., 2012; van der Elst and Brodsky, 2010), further systematic analysis is needed to draw a definite conclusion. We further calculate an approximate probability of the observed (potentially triggered) earthquake to be a background earthquake, using the following procedure. First, we choose a 20 x 20 km rectangular region with the station NRKH in the center. Next, we calculate the mean occurrence rate of an M1.0 earthquake in this region using the shallow earthquakes (depth ≤ 20 km) recorded by the JMA catalog in the past 20 years. Since this time interval is much longer than the usual span of energetic aftershock sequences, we consider this rate to be a first-order approximation of a background rate. Then, we calculate the Poisson probability of having this M1.0 event as a background seismicity event (e.g., Stein and Wysession, 2009) within an 1-hour window which is 0.45%. Assuming we overestimated the magnitude, we also calculate the probability of having an M0.5 event as a background earthquake in the 1-hour window, which is 0.74%. Overall, the probability of being a background event is very low suggesting that the probability of this event to be a triggering earthquake is high.
Seismicity changes according to the Japan Meteorological Agency (JMA) catalog
We have also inspected the JMA earthquake catalog to check for any significant changes in seismicity 1 day (Figure S5a) and 1 hour (Figure S5b) before and after the 2024 Noto earthquake. A clear increase in seismicity occurred around 100 km southeast of the mainshock close to the Midagahara volcano in Chubu (Figure S5a). Within 24 hours after the Noto earthquake, 22 earthquakes occurred in this region, while within the 24 hours before the mainshock there were no earthquakes in this area. Among the 22 earthquakes, the earliest and largest earthquake is an M4.0 event that occurred around 30 min. after the mainshock (Figure S5c). We calculated the static stress change in this area on specific receiver faults using the slip model estimated by Okuwaki et al. (2024) and the algorithm of Wang et al. (2021). The receiver fault is chosen based on the location of the observed seismicity increase, with fault information (strike, dip, rake) provided by the National Institute of Advanced Industrial Science and Technology of Japan (https://gbank.gsj.jp/activefault/search). In the Midagahara volcanic area, the static stress change has values from ~ 40–70 kPa (as estimated for various depths from 8–18 km), which is smaller than the dynamic stress change (more than 100 kPa) estimated for this area. Nevertheless, since we do not observe any instantaneous triggering following the mainshock for this area, we hypothesize that the triggering is more likely static (Belardinelli et al., 2003). Farther from the epicentral region, no other obvious increase is found. In the Tohoku and Hokkaido volcanic areas (Figures S5a), the earthquakes occurred after the Noto mainshock (dark blue dots) are more numerous than before (orange dots) the mainshock. However, the trend is less significant compared with the increase in the Midagahara volcano area.
We are also interested in the longer-term activation pattern following the 2024 Noto earthquake. Therefore, we computed the β-values following the same approach as Reasenberg and Simpson (1992), for a period of 30 days before and after the Noto mainshock using inland earthquakes with depths shallower than or equal to 20 km and magnitudes M ≥ 1.0 and shallow (depth ≤ 20 km) offshore earthquakes on the side of Japan Sea. Figures S6a and S6b present maps with the earthquake epicentral distribution and β-value, respectively. The β-value statistics should be interpreted cautiously when comparing non-Poisson sequences (Reasenberg and Simpson, 1992), however it does correctly identify two areas of clear seismicity change (Figure S6b). Region A is obviously activated since it is the aftershock area of the 2024 Noto earthquake (Figure S6c). Region B (in Tohoku region) has a clear seismicity increase starting about one week after the Noto mainshock, however, the plot in Figure S6d, as well as the early dynamic triggering detected in the area (station KZNH) may indicate that some subtle changes started earlier, probably immediately after the Noto earthquake.
Limitations of current research and improvements to be considered in the future
In this study we have used visual inspection to identify triggered earthquakes. In the future, we are planning to apply machine-learning based methods (e.g., Zhu and Beroza, 2019) and matched-filter techniques (e.g., Peng and Zhao, 2009) that might produce more uniform, enhanced and objective earthquake detections. We note that while such methods may have advantages compared to the visual inspection used in this study, they also have requirements that might be sometimes difficult to fulfill, like proper training using local data for the machine learning algorithms and the availability of events that can be used as templates for the matched-filter technique. We are going to explore the advantages and limitations of each method in a future study.
Improvements of using latest techniques to quantify the dynamic triggering (e.g., Wang et al., 2018; Miyazawa et al., 2021; DeSalvio and Fan, 2023) and estimating the dynamic stress changes (e.g., Yoshida et al., 2020) will also be considered.