3.1 Descriptive Statistics
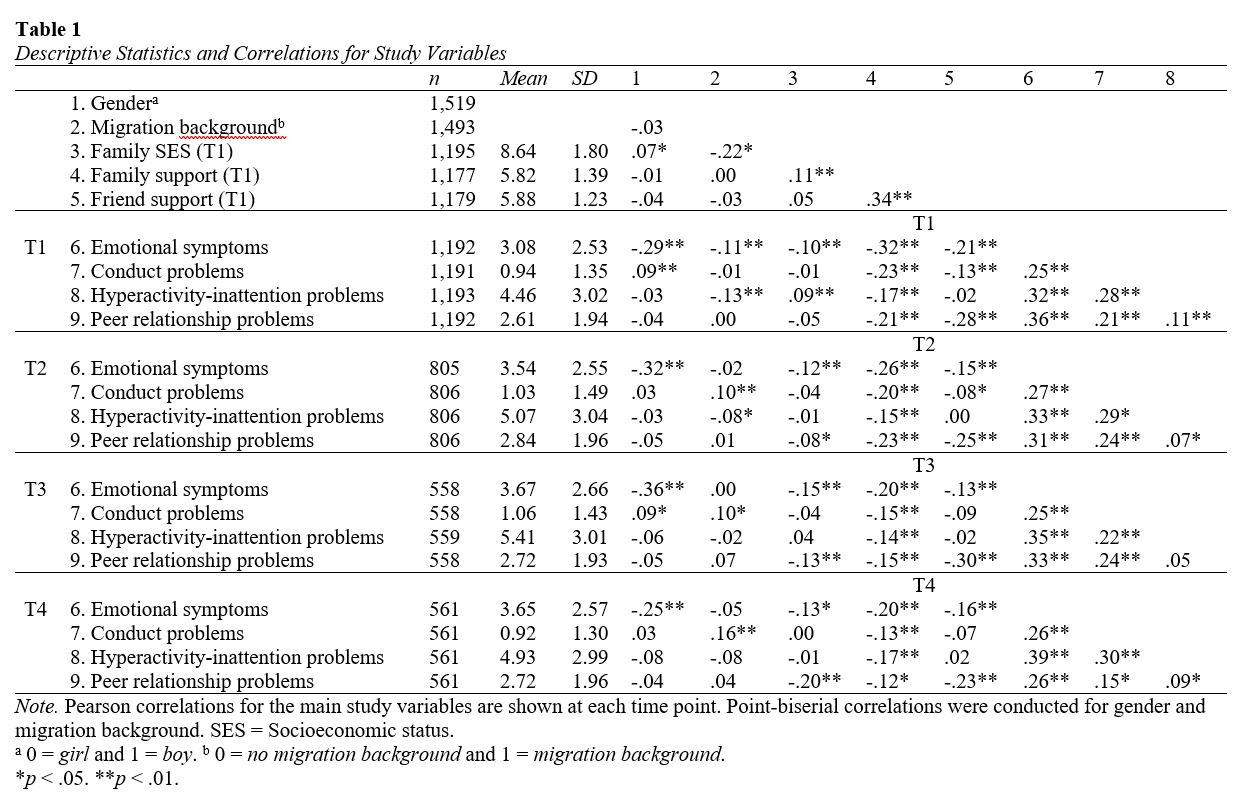
Table 1 shows the descriptive statistics and correlations for all study variables at the different measurement points. Girls reported more emotional symptoms than boys. Adolescents with a migration background reported more conduct problems than adolescents without such a background, and adolescents from lower SES families reported higher levels of emotional symptoms and peer relationship problems. Furthermore, more family support was related to lower levels of emotional symptoms, conduct problems, hyperactivity-inattention problems, and peer relationship problems. More friend support was related to lower levels of emotional symptoms and peer relationship problems. All four indicators of mental health problems were positively associated with each other within waves.
3.2 Emotional Symptoms Trajectories
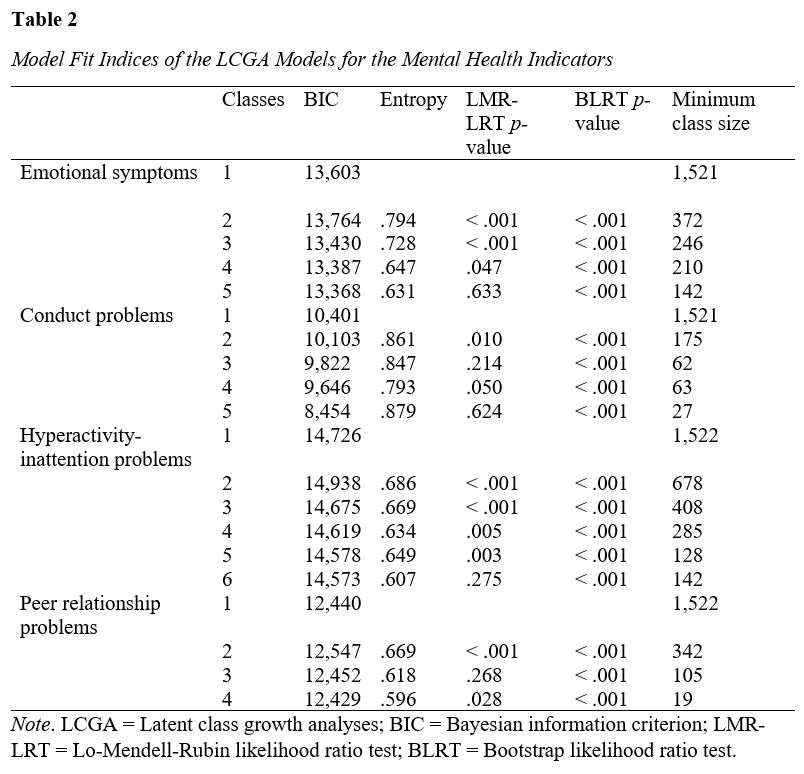
Emotional symptoms showed a nonlinear course over the four waves, as indicated by the significant chi-square difference test, suggesting that the quadratic growth model fitted the data better than the linear growth model, Δχ2 (1) = 16.59, p < .001. The two- to four-class models showed relatively good fit as indicated by lower BIC values, and significant LMR-LRT and BLRT values (p < .05, Table 2), suggesting that a model with more classes fits the data better. A five-class model did not improve the model according to the LMR-LRT (p = .633). Compared to the four-class model, the five-class model separated one class into two classes that shared similar patterns. Thus, based on the fit indices and the criterion that classes should be substantively interpretable as distinguishable classes, the four-class model was selected for further analyses.
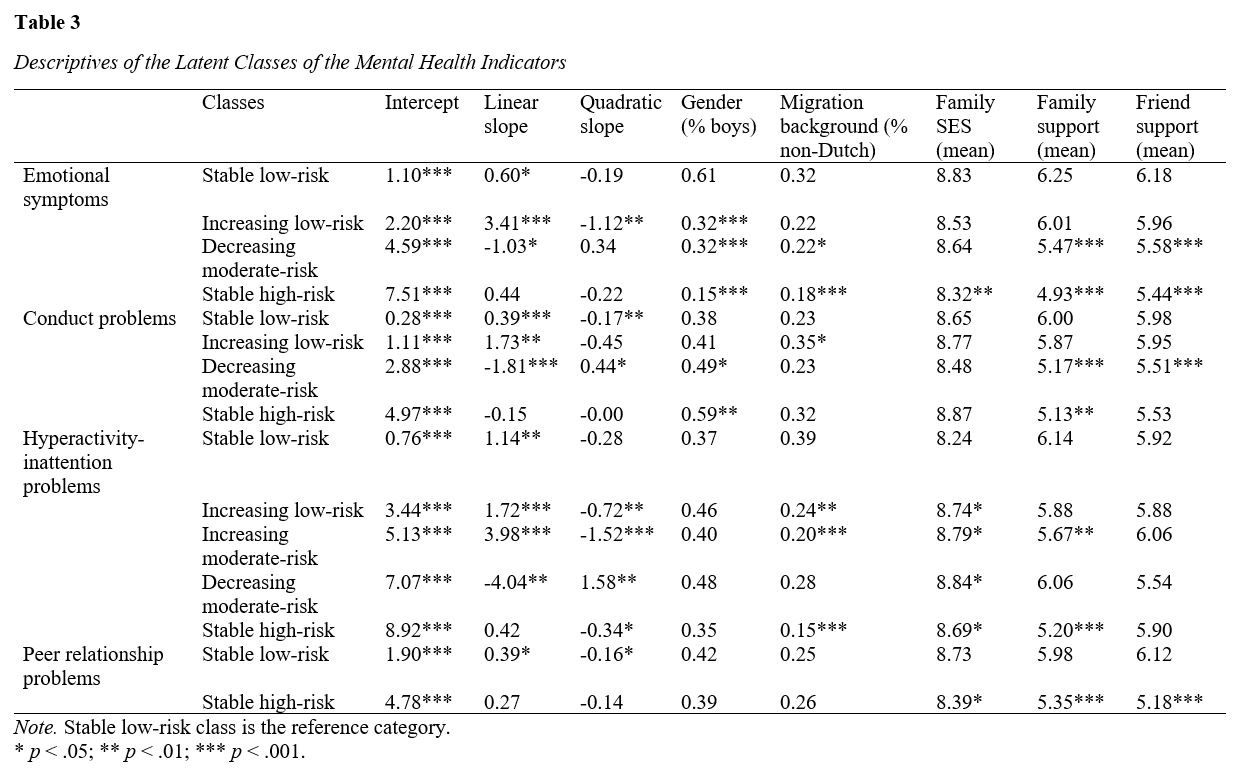
Figure 1 depicts the four trajectories of adolescents’ emotional symptoms. Almost half of the adolescents fell into the stable low-risk group (46%), characterized by minimal emotional symptoms before and during the pandemic (Table 3). The increasing low-risk group (16%) showed low levels of emotional symptoms before the pandemic but an increase during the pandemic that leveled off over time. The decreasing moderate-risk group (24%) consisted of adolescents with moderate levels of emotional symptoms before the pandemic that decreased during the pandemic. Finally, the stable high-risk group (14%) reported high levels of emotional symptoms before and during the pandemic.
Adolescents in the increasing low-risk group did not differ from the stable low-risk group, except for a higher proportion of girls. The decreasing moderate-risk and stable high-risk groups also were more likely to be girls. Additionally, adolescents in both trajectories were less likely to have a migration background and perceived less family and friend support than adolescents in the stable low-risk group. Moreover, adolescents in the stable high-risk group had a lower family SES than adolescents in the stable low-risk group.
3.3 Conduct Problems Trajectories
Similar to emotional symptoms, the quadratic growth model showed a better fit for conduct problems than the linear growth model, Δχ2 (1) = 5.85, p = .016. The two- to four-class models of conduct problems showed a relatively good fit as indicated by lower BIC and significant BLRT values (p < .001, Table 2), suggesting that a model with more classes fits the data better. A three-class model did not improve the model fit over a two-class model according to the LMR-LRT (p = .214). However, a four-class model yielded a marginally significant LMR-LRT value, suggesting that a four-class model may fit the data better than the three-class model (p = .050). Moreover, the four-class model separated one class in the three-class model that had stable conduct problems, into a class with increasing and a class with decreasing conduct problems. To avoid neglecting distinguishable classes, we selected the four-class model for further analyses.
Figure 1 depicts the four trajectories of adolescents’ conduct problems. Most adolescents fell into the stable low-risk group (73%), exhibiting no conduct problems before and during the pandemic (Table 3). The increasing low-risk group (9%) reported relatively few conduct problems before the pandemic, but these increased during the pandemic. The decreasing moderate-risk group (14%) showed moderate levels of pre-pandemic conduct problems which decreased during the pandemic and flattened over time. Finally, a small group (4%) reported high levels of conduct problems before and during the pandemic and was considered as the stable high-risk group.
Adolescents in the increasing low-risk group did not differ from those in the stable low-risk group, except for a higher likelihood of having a migration background. Compared to the stable low-risk group, adolescents in the decreasing moderate-risk and stable high-risk groups were more likely to be boys and perceived less family support. Additionally, adolescents in the decreasing moderate-risk group perceived less friend support than adolescents in the stable low-risk group.
3.4 Hyperactivity-Inattention Problems Trajectories
For hyperactivity-inattention problems, the quadratic growth model again showed a better fit than the linear growth model, Δχ2 (4) = 42.83, p < .001. The model fit improved with an increasing number of classes, as shown by decreasing BIC values and significant BLRT values (p < .001, Table 2). However, the six-class model did not improve the model according to the LMR-LRT (p = .275), and the decrease in BIC was relatively small. Therefore, the five-class model was selected for further analyses.
Figure 1 depicts the five trajectories of adolescents’ hyperactivity-inattention problems. The stable low-risk group (24%) reported minimal hyperactivity-inattention problems before the pandemic, which slightly increased during the pandemic (Table 3). The increasing low-risk group (31%) and increasing moderate-risk group (18%) had different levels of hyperactivity-inattention problems before the pandemic, but both showed an increase during the pandemic that leveled off over time. The decreasing moderate-risk group (8%) showed relatively high levels of pre-pandemic hyperactivity-inattention problems, which decreased during the pandemic and leveled off over time. Finally, the stable high-risk group (19%) reported high levels of hyperactivity-inattention problems before and during the pandemic with a slight decrease after the third wave.
Adolescents in the increasing low-risk and increasing moderate-risk groups were less likely to have a migration background and had higher family SES than adolescents in the stable low-risk group. Additionally, the increasing moderate-risk group perceived less family support than the stable low-risk group. Adolescents in the decreasing moderate-risk and stable low-risk groups were quite similar and only differed in terms of family SES, with the decreasing moderate-risk group originating from higher SES family. Compared to the stable low-risk group, adolescents in the high-risk group were less likely to have a migration background, had higher family SES, and perceived less family support.
3.5 Peer Relationship Problems Trajectories
Lastly, the quadratic model for peer relationship problems also showed a better fit than the linear growth model, Δχ2 (1) = 5.67, p = .017. A two-class model showed improved model fit based on a lower BIC value and significant LMR-LRT and BLRT values (p < .001, Table 2). A three-class model did not improve the model according to a non-significant LMR-LRT (p = .268). Although a four-class model fitted the data significantly better than a three-class model, one class consisted of only 19 participants, which did not meet our criteria of n > 50. Therefore, we selected the two-class model for further analyses.
Figure 1 depicts the two trajectories of adolescents’ peer relationship problems. Most adolescents fell into the stable low-risk group (73%) and showed low levels of peer relationship problems before the pandemic but a slight increase during the pandemic which levelled off over time (Table 3). Adolescents in the stable high-risk group (27%) reported relatively high levels of peer relationship problems before and during the pandemic. No differences in gender and migration background were found between the two groups. However, compared to the stable low-risk group, adolescents in the stable high-risk group originated from lower SES families and perceived less family and friend support.