2.1 Materials
GelMA granules synthesized from type A gelatin from porcine skin (15–400 kDa, gel strength ~ 300) were kindly provided by 3D Materials Co., Ltd. (Anyang-si, Republic of Korea). 2-hydroxy-4′-(2-hydroxyethoxy)-2-methyl-propiophenone (Irgacure 2959) was obtained from TCI Co., Tokyo, Japan. Polyacrylonitrile (150 kDa) and N, N-dimethyl formamide (DMF, 99.8%) were obtained from Sigma-Aldrich. The solvents used were of analytical grades, and the chemicals obtained were utilized without further purification.
2.2 Preparation of CNF NPs
We prepared CNF NPs following the procedures mentioned in our previous work [24]. In brief, 10% (w/v) of PAN solution in DMF was taken into a 10-mL syringe to prepare electrospun nanofiber mats. The distance between the needle tip and the aluminum foil collector was 10 cm. During electrospinning, the flow rate of solution, applied voltage, and rotor speed were 0.8 mL/h, 15 kV, and 1000 rpm, respectively. The temperature and humidity maintained in the chamber were 25°C and 35%, respectively. The as-prepared nanofiber mat was subjected to subsequent processes to produce CNF NPs: heat-stabilization in open air (2 h, 280°C), calcination treatment (1 h, 800°C, 5°C/min) under nitrogen gas atmosphere, and manual grinding using a pestle and mortar. The impurities of nanoparticles were removed by washing with acetone and subsequently dried in a hot air oven at 100°C. The air-dried nanoparticles were then stored at room temperature until further use for characterization.
2.3 Fabrication of GelMA-CNF NPs printed constructs
0.1 g of GelMA (5%, w/v) was dissolved in 1.5 mL of DMEM, and freshly prepared 0.4% of irgacure solution (30 µL of EtOH and 70 µL of DMEM) was added to it. Subsequently, 0.4 mL of cell-containing DMEM was added. Aliquots of CNF NPs solution (20 mg/mL) were mixed to have a final concentration of 0, 50, 100, and 150 µg/mL in the total volume (2 mL) of bioink precursor solution. The respective samples were labeled as GelMA, GM50, GM100, and GM150, as shown in Table 1.
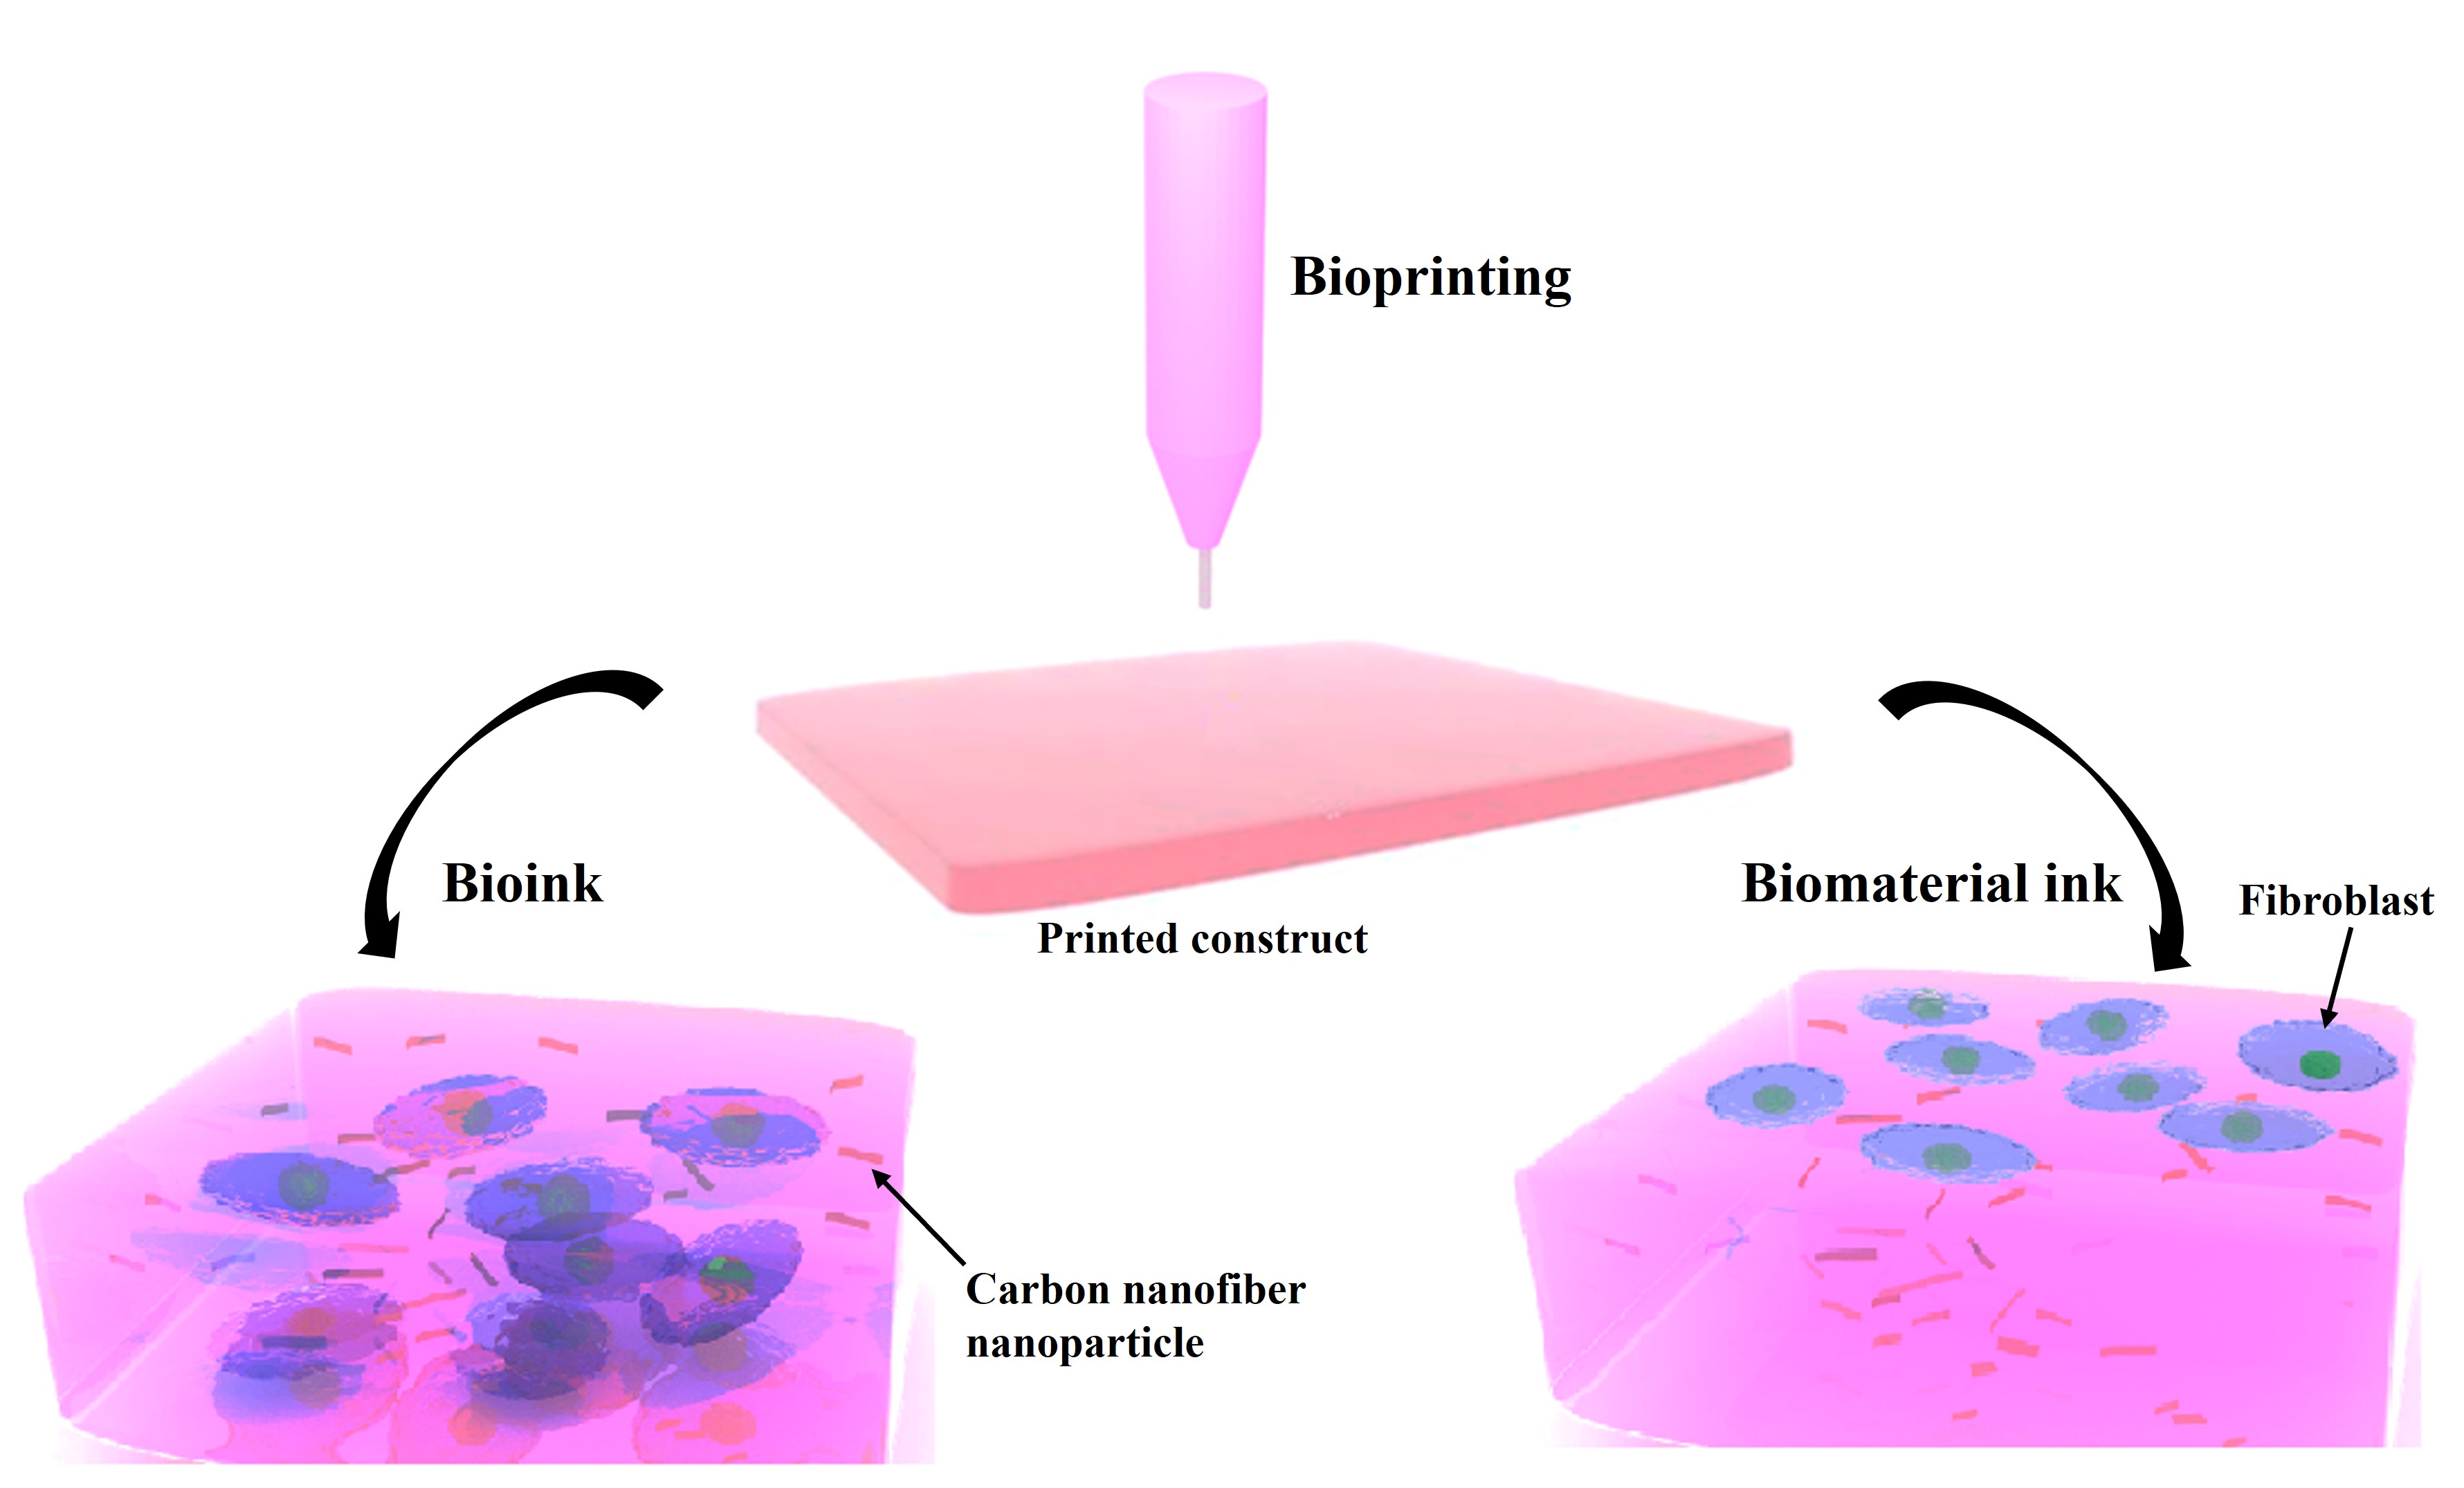
Film-like printed tissue constructs of GelMA-CNF NPs were fabricated in a 6-well plate using an extrusion-based 3D bioprinter (BioX, Cellink, Sweden). Before extrusion, the cell-laden printable ink was pre-cooled for 8 min at 4°C in a refrigerator. The bioprinting parameters were as follows: print bed temperature, 10°C; pneumatic pressure, 60 kPa; nozzle gauge, 20 G-type; printing speed, 2.6 mm/s speed; grid pattern infill density, 100%; single layer, 20 mm × 20 mm × 1 mm; gel setting time after UV-curing, 5 min. The population of nHDF cells was 5 x 10⁵ cells/mL. As shown in Fig. 1, the cells were incubated with CNF NPs in bioink before bioprinting, whereas the cells were seeded on biomaterial ink after fabrication. The UV-curing time was optimized by printing GelMA bioink by varying UV exposure times to 2, 3, 4, and 5 min with a wavelength of 465 nm before the preparation of nanoparticle-containing ink.
Table 1
The composition of GelMA-CNF NPs in the printable precursor solutions and their respective labels have been listed.
| GelMA (w/v) | Irgacure (w/v) | CNF NPs (µg/mL) | Volume of ink precursors (mL) | Label |
| 5% | 0.4% | 0 | 2 | GelMA |
| 5% | 0.4% | 50 | 2 | GM50 |
| 5% | 0.4% | 100 | 2 | GM100 |
| 5% | 0.4% | 150 | 2 | GM150 |
2.4 Cells maintenance
The nHDF cell line was procured from the American Type Culture Collection (ATCC, Rockville, MD), and the cultivation of cells was processed in complete Dulbecco’s modified Eagle’s medium (DMEM, Welgene, Daegu, Korea) augmented with 10% fetal bovine serum (FBS, Welgene, Daegu, Korea) and 1% penicillin-streptomycin solution. The cells were maintained in an incubator at 37°C with a 5% CO2 atmosphere. The media was refreshed every 48 h. The constructs were transferred to another 6-well plate after 12 h of cell incubation, as there may be some leakage of cells into the surrounding area that disturbs the cell measurement results.
2.5 Measurement of cell viability in printed constructs
The cells in the printed constructs were grown for different periods, i.e., 1, 4, and 7 days (bioink) or 2, 4, and 6 days (biomaterial ink), and the cell viability of nHDF cells was determined using the cell counting kit-8 (CCK-8, Boya Biotech, China). For the CCK assay, the reagent solution was prepared by mixing CCK-8 with DMEM in a proportion of 1:9 (v/v). The culture medium of tissue constructs was replaced by 2 mL of CCK reagent solution. After incubation in the cell maintenance chamber for 1.5 h, 100 µL of the supernatant was transferred to a 96-well plate. The absorbance was recorded at 450 nm using a microplate reader.
Fluorescent and confocal laser scanning microscope (CLSM 800, Zeiss, Germany) images were captured to observe the number of viable cells and the 3D view of cell distribution in printed constructs, respectively. A BX51M optical microscope (Olympus Co., Japan) supplied with a fluorescence light source and filters was utilized to monitor optical and fluorescent images. For visualizing fluorescent images, the samples were stained with a dye mixture of calcein-AM and ethidium homodimer-1 to identify live and dead cells, respectively. In the case of CLSM images, the samples were washed using PBS, and the cells were fixed in buffered formalin for 15 min. Then, the cells were subjected to permeabilization using 0.5% Triton X-100 (10 min) and blocking using 2.5% bovine serum albumin (10 min). Subsequently, the samples were incubated with 2 mL of a dye mixture of DAPI and rhodamine B for 20 min to stain the nuclei and cytoplasm, respectively.
2.6 Instrumental characterizations
Attenuated total reflectance-Fourier transform infrared (ATR-FTIR) spectra of the samples were measured in the wavelength range of 4000 to 600 cm⁻1 using a FTIR spectrum GX (PerkinElmer Inc., Waltham, MA). Field emission Scanning electron micrographs (FESEM, Zeiss Supra-40) of the lyophilized samples were captured with a 10 kV voltage. The specimen preparation for SEM involves stubbing the samples on carbon tape and subsequently sputter-coating to apply an electroconductive platinum layer. The size of the nanoparticles was measured using Image J software (Version 1.41). Alternative current (AC) impedance analyses of the printed ink samples (without cells) were carried out using a CH instrumental electrochemical analyzer (CHI-model 660D, U.S.A.) in PBS medium using the frequency range of 10–2 to 105 Hz. The wet GelMA-CNF NPs biomaterial constructs acted as working electrodes. Platinum wire and saturated calomel were the counter and reference electrodes, respectively. The initial electric field (E) in AC impedance measurement was obtained from the open-circuit potential value of the experimental set-up [27].
2.7 Statistical analysis
All the qualitative data were presented with a mean ± standard deviation from the results of at least three independent experiments. The statistically significant difference (p < 0.05) of different groups compared with control was provided using the one-way ANOVA method with a post-hoc Tukey test.