Screening of differentially expressed RBP genes in HCC samples
We selected 15 HCC patients from the dataset GSE77509 to conduct DEGs and AS analysis to the transcriptome information of their primary carcinoma, normal adjacent tissure. Subsequently, we screened for differentially expressed RBP genes significantly associated with patient survival rates, leveraging the TCGA database. The comparison of tumor and normal samples using Principal Component Analysis (PCA) demonstrated significant variations derived from values of all identified genes(Fig. 1A). DEG analysis identified 4,744 up-regulated and 4,948 down-regulated DEGs among neoplastic and non-neoplastic tissues, as illustrated in the volcano plot (Fig. 1B). The hierarchical clustering heat map (Fig. 1C) analysis revealed a high degree of regulatory consistency in both CELF6-OE and control samples. We performed an overlap analysis between the detected DEGs data and a catalog of 2,141 RNA-binding proteins (RBPs) retrieved from four previous reports[26–29], as shown in the Venn diagram(Fig. 1D), there were 379 RBP genes being marked as differentially expressed RBPs (DERBPs). Additionally, the dominating biological processes identified in DERBPs according to Gene Ontology (GO) analysis primarily involve the manipulation of ribosomal RNA, suppression of translation, mRNA splicing via spliceosome, and mRNA processing, as displayed as Venn diagram (Fig. 1E).
Alternative splicing events in GSE77509 and survival analysis
We proceeded to investigate the dysregulated AS profiles in tumor versus normal samples within the GSE77509 dataset. The analysis revealed that RASEs in tumor samples could be classified into nine types. Four types exhibited a higher prevalence of RASEs, namely cassette exon, exon skip (ES), alternative 5' splice site (A5SS), and alternative 3' splice site (A3SS) events, with A3SS and A5SS being the most predominant (Fig. 2A). The occurrence of AS events in the tumor and normal groups exhibited a significant difference, as highlighted by PCA(Fig. 2B). Additionally, we constructed a DERBP protein interaction network(Fig. 2C), identifying modules comprising 272 key DERBPs significantly correlated with AS events (correlation ≥ 0.85 or ≤-0.85, P < 0.05). Among these, RBP genes USP39, SNRPA, and SNRPD2 showed the highest number of co-expression pairs with differential AS events. However, SNRPA was ultimately selected as the target RBP gene associated with HCC due to its comprehensive significance.
To investigate the expression profile of SNRPA as well as the prognostic significance of it to HCC, we employed GEPIA2 [30]for gene expression analysis and KM-plotter[31] for a survival analysis. It was noted that the expression of SNRPA exhibited a substantial increase in both tumor and normal tissues around it among Patient samples above ground on data obtained from the TCGA dataset (Fig. 2D left). Moreover, survival analysis via KM-plotter indicated that lower SNRPA levels showed a correlation with extended overall survival (OS) durations among LIHC individuals (Fig. 2D right). A proliferation assay conducted post SNRPA overexpression revealed that SNRPA overexpression significantly enhances HepG2 cell proliferation, and the cell viability reached its peak after 24 hours of transfection with lentivirus in HepG2 cells.(Fig. 2E). These findings suggest that SNRPA contributes to the proliferation of HCC cells and poor prognosis in HCC patients.
The overexpression of SNRPA caused differential gene expression in HepG2 cells
For this study, the protein expression levels of SNRPA were evaluated by Western blot analysis and the result reminded us of a significant increase in SNRPA protein levels within the transfected cells, confirming the successful establishment of our model(Fig. 3A). Following this, we proceeded to generate cDNA libraries for RNA-seq analysis using SNRPA-OE and control cells. The sample produced approximately 73 million paired‑end raw reads in the sequencing outcome. After the initial steps of quality control(eliminating the reads of low-quality and adaptor sequences), approximately 72 million reads of high quality were left for each samples. We subsequently observed that approximately 96% of the reads obtained from each sample were successfully mapped to the GRCh38 genome using HISAT2, with roughly 94% of these aligned reads exhibiting a singular genomic location within the GRCh38 genome(details in Supplementary Table S2). PCA based on FPKM values confirmed that SNRPA overexpression is a fundamental factor driving global gene expression patterns (Fig. 3B). Based on the data of expression level of all genes between each groups, DESeq2 was used to analyse differential expressed genes impacted by SNRPA at transcriptional level and 387 up-regulated genes and 111 down-regulated genes (FC ≥ 2 or ≤ 1/2, P value < 0.05) between SNRPA-OE and normal samples(Supplementary Table S3) were identified, as illustrated in volcano plot (Fig. 3C). And the clustering heatmap(Fig. 3E) of all DEGs showed high consistency among replicates within each group, indicating the reliability of the results.
In order to further investigate the characteristic biological processes of these DEGs, GO enrichment analysis was conducted and it revealed that genes up-regulated following SNRPA overexpression were enriched in biological functions pathways associated with liver cancer diseases(Fig. 3F), such as hypoxia response[32, 33], extracellular matrix organization[34], cell differentiation[35], wound healing response[36], vascular remodeling[37], and cell adhesion[38]. Conversely, down-regulated DEGs exhibited significant enrichment in in pathways such as keratinocyte division, glue cross-linking, negatively regulated peptidase activity, innate immune response, and medium sexual granulocyte degranulation, apoptosis and other biological function pathways. The authors Huang et al.[39] stated that the inhibition of peptidase activity in HCC cells may be associated with apoptosis and phosphorylation.
According to the expression levels of DEGs from samples of SNRPA-OE group, LGALS3[40], PLA2G2A[41], AKR1C1[42], CCL20 [43]in the top 40 were found to be relevant to liver cancer, and INHBB[44], LGALS3, AXL[45] were also found to be linked to the cell differentiation pathway. The expression levels of the above 6 genes were significantly up-regulated. However, the DEG expression of CYP4F2 was confirmed to be significantly decreased, which deserves our attention. To our delight, these genes we confirmed to be consistent with the results of RNA-seq after being verified by RT-qPCR(Fig. 3G). These findings indicate that SNRPA exerts a significant influence on the comprehensive transcriptome profile.
Regulation of AS by SNRPA in HepG2 cell
Next, we further explored the regulatory impact of SNRPA on gene diversification during the development of HCC. Based on RNA-seq data, HISAT2 was untilized to analyse alternative splicing (AS) patterns in SNRPA-OE samples and compared them with NC samples, specifically focusing on splice junctions. A total of 390,716 splicing junctions were detected, with 196,292 novel splice junctions (50.2% of total) and 194,424 known splice junctions identified (details in Supplementary Table S4). Using the ABLas pipeline, we identified 49,961 known RASEs; accounting for 48.18% of total and 53,745 novel RASEs (accounting for 51.82% of total). By implementing a rigorous threshold requirement. We successfully confirmed a set of high-confidence RASEs, comprising a total of 2,316 events between the SNRPA-OE and control groups. These RASEs were categorized into nine types based on their characteristics (details provided in Supplementary Table S5), with cassette exon inclusion/exclusion events as well as mutually exclusive exons skipping/inclusion events showing higher numbers compared to other types (Fig. 4A).
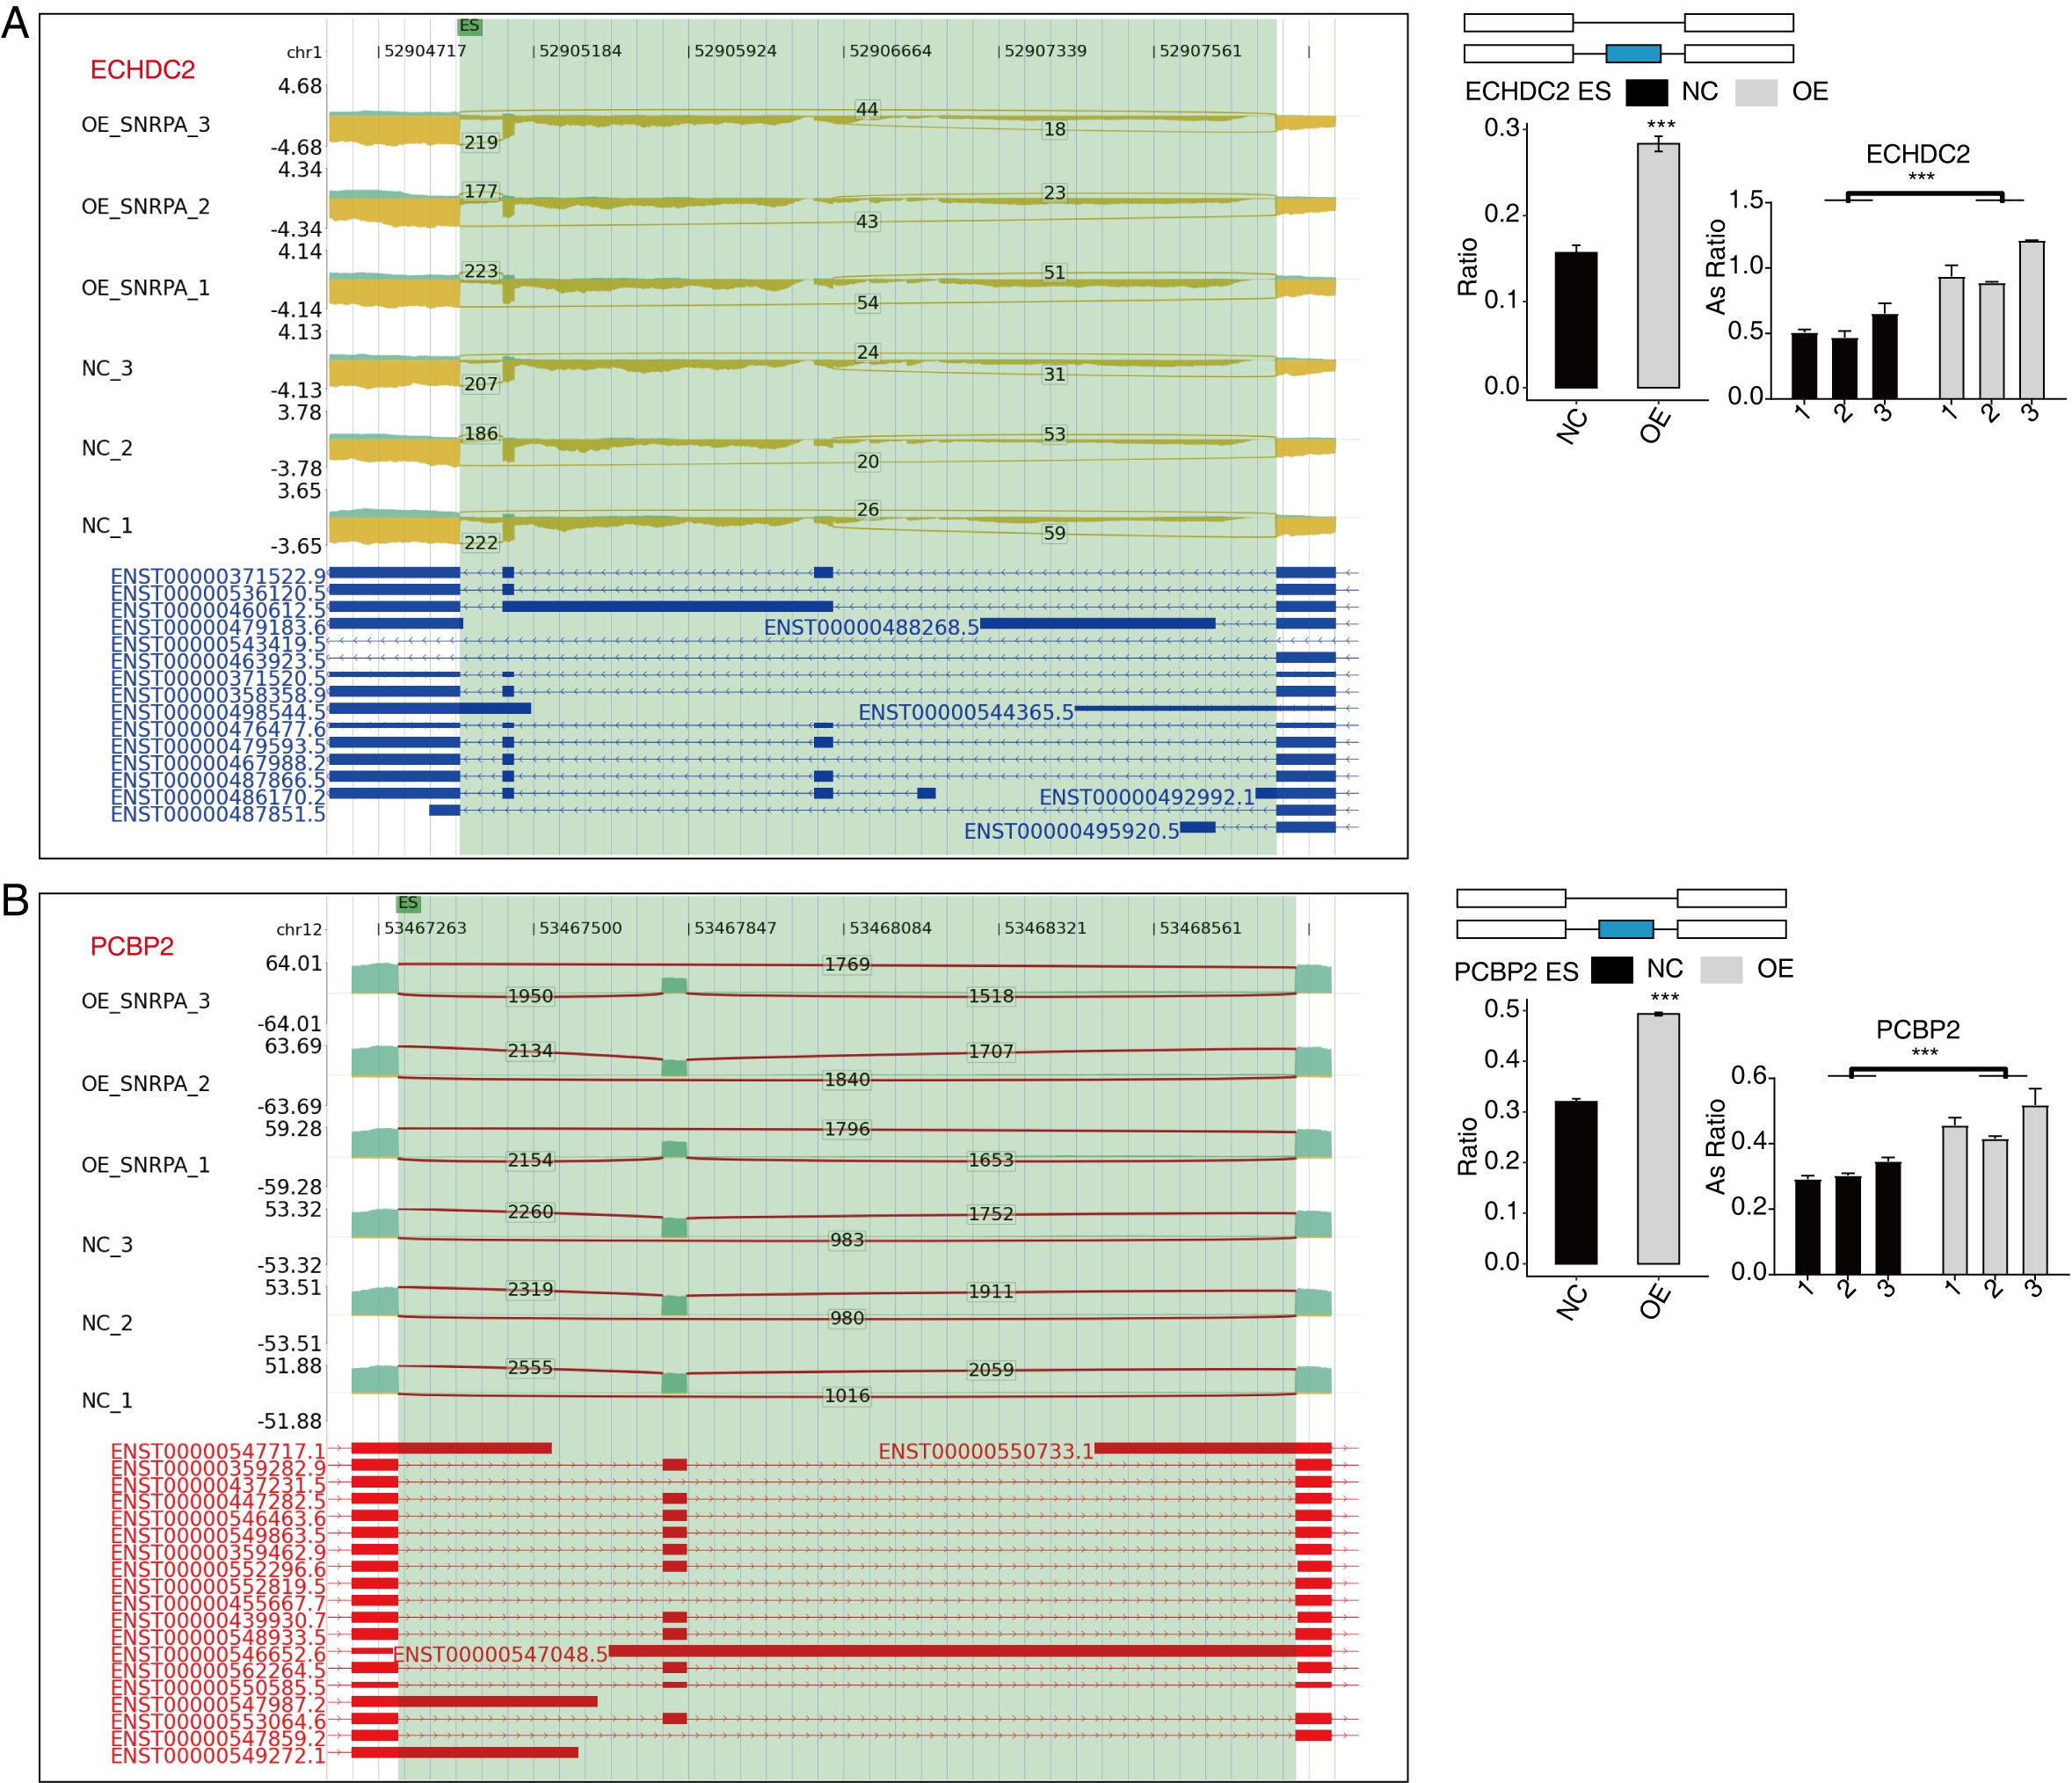
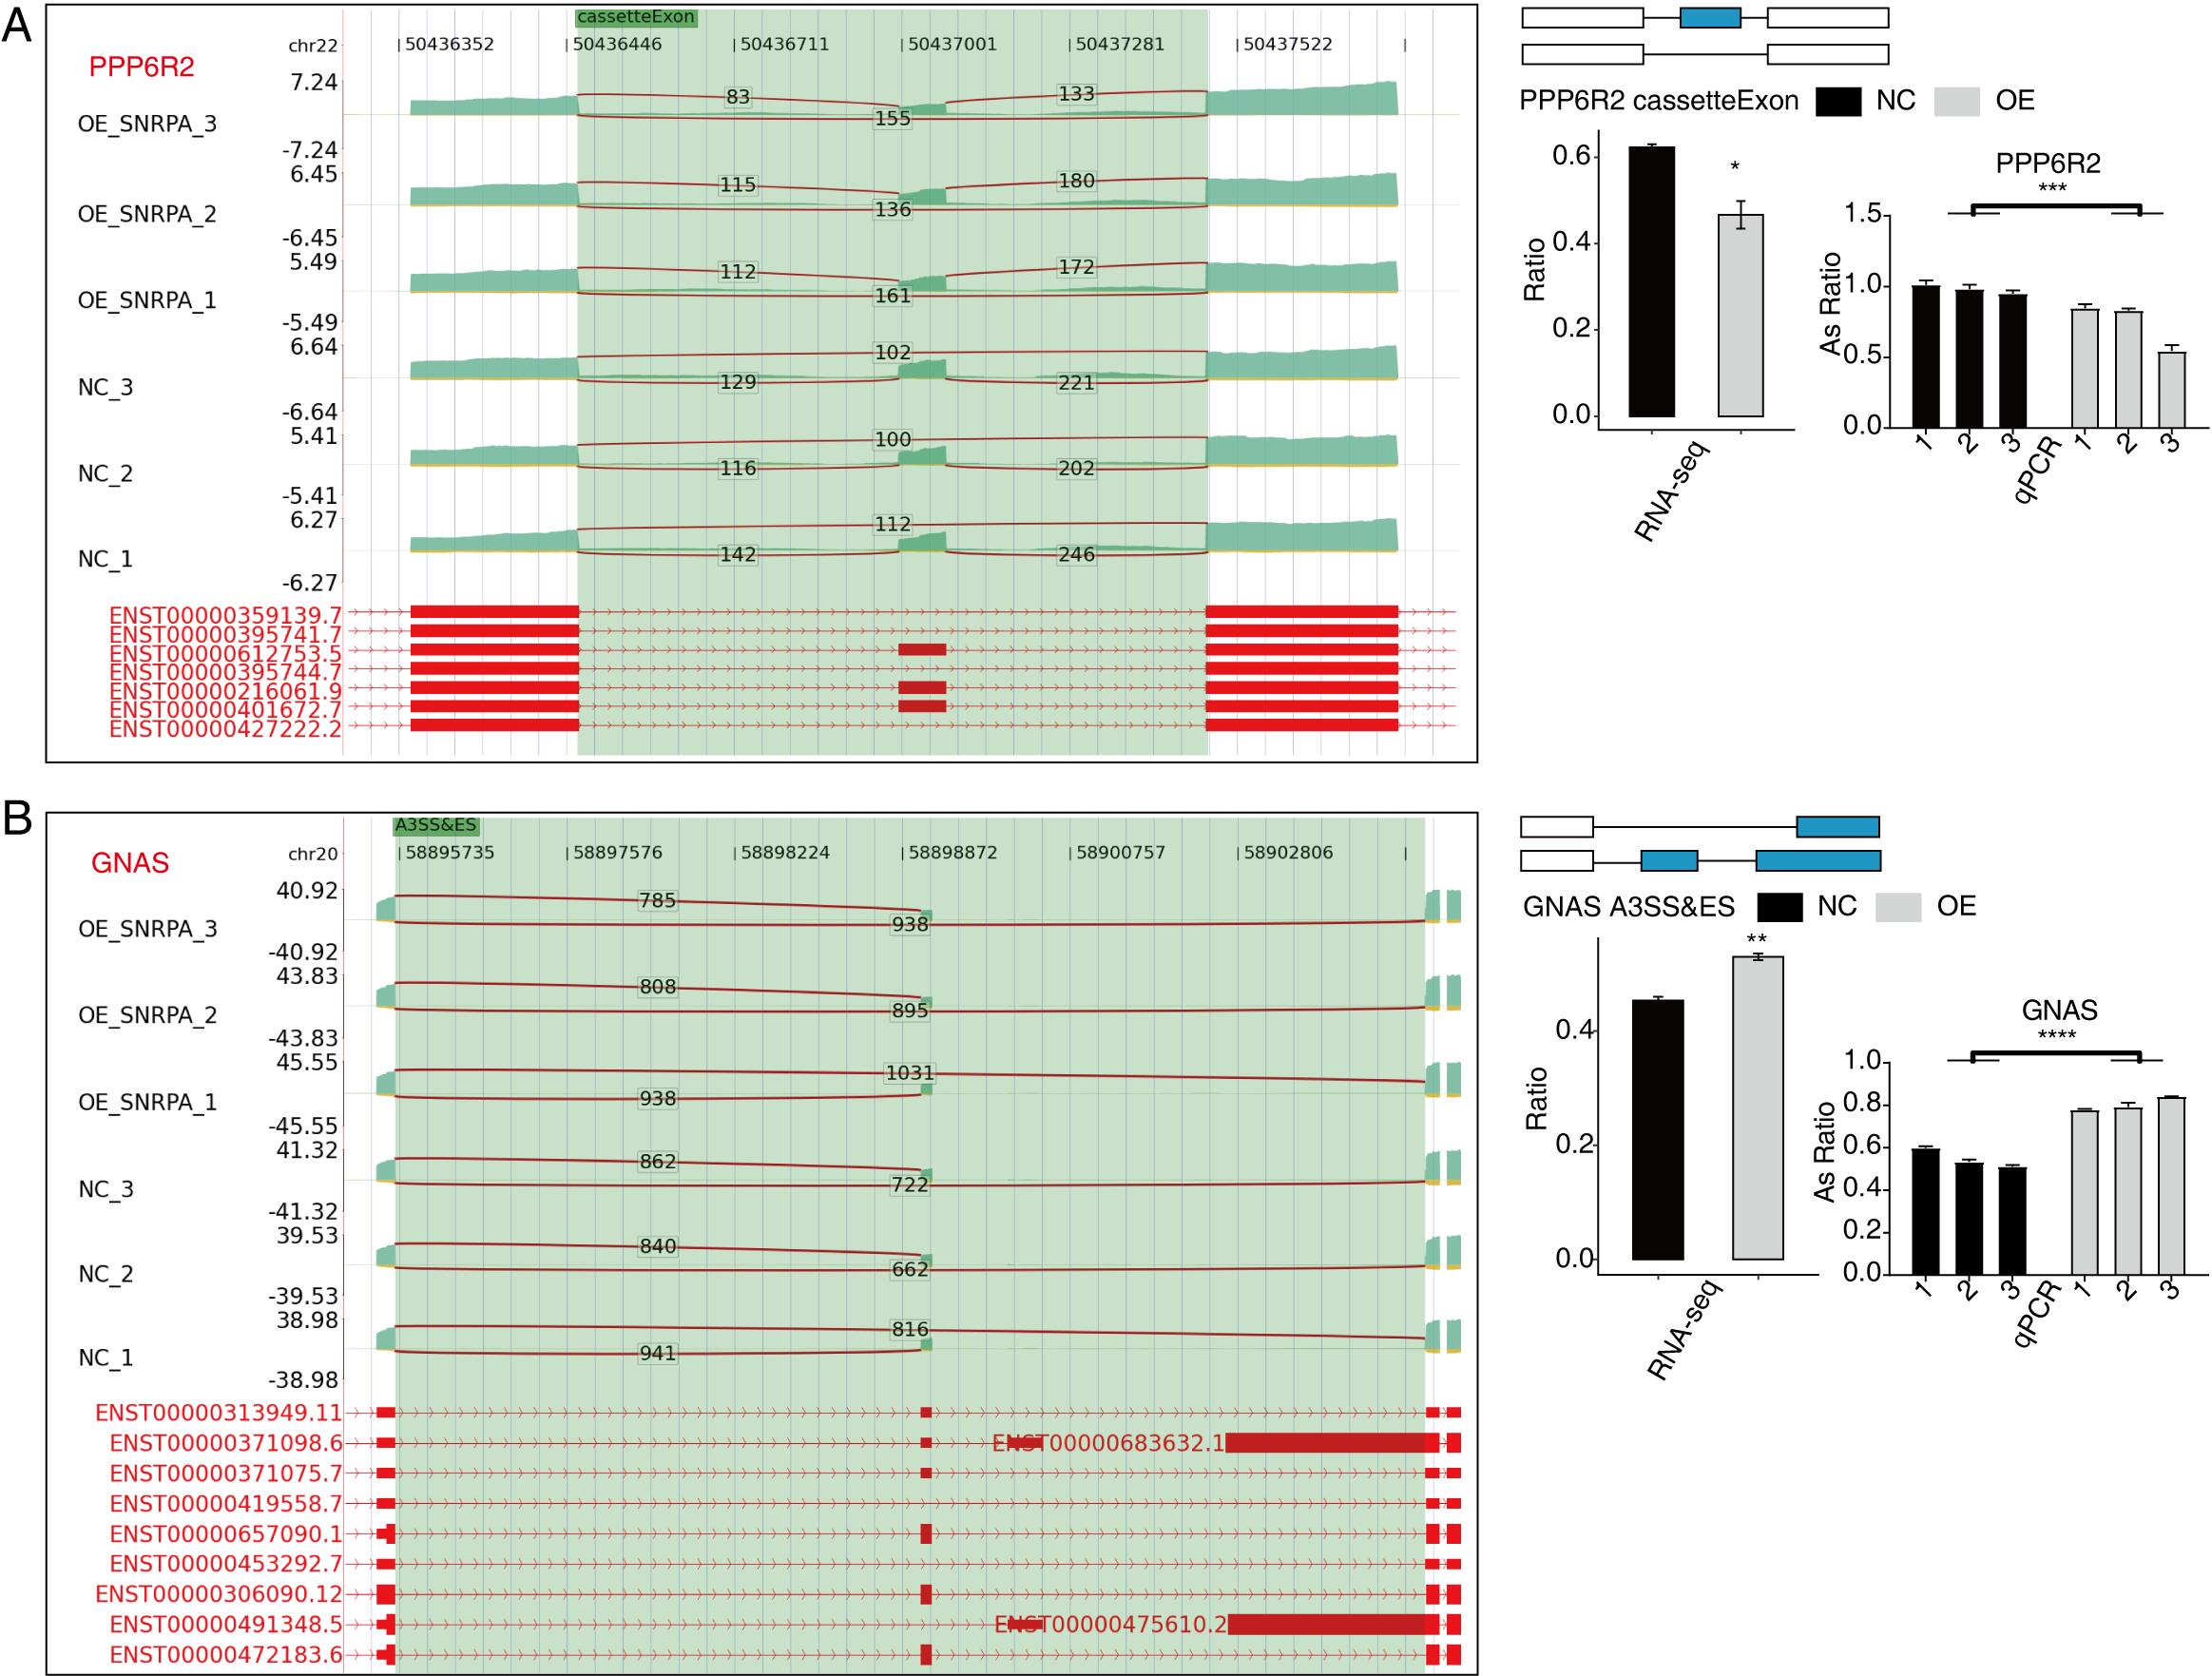
Subsequently, we analyzed the Gene Ontology database for regulated alternative splicing genes (RASGs) and observed a main enrichment of genes undergoing alternative splicing in DNA repair, cellular response to DNA damage stimuli, regulation of mRNA stability, cell cycle control, RNA splicing phosphorylation events, and the Wnt signaling pathway among other pathways under investigation (Fig. 4B). Excluding changes induced by transcriptional regulation alone, we further investigated genes exhibiting both regulated expression levels and alternative splicing patterns mediated by SNRPA resulting in the identification of 13 genes shared between DEGs and RASGs (Fig. 4C). Then we prioritized these genes associated with HCC disease based on the ascending p-value principle considering read counts and differential significance[46]. In the end, we narrowed down to 6 events that showed significant differences, including MFF, which showed strong correlation between its overexpression and unfavorable prognosis in HCC patients[47]; FDPS, being associated with the prognosis of cholesterol metabolism in hepatocellular carcinoma, holds significant implications for understanding disease progression[48]; ACP, which exhibits frequent hypermethylation in hepatocellular carcinoma (HCC) events[49]; ECHDC2, whose overexpression is indicative of a favorable prognosis in patients with HBV-associated conditions[46]; PCBP2, which impact on the proliferative response of cancer nodules Li, Zhao, Lin, Liu and Cheng [50]; Repression of GNAS resulted in the attenuation of IL-6 expression induced by LPS through the inhibition of STAT3 activation in hepatocellular carcinoma (HCC) cells[51]. To test the validity the RASGs controlled by SNRPA, RT-qPCR experiments were performed, which demonstrated a strong concordance between six RASEs and the transcriptome analysis findings. Specifically, the SNRPA-OE group showed increased AS ratios in MFF, FDPS, ECHDC2, PCBP2, and GNAS as confirmed by RNA-seq and qPCR analysis compared to the NC group; Nevertheless, ACP1 and displayed contrasting effects (Fig. 4D-F, Fig.S1 and Fig.S2B ).
SNRPA binds to mRNAs associated with HCC in HepG2 cells
As commonly acknowledged, the assessment of a conventional RBPs usually entails the evaluation of its binding capability, quantification of reads that are bound, and examination of its efficacy. In this research, our objective was to examine the binding capacity of SNRPA in HepG2 cells by utilizing an enhanced RIP and high-throughput sequencing technique called iRIP-seq (refer to “Materials and Methods” for more details), with the purpose of identifying transcripts that interact with SNRPA. Two separate replicative experiments were conducted to enhance credibility of results. Western blot analysis confirmed that the SNRPA antibody exhibited high immunoprecipitation efficiency (Fig. 5A). Then, cDNA libraries from both SNRPA-IP and Input samples were sequenced to obtain high-quality iRIP-sequence data. (details in Supplementary Table S6). After eliminating reads of inferior quality and adaptor sequences, it was determined that around 88.65% of the reads exhibited successful alignment to the GRCh38 genome utilizing HISAT2. (details in Supplementary Table S7). In RIP protocols, the absence of RNase digestion(unlike CLIP-seq protocols)lead to the inability to restore intact transcripts but the findings indicated that when plotting the distribution of uniquely mapped anti-SNRPA reads across the entire human genome and we found the IP samples demonstrated a pronounced enrichment of reads in the 5’UTR region compared to input samples(details in Supplementary Table S8), that was of great interest to us.
For purpose of retrieving the binding sites of SNRPA from the reads obtained through RIP-seq, we chose a newly released software “ABLIRC”described before [21], whose principle is to capture and compare the overlap tags with the highest degree of target genes. With the Input sample as the background, peak calling was performed on the reads removed from PCR duplication for the experimental sample, resulting 597 peaks in total. As depicted in the Fig. 5B(Fig. 5B), the genomic distribution of peaks binded with SNRPA from two SNRPA-IP samples and exhibited remarkable similarity, indicating high reproducibility of our sample and the peak gene also shows a significant concentration in Region 5’UTR and CDS. The motif analysis (Fig. 5C, Fig. 5D) results revealed a high level of concordance in the binding motifs of SNRPA obtained from both experiments. Specifically, SNRPA exhibited affinity towards GCAC and AUU motifs on RNA,which aligns with the outcomes observed in prior studies [52], indicating its ability to bind AUUGCAC primarily located in the 3' UTR so that to specifically inhibits its own pre-mRNA and polyadenylation. To further elucidate the potential genes involved in the regulation of SNRPA to differentially expressed genes (DEGs) in HepG2 cells, a comprehensive gene overlap analysis was conducted between the significantly DEGs (498 genes) identified from SNRPA-OE RNA-seq data and the peak genes observed in iRIP-seq data. This analysis led to the identification of three up-regulated genes, namely CEMIP[53], SLC4A11[54] and GTF2IP7, which possess binding sites for SNRPA. Notably, these genes have been associated with liver cancer and represent promising positive regulatory targets for SNRPA, as illustrated in Venn diagram(Fig. 5E).
Next, we conducted RT-qRCR experiments for these genes to validate the accuracy of RNA-seq and iRIP-seq. The result of 3 genes, CEMIP, SLC4A11 (Fig. 3G), and GTF2IP7 (Fig. 5F) revealed high agreement with the findings from the examination of RNA-seq data for transcriptome analysis. But the results of RIP-PCR only confirmed the validity of GTF2IP7 as the IGV-sashimi plot shown, the left image of which revealed the binding site of SNRPA to the peak gene GTF2IP7, further supported by our RIP-PCR results illustrating efficient binding between SNRPA and GTF2IP7 (Fig. 5G).
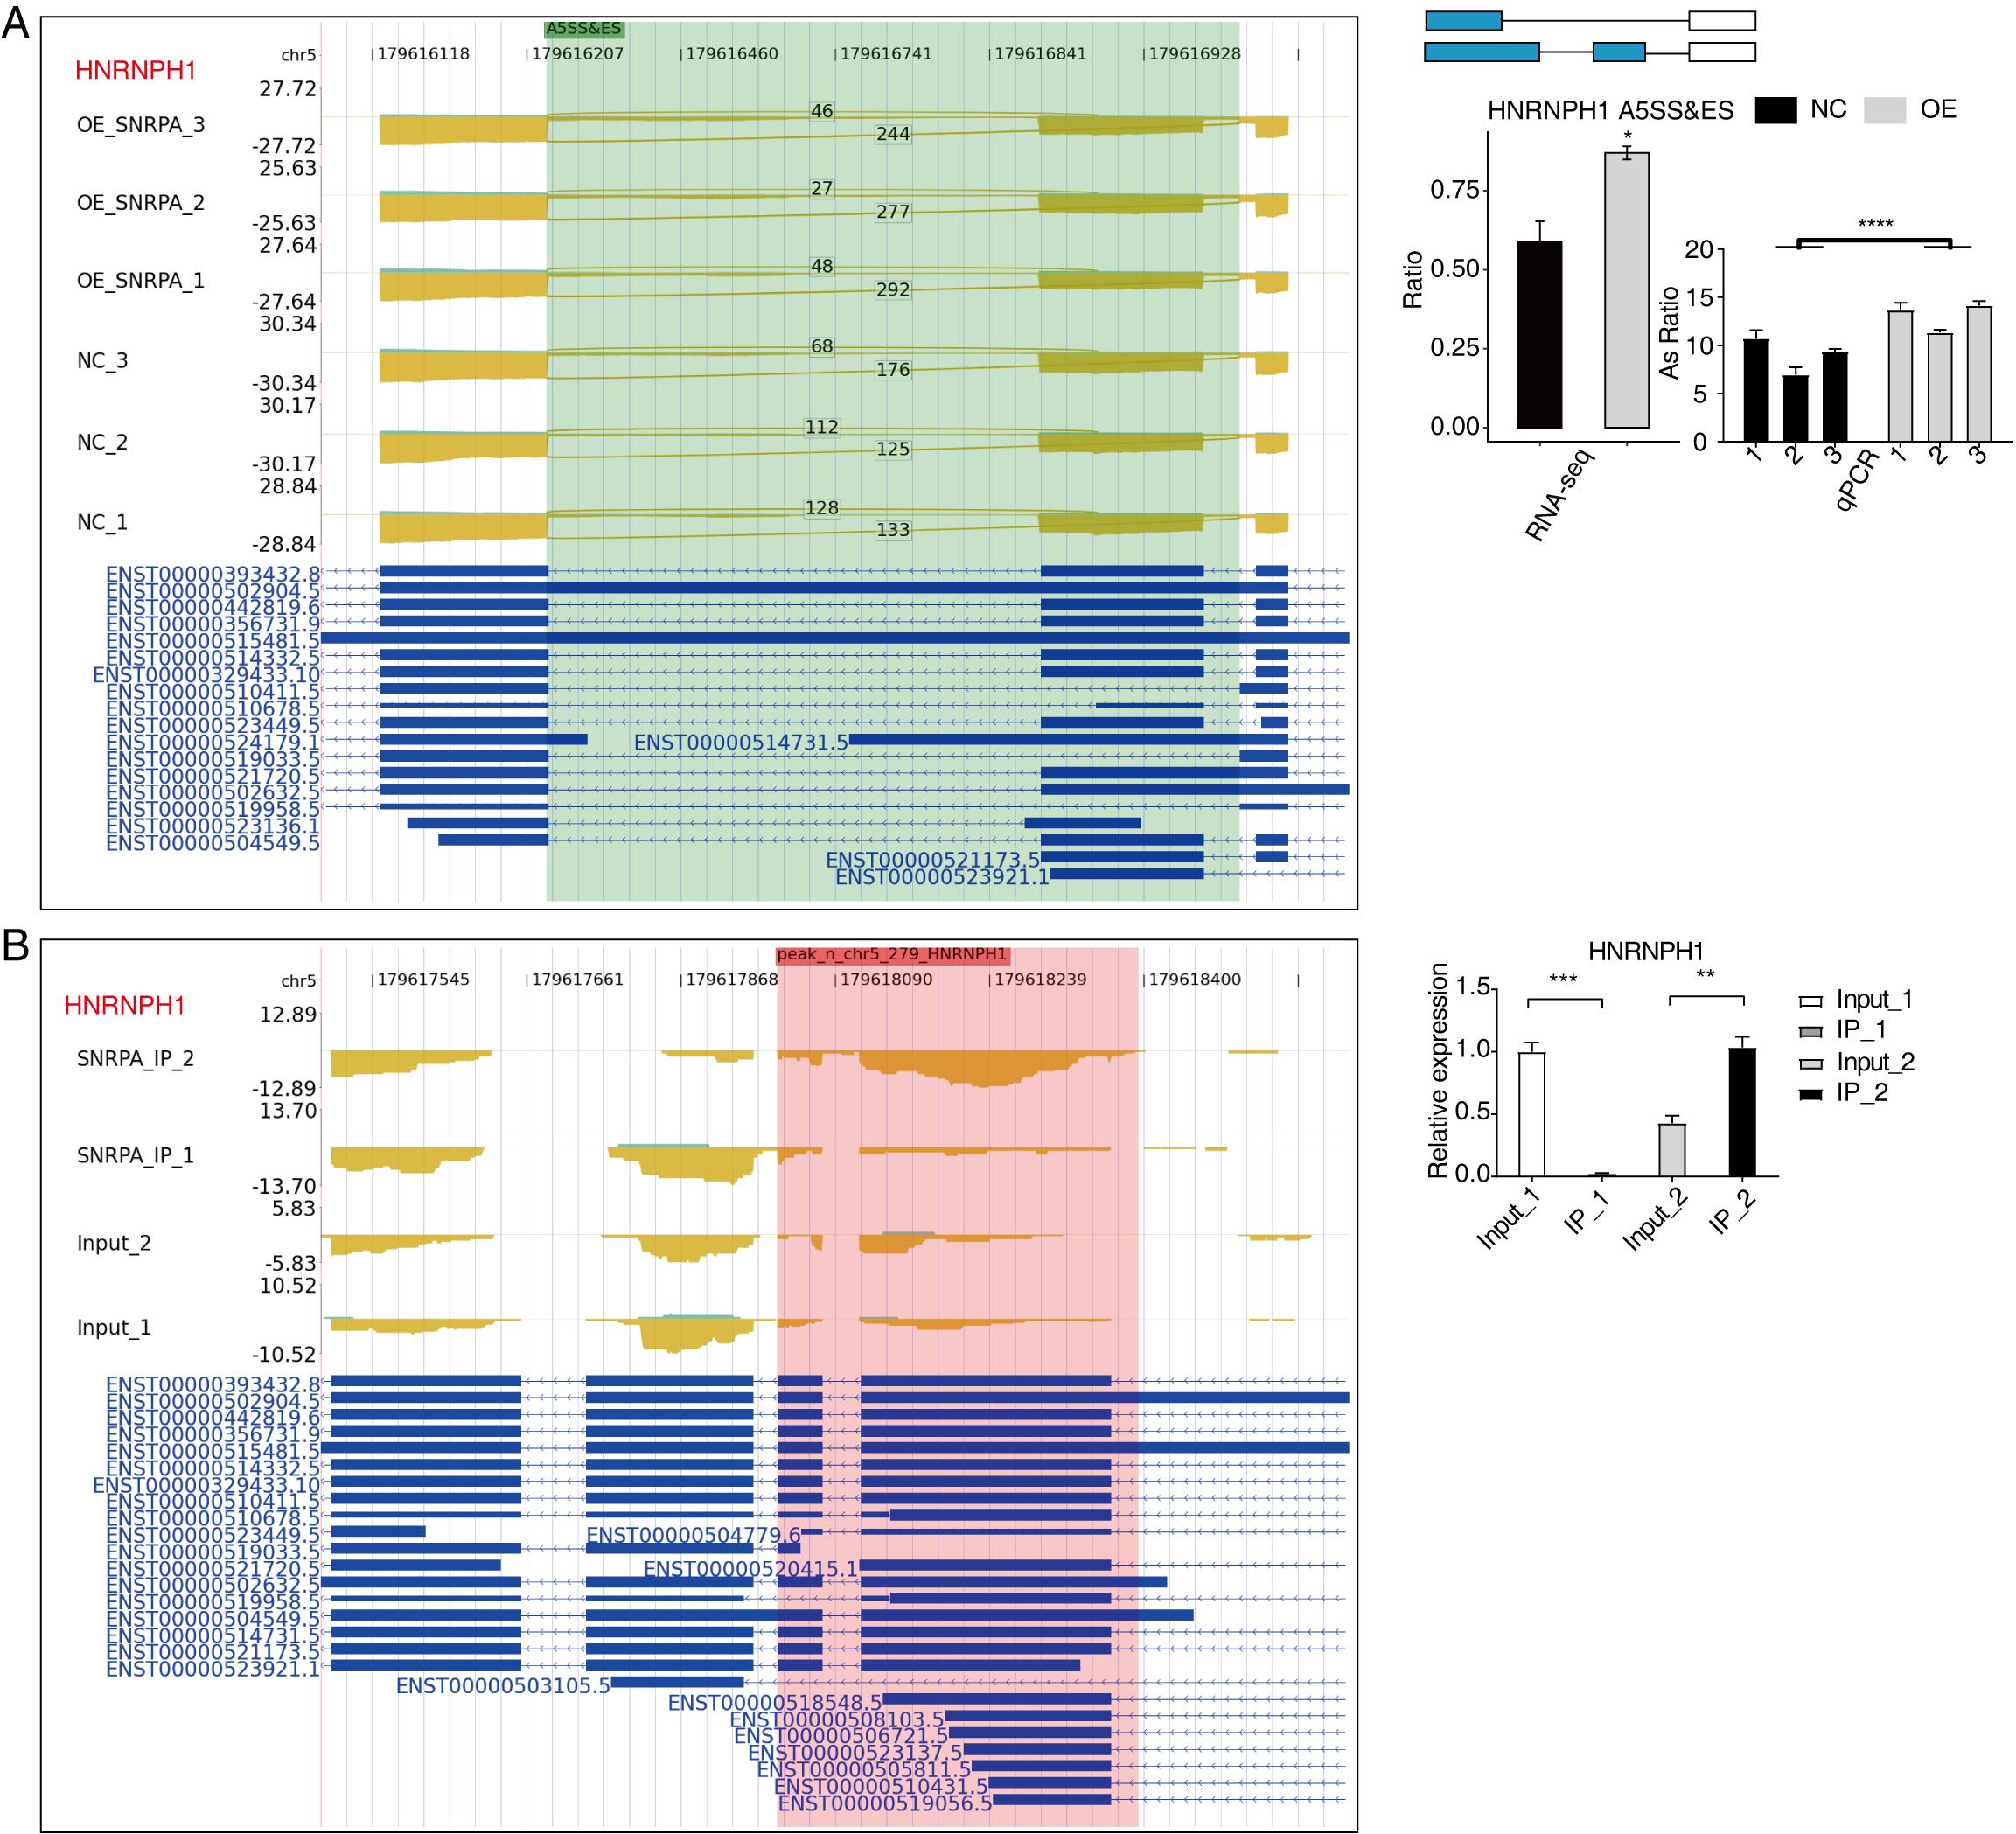
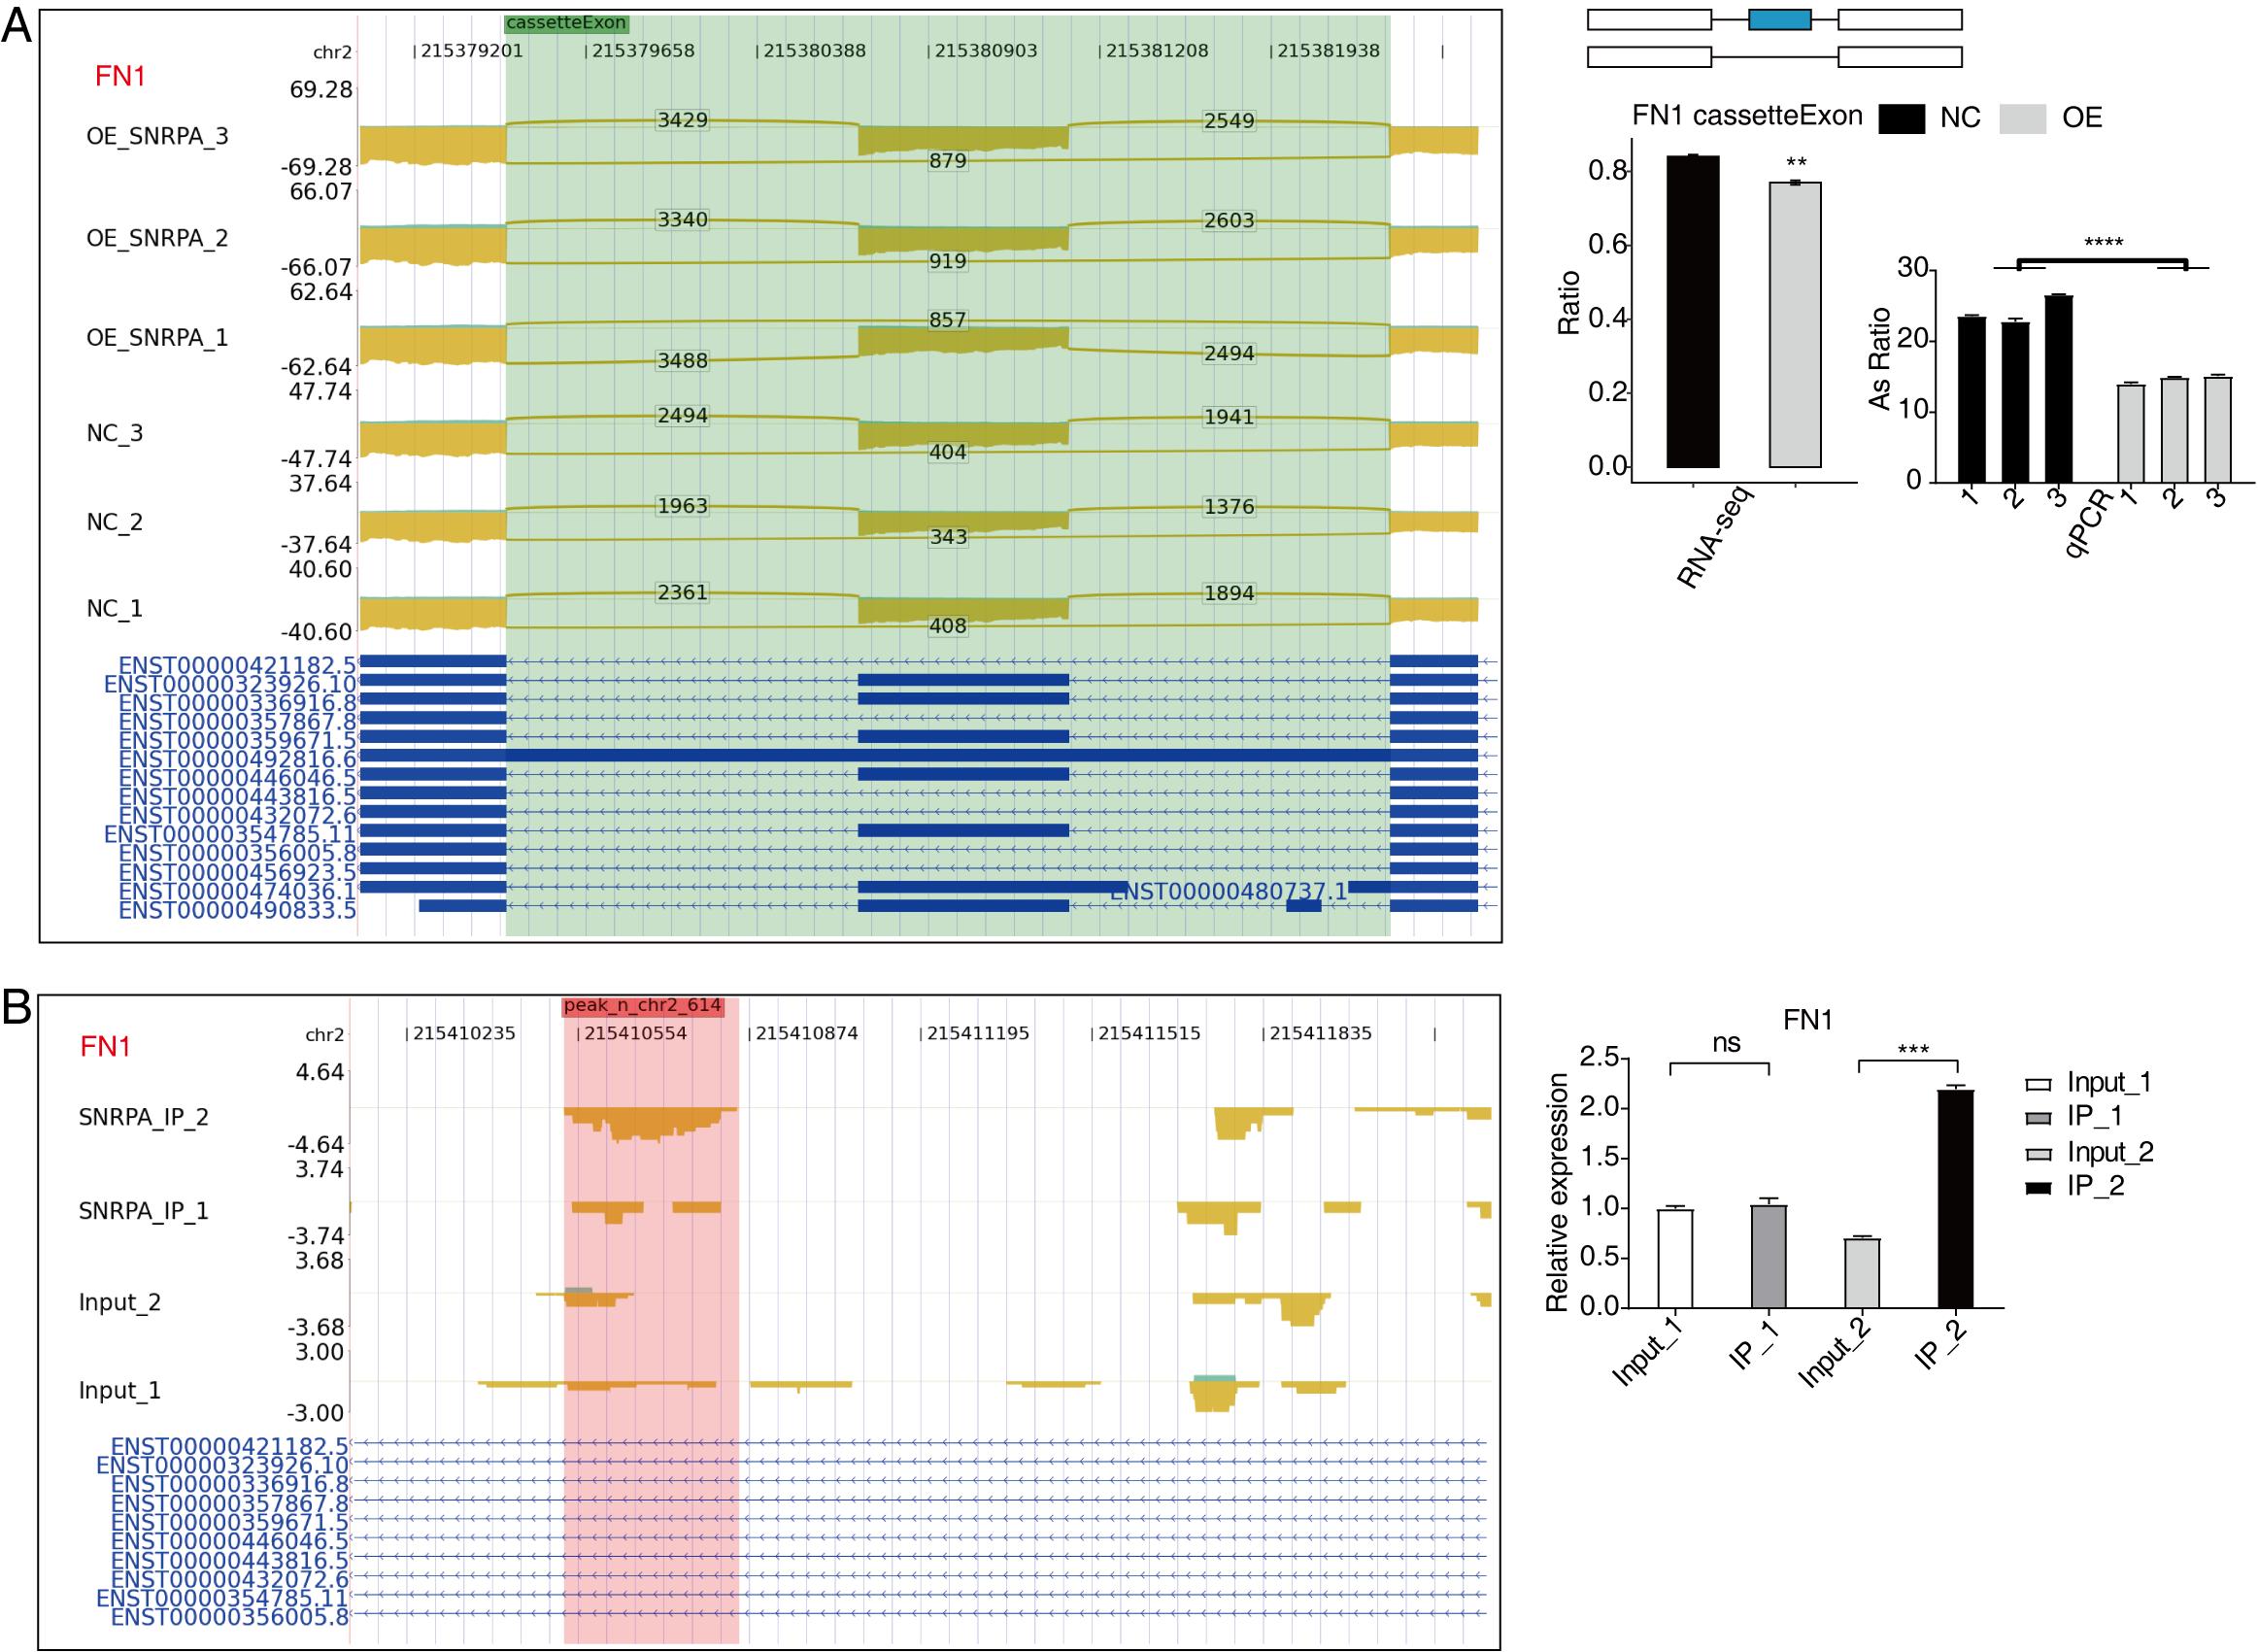
SNRPA -interaction regulates the RASGs related to HCC
An overlap analysis was conducted between the 597 peak genes corresponding to the 1505 significantly differentially expressed RNA-associated splicing genes in the data of RNA-seq following SNRPA overexpression, and the genes exhibiting peaks in both experiments in the iRIP-seq data. Our analysis revealed that there were 101 overlapping genes between peak genes and RASGs (Fig. 6A), indicating that these 101 RASGs harbor SNRPA binding sites and exhibit significant disparities in alternative splicing levels. The scatter plot (Fig. 6B) further demonstrates their involvement in RNA splicing, DNA template transcription regulation, and negative cell division regulation. The findings strongly indicate that these genes play a pivotal role in the regulation of variable splicing by SNRPA in HepG2 cells. Notably, HNRNPH1, EIF4A2, PPP6R2, FN1, are differential alternative splicing event-related genes of considerable interest in our study. In contrast to the control group, we noticed a considerable reduction in the level of expression of EIF4A2 (Fig. 6C), PPP6R2 (Fig.S3A), and FN1 (Fig.S4A) genes in the SNRPA-OE group; Additionally, there was a notable increase in alternative splicing events for HNRNPH1 (Fig.S3A) and GNAS (Fig.S2B) gene expression within this group all aligning with our expectations. Furthermore, RIP-PCR experiments for EIF4A2(Fig. 6D), HNRNPH1(Fig.S3B) and FN1(Fig.S4B) showed obvious statistical differences suggesting efficient binding of SNRPA to RNAs encoded by these three target genes.
SNRPA binding peak genes of EIF4A2. The distribution of SNRPA-binding peaks across EIF4A2 is depicted in the reads density landscape (left). The expression level of EIF4A2 was quantified using iRIP-seq data and measured by RT-qPCR (right) .