Among the 22,901 participants (41.5% male, 58.4% female, average age: 50.1 years), the overall prevalence of osteoarthritis was 11.8%. Table 1 shows the baseline characteristics of the participants stratified by osteoarthritis status. In general, osteoarthritis was more common in middle-aged (45-64 years) and elderly (≥65 years) individuals, females and non-Hispanic whites. Higher education levels of above high school, BMI≥25, heavy smoking, hypertension diagnosis and diabetes diagnosis were related to higher risk of osteoarthritis. Compared to vigorous work activity and moderate work activity, osteoarthritis prevalence was lower in those engaging in vigorous recreational activity and moderate recreational activity (Table 1). Females and participants with higher BMI were more likely to perform non-physical activity, and had higher risks of osteoarthritis, hypertension or diabetes. Participants who received education higher than high school tended to have light physical activity level. Those with lower BMI and non-whites were more likely to have medium physical activity level. Younger individuals (20-44 years) and males were more inclined to have high physical activity level, and suffered lower risks of osteoarthritis, hypertension, and diabetes (Table 2).
Table 1 Baseline characteristics of the research population with and without osteoarthritis
|
Characteristic
|
Non-osteoarthritis(n=20196)
|
Osteoarthritis (n=2705)
|
p-Value
|
|
Age(years)
|
|
|
<0.001
|
|
20-44
|
7250(97.2)
|
206(2.8)
|
|
|
45-64
|
7331(87.5)
|
1049(12.5)
|
|
|
≥65
|
5615(79.5)
|
1450(20.5)
|
|
|
Gender
|
|
|
<0.001
|
|
Male
|
8669(91.2)
|
837(8.8)
|
|
|
Female
|
11527(86.1)
|
1868(13.9)
|
|
|
Race
|
|
|
<0.001
|
|
Mexican American
|
3317(92.6)
|
250(7.4)
|
|
|
Other Hispanic
|
2298(91.4)
|
216(8.6)
|
|
|
Non-Hispanic white
|
7162(83.4)
|
1427(16.6)
|
|
|
Non-Hispanic black
|
4810(89.4)
|
568(10.6)
|
|
|
Other races
|
2809(92.0)
|
244(8.0)
|
|
|
Level of education
|
|
|
<0.001
|
|
<High school
|
5911(89.8)
|
671(10.2)
|
|
|
High school
|
4811(88.5)
|
626(11.5)
|
|
|
>High school
|
9474(89.1)
|
1408(12.9)
|
|
|
BMI status(kg/m2)
|
|
|
<0.001
|
|
<25
|
5742(90.9)
|
551(9.1)
|
|
|
≥25
|
14724(87.2)
|
2154(12.8)
|
|
|
Smoking status
|
|
|
<0.001
|
|
No
|
8681(86.1)
|
1399(13.9)
|
|
|
Yes
|
11515(89.8)
|
1306(10.2)
|
|
|
Alcohol consumption
|
|
|
<0.001
|
|
Non-drinker
|
2939(89.1)
|
359(10.9)
|
|
|
<2 alcohol drinks
|
4293(85.2)
|
746(14.8)
|
|
|
≥2 alcohol drinks
|
6902(90.8)
|
701(9.2)
|
|
|
Unspecified
|
6062(87.1)
|
899(12.9)
|
|
|
Hypertension
|
|
|
<0.001
|
|
Yes
|
7918(81.6)
|
1789(18.4)
|
|
|
NO
|
12278(93.1)
|
916(6.9)
|
|
|
Diabetes
|
|
|
<0.001
|
|
Yes
|
3201(81.2)
|
743(18.8)
|
|
|
NO
|
16481(89.9)
|
1858(10.1)
|
|
|
Unspecified
|
514(83.2)
|
104(16.8)
|
|
|
Vigorous work activity a
|
|
|
<0.001
|
|
Yes
|
19504(88.0)
|
2656(12.0)
|
|
|
NO
|
692(93.4)
|
49(6.6)
|
|
|
Moderate work activity b
|
|
|
0.019
|
|
Yes
|
17540(88.4)
|
2305(11.6)
|
|
|
NO
|
2656(86.9)
|
400(13.1)
|
|
|
Walk or bicycle c
|
|
|
<0.001
|
|
Yes
|
17574(87.8)
|
2453(12.2)
|
|
|
NO
|
2622(91.2)
|
252(8.8)
|
|
|
Vigorous recreational activity d
|
|
|
<0.001
|
|
Yes
|
19149(87.8)
|
2657(12.2)
|
|
|
NO
|
1047(95.6)
|
48(4.4)
|
|
|
Moderate recreational activity e
|
|
|
0.008
|
|
Yes
|
16393(87.9)
|
2253(12.1)
|
|
|
NO
|
3803(89.4)
|
452(10.6)
|
|
|
Physical activity levels
(met-h/week)
|
|
|
<0.001
|
|
NPA f (0)
|
10302(86.0)
|
1683(14.0)
|
|
|
LPA g (1.4-12.9)
|
3389(89.4)
|
400(10.6)
|
|
|
MPA h (13.7-60)
|
5335(89.6)
|
616(10.4)
|
|
|
HPA I (64.3-1080)
|
2686(91.5)
|
251(8.5)
|
|
|
Laboratory indices
|
|
|
|
|
Blood urea nitrogen (mmol/L)
|
4.93±0.018
|
5.80±0.058
|
<0.001
|
|
Total calcium (mmol/L)
|
2.34±0.001
|
2.34±0.003
|
0.001
|
|
Phosphorus (mmol/L)
|
1.20±0.002
|
1.22±0.005
|
0.025
|
|
Triglycerides (mmol/L)
|
1.76±0.013
|
1.83±0.034
|
0.017
|
|
Uric acid (µmol/L)
|
319.78±0.797
|
323.79±2.26
|
<0.001
|
|
Total cholesterol (mmol/L)
|
5.28±0.014
|
5.26±0.039
|
<0.001
|
Abbreviations: n: sample size; BMI, body mass index (calculated as weight in kilograms divided by height in square meters); MET, metabolic equivalent; a Vigorous work activity: typical activity that induced signification increases in breathing or heart rate for at least 10 min continuously; b Moderate work activity: any activity that induces minor increases in breathing or heart rate; c walk or use a bicycle for at least 10 minutes continuously to get to and from places; d Vigorous recreational activities: high-intensity sports, fitness activities, or leisure activities that generate signification increases in respiration or heart rate; e Moderate recreational activities: any activity that generates a slight rise in breathing or heart rate for at least 10 min continuously; f NPA: Non-physical activity (0 MET-min/week); g LPA: Light Physical Activity (1.4-12.9 MET-min/week); h MPA: Medium Physical Activity (13.7-60 MET-min/week); i HPA: High Physical Activity (64.3-1080 MET-min/week);Continuous variables were presented by mean ± Standard error (SE), and categorical variables were presented with numbers and percentages.
Table 2, Baseline Characteristics of Participants by Physical Activity Intensity Status: NHANES,2007-2020.
|
Characteristic
|
Physical Activity Levels (met-h/week)
|
|
NPA a(n=10918)
|
LPA b(n=3596)
|
MPA c(n=5630)
|
HPA d(n=2757)
|
p-Value
|
|
Age(years)
|
|
|
|
|
<0.001
|
|
20-44
|
3494(32.0)
|
1435(39.9)
|
2139(38.0)
|
1265(45.9)
|
|
|
45-64
|
4149(38.0)
|
1370(38.1)
|
2162(38.4)
|
1028(37.3)
|
|
|
≥65
|
3265(29.9)
|
791(22,0)
|
1334(23.7)
|
466(16.9)
|
|
|
Gender
|
|
|
|
|
<0.001
|
|
Male
|
4029(36.9)
|
1356(37.7)
|
2325(41.3)
|
1387(50.3)
|
|
|
Female
|
6889(63.1)
|
2240(62.3)
|
3305(58.7)
|
1370(49.7)
|
|
|
Race
|
|
|
|
|
<0.001
|
|
Mexican American
|
1048(9.6)
|
263(7.3)
|
411(7.3)
|
312(11.3)
|
|
|
Other Hispanic
|
775(7.1)
|
180(5.0)
|
349(6.2)
|
196(7.1)
|
|
|
Non-Hispanic white
|
6616(60.6)
|
2330(64.8)
|
3710(65.9)
|
1709(62.0)
|
|
|
Non-Hispanic black
|
1485(13.6)
|
435(12.1)
|
631(11.2)
|
358(13.0)
|
|
|
Other races
|
983(9.0)
|
388(10.8)
|
529(9.4)
|
182(6.6)
|
|
|
Level of education
|
|
|
|
|
<0.001
|
|
<High school
|
2566(23.5)
|
478(13.3)
|
901(16.0)
|
634(23.0)
|
|
|
High school
|
2861(26.2)
|
845(23.5)
|
1250(22.2)
|
852(30.9)
|
|
|
>High school
|
5492(50.3)
|
2273(63.2)
|
3479(61.8)
|
1271(46.1)
|
|
|
BMI status(kg/m2)
|
|
|
|
|
<0.001
|
|
<25
|
2544(23.3)
|
957(26.6)
|
1661(29.5)
|
742(26.9)
|
|
|
≥25
|
8374(76.7)
|
2640(73.4)
|
3969(70.5)
|
2015(73.1)
|
|
|
Smoking status
|
|
|
|
|
<0.001
|
|
No
|
4924(45.1)
|
1496(41.6)
|
2455(43.6)
|
1387(50.3)
|
|
|
Yes
|
5994(54.9)
|
2100(58.4)
|
3175(56.4)
|
1370(49.7)
|
|
|
Alcohol consumption
|
|
|
|
|
<0.001
|
|
Non-drinker
|
1430(13.1)
|
370(10.3)
|
574(10.2)
|
267(9.7)
|
|
|
<2 alcohol drinks
|
2588(23.7)
|
982(27.3)
|
1453(25.8)
|
598(21.7)
|
|
|
≥2 alcohol drinks
|
3603(33.0)
|
1424(39.6)
|
2246(39.9)
|
1208(43.8)
|
|
|
Unspecified
|
3308(30.3)
|
816(22.7)
|
1363(24.2)
|
681(24.7)
|
|
|
Osteoarthritis
|
|
|
|
|
<0.001
|
|
No
|
9248(84.7)
|
3172(88.2)
|
5016(89.1)
|
2465(89.4)
|
|
|
Yes
|
1670(15.3)
|
424(11.8)
|
614(10.9)
|
292(10.6)
|
|
|
Hypertension
|
|
|
|
|
<0.001
|
|
NO
|
6114(56.0)
|
2248(62.5)
|
3727(66.2)
|
1924(69.8)
|
|
|
Yes
|
4804(44.0)
|
1349(37.5)
|
1903(33.8)
|
833(30.2)
|
|
|
Diabetes
|
|
|
|
|
<0.001
|
|
NO
|
8789(80.5)
|
3082(85.7)
|
4859(86.3)
|
2423(87.9)
|
|
|
Yes
|
1823(16.7)
|
410(11.4)
|
631(11.2)
|
287(10.4)
|
|
|
Unspecified
|
306(2.8)
|
104(2.9)
|
141(2.5)
|
50(1.8)
|
|
|
Laboratory indices
|
|
|
|
|
|
|
Blood urea nitrogen (mmol/L)
|
5.22±0.028
|
4.898±0.041
|
4.958±0.032
|
4.814±0.043
|
<0.001
|
|
Total calcium (mmol/L)
|
2.34±0.001
|
2.345±0.002
|
2.344±0.002
|
2.333±0.002
|
0.008
|
|
Phosphorus (mmol/L)
|
1.201±0.002
|
1.201±0.004
|
1.205±0.003
|
1.198±0.004
|
0.013
|
|
Triglycerides (mmol/L)
|
1.828±0.019
|
1.755±0.026
|
1.718±0.023
|
1.705±0.033
|
<0.001
|
|
Uric acid (µmol/L)
|
321.655±1.1
|
318.219±1.862
|
318.32±1.504
|
322.521±2.16
|
<0.001
|
|
Total cholesterol (mmol/L)
|
5.299±0.021
|
5.28±0.031
|
5.27±0.026
|
5.176±0.036
|
<0.001
|
Abbreviations: n: sample size; BMI, body mass index (calculated as weight in kilograms divided by height in square meters); MET: metabolic equivalent; Continuous variables were presented by mean ± Standard error (SE), and categorical variables were presented with numbers and percentages; a NPA: Non-physical activity (0 MET-min/week);b LPA: Light Physical Activity (1.4-12.9 MET-min/week);c MPA: Medium Physical Activity (13.7-60 MET-min/week);d HPA: High Physical Activity (64.3-1080 MET-min/week);Continuous variables were presented by mean ± Standard error (SE), and categorical variables were presented with numbers and percentages.
Figure 1 shows the relationship between different kinds of physical activity and risk of osteoarthritis. Generally, all physical activity types were related to osteoarthritis in this study. Among them, moderate work activity was a risk factor, while vigorous work activity, vigorous recreational activity, moderate recreational activity, and walking or bicycling were protective factors. Additionally, in particular, there was the strongest statistically significant inverse relationship between vigorous recreational activity and osteoarthritis risk (Model 1, OR: 0.31, 95% CI: 0.20-0.46). Except for vigorous work activity (Model 3, OR: 0.94, 95% CI: 0.62-1.42) and walking or bicycling (Model 3, OR: 0.89, 95% CI: 0.72-1.09), all relations was of statistical significance after controlling for age, gender, race, education level, BMI, smoking status, alcohol consumption, hypertension, diabetes, as well as laboratory data (blood urea nitrogen, total calcium, phosphorus, triglycerides, uric acid, total cholesterol) in the fully adjusted model from the perspective and approach of a researcher.
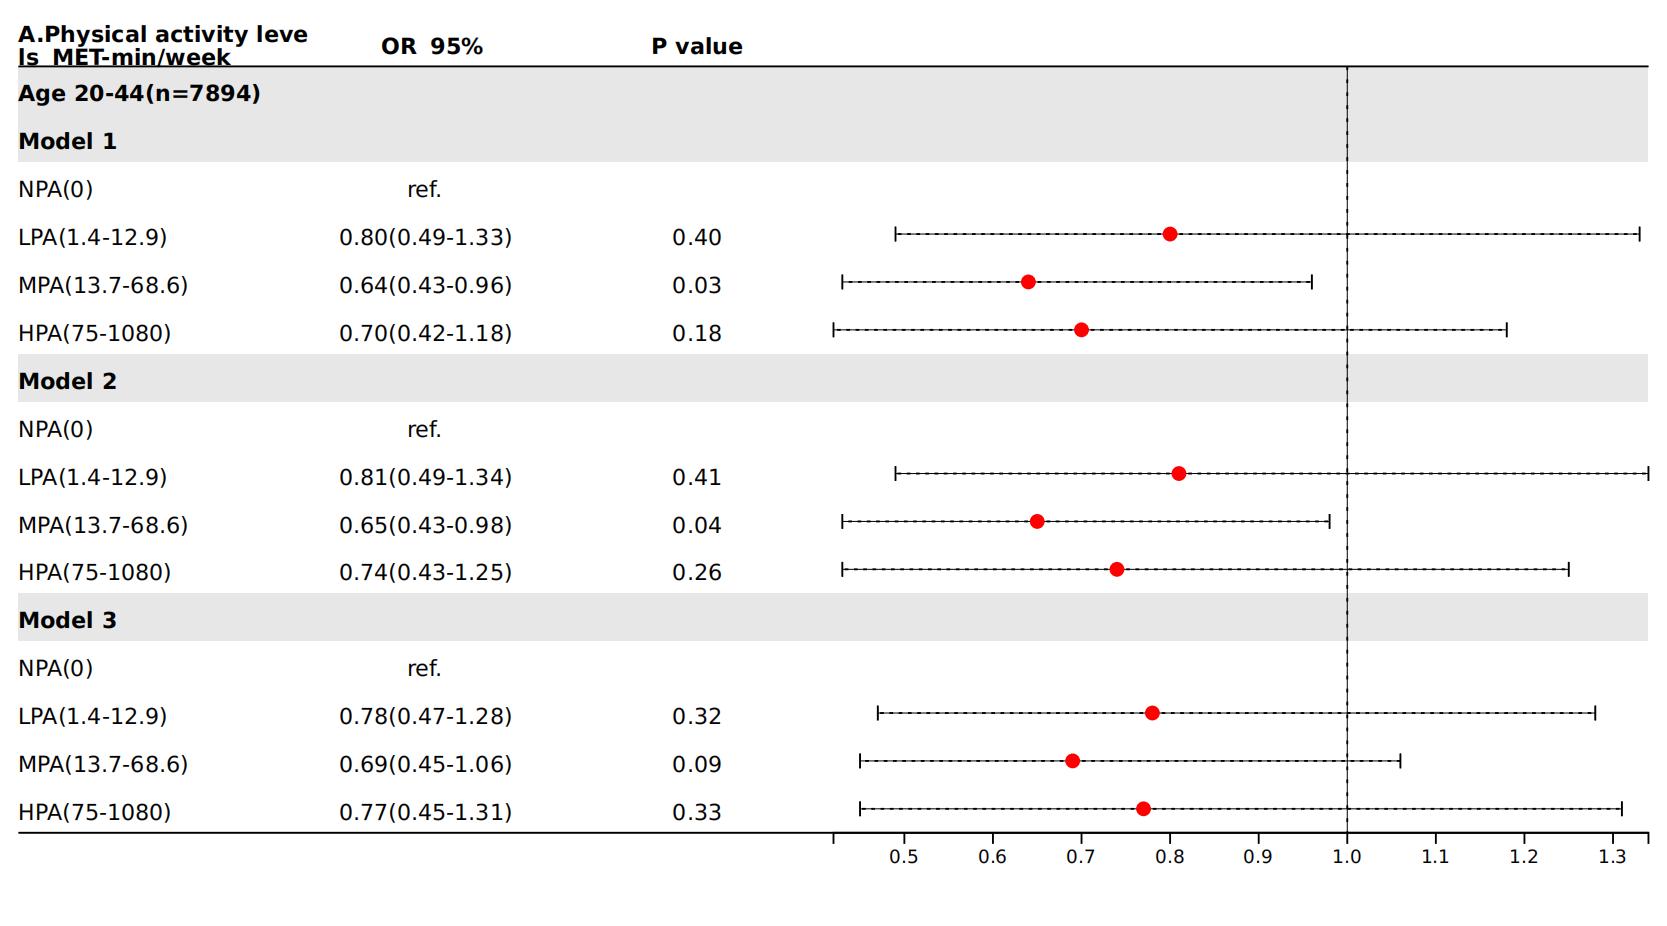
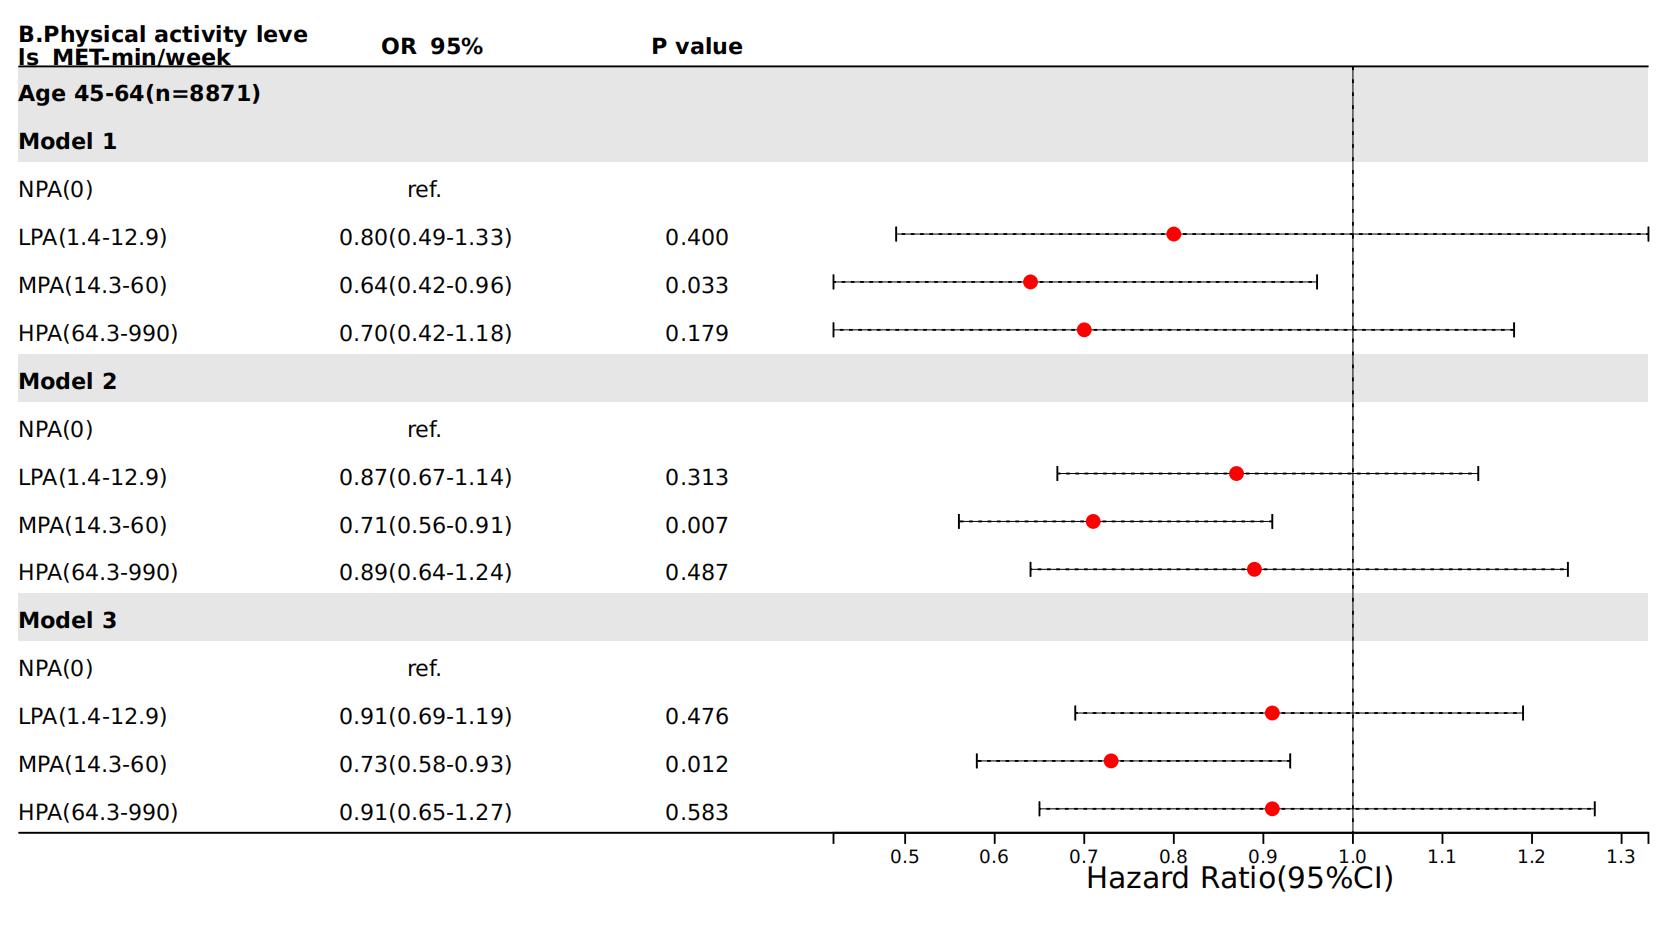
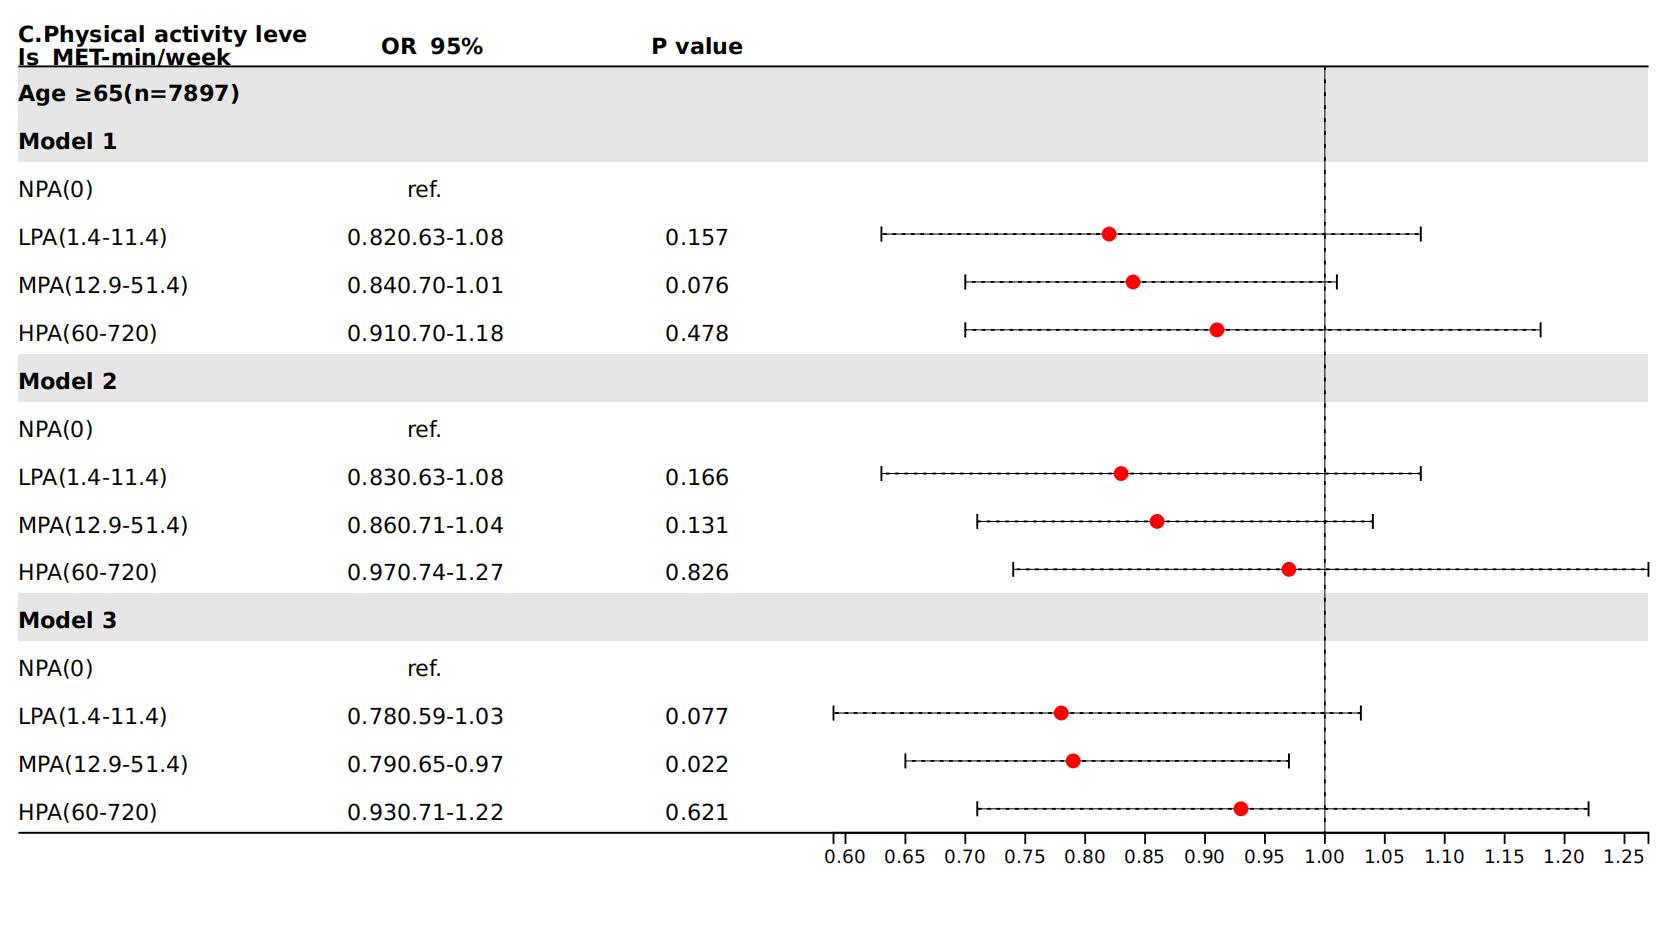
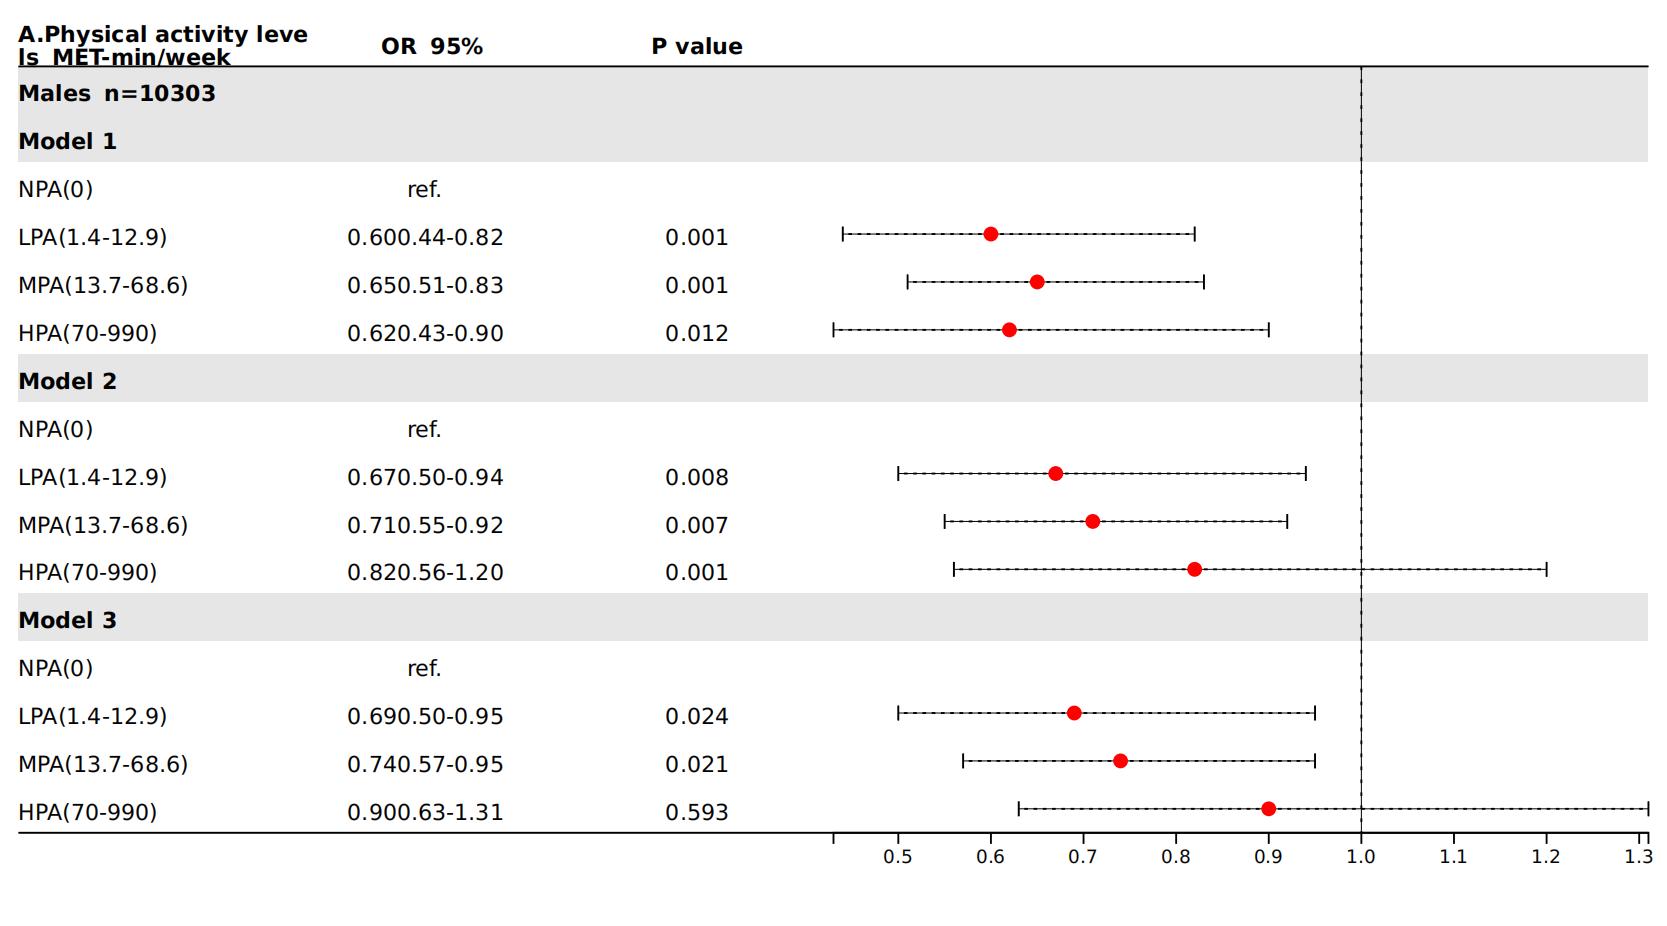
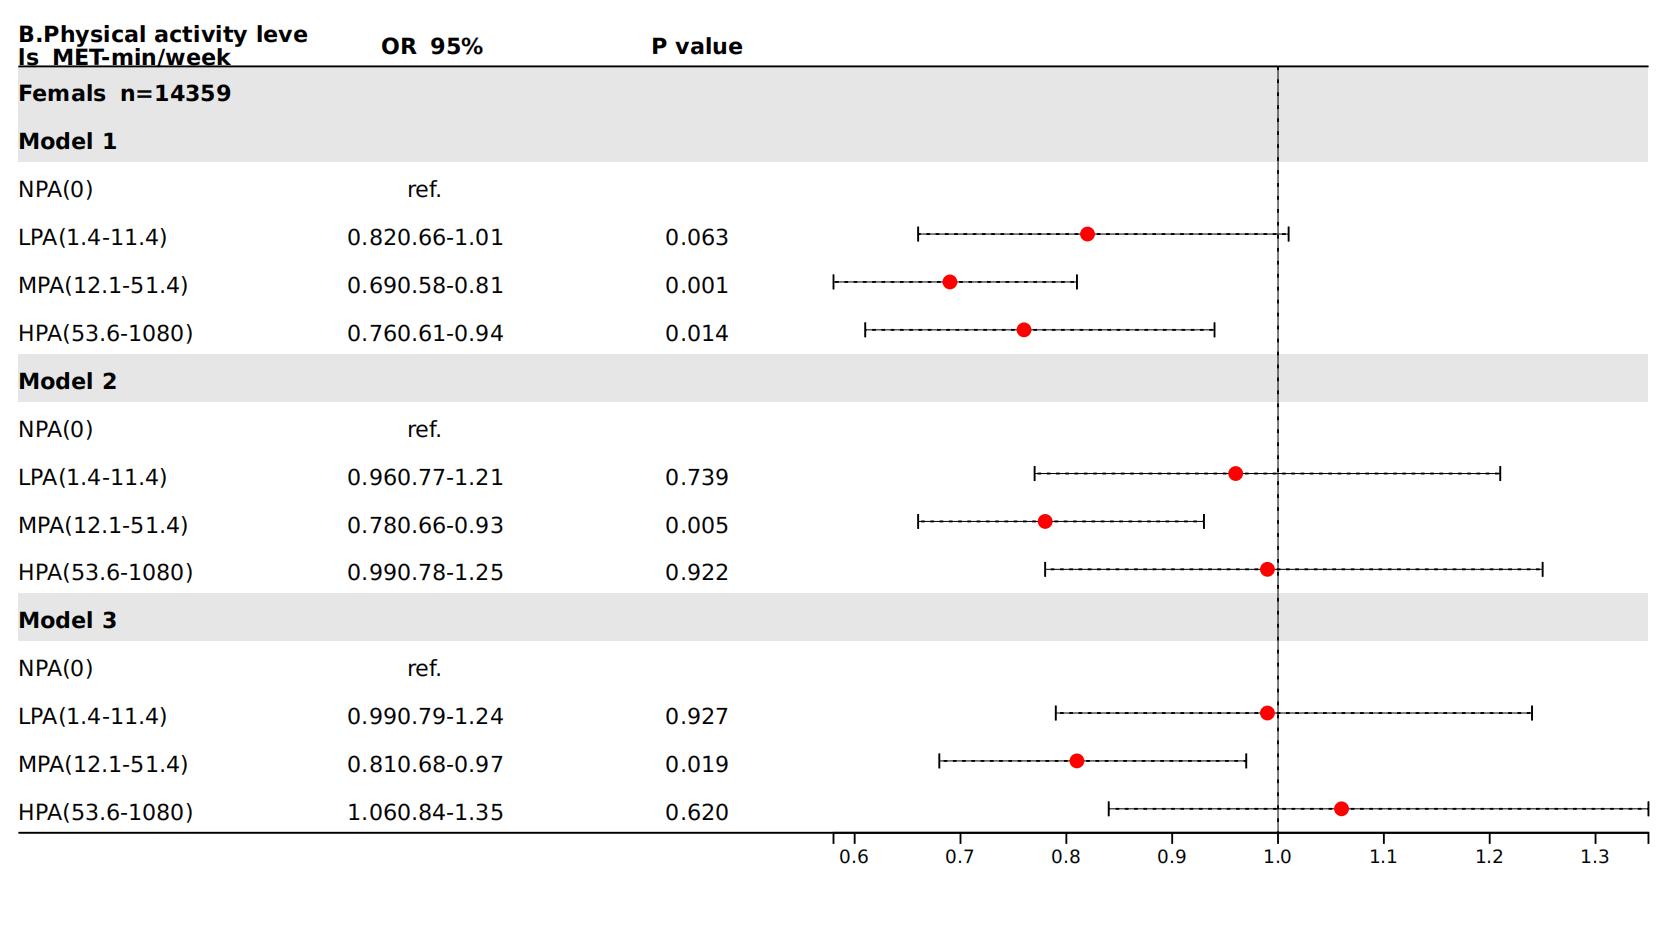
Figure 2 illustrates that in Model 1, as the physical activity level increases, the risk of arthritis gradually decreases. Compared to the population who doesn’t conduct physical activity, the risk of osteoarthritis decreased by 27% (OR: 0.73, 95% CI: 0.62-0.87), 33% (OR: 0.67, 95% CI: 0.59-0.78), and 36% (OR: 0.64, 95% CI: 0.53-0.79) for light, medium, and high physical activity level, respectively. In Model 3, among all levels of physical activity, individuals with medium physical activity level showed the strongest protective factor against arthritis (OR: 0.80, 95% CI: 0.69-0.92). The dose-response relationship between total physical activity level and the risk of osteoarthritis varied with age and gender. Regardless of the physical activity level, no significant correlation was found with the risk of osteoarthritis in younger individuals (20-44 years) (Additional file S1A). Medium physical activity, however, demonstrated preventive benefits against osteoarthritis in the age groups of 45-64 years and ≥65 years (OR: 0.73, 95% CI: 0.58-0.93; OR: 0.79, 95% CI: 0.65-0.97), reducing the risk of osteoarthritis (Additional files S1B and S1C). In gender-stratified analyses, light physical activity level was the strongest protective factor against osteoarthritis in males (OR: 0.69, 95% CI: 0.50-0.95), while medium physical activity level was the strongest protective factor in females (OR: 0.81, 95% CI: 0.68-0.97). The preventive effect of physical activity levels on osteoarthritis was slightly higher in males than in females (Additional files S2A and S2B).
As displayed in Figures 3A-C, across five different domains of physical activity, namely vigorous work activity, vigorous recreational activity, moderate work activity, moderate recreational activity,and walking or bicycling, the impact of three physical activity levels on the risk of osteoarthritis varies compared to non-physical activity. Individuals engaged in vigorous work activity with a high physical activity level (OR: 2.18, 95% CI: 1.11 to 4.28) experience an obviously increased risk of arthritis, whereas light physical activity level (OR: 0.54, 95% CI: 0.25-1.16) or medium physical activity level (OR: 0.93, 95% CI: 0.50 to 1.70) shows no significant relationship to arthritis risk (Figure 3A). In addition, for vigorous recreational activity, different physical activity levels have a strong protective effect against osteoarthritis. Notably, participating in vigorous recreational activities at a light physical activity level reduces the incidence of arthritis by 49% (OR: 0.51, 95% CI: 0.26-0.99) (Figure 3A). In the domain of moderate work activity, both light and high physical activity levels are positively related to osteoarthritis, raising the risk by 51% and 47%, respectively (OR: 1.51, 95% CI: 1.15-1.97; OR: 1.47, 95% CI: 1.00-2.17). In moderate recreational activity, a medium physical activity level lowers the risk of osteoarthritis by 20% (OR: 0.80, 95% CI: 0.66-0.97) (Figure 3B). Regarding walking or bicycling related to transportation, as physical activity level increases, the risk of developing osteoarthritis decreases. The higher physical activity levels are correlated with lower risks of osteoarthritis (Q1-OR: 0.71, 95% CI: 0.51-1.00; Q2-OR: 0.63, 95% CI: 0.47-0.83; Q3-OR: 0.56, 95% CI: 0.39-0.81, Figure 3C).