3.1. Synthesis and Characterization of chitosan coated micronutrient loaded nano-zeolite
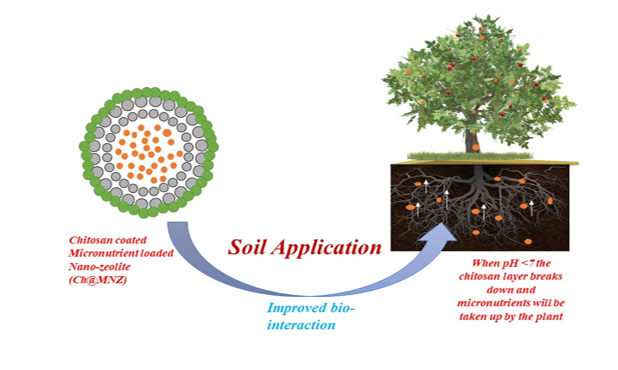
The nano-zeolite (NZ) was synthesized by simple co-precipitation method followed by impregnation of micronutrients in form of their metal salts (FeCl2.xH2O, MnCl2.4H2O, CuCl2.2H2O, ZnSO4.H2O) into the porous material to prepare the micronutrient loaded nano-zeolite (MNZ). The percentage loading taken place in nano-zeolite was calculated on the basis of amount of unloaded salt in a filtrate obtained after filtration of loaded nano-zeolite sample. The chitosan coating was made over the MNZ to make it a stimuli controlled release fertilizer. 20% v/v acetic acid/water solution was selected as a suitable medium for coating of MNZ under slow agitation conditions and to separate the coated material no vigorous conditions were used. The coated nano-composite had different consistency i.e. asticky grey particlesowing to the coating material over the loaded nano-zeolite. Excessive chitosan was washed with distilled water to bring down the pH to neutral level followed by single washing with diethyl ether to get dispersive particles. All the test particles were analysed and their formation was confirmed with FTIR, XRD and TEM analysis. The schematic representation of the preparation of Chitosan coated micronutrient loaded nano-zeolite (Ch@MNZ) is shown below in Fig. 1.
FTIR spectra of NZ, MNZ and Ch@MNZ are given in Fig. 2. The peaks arising at 1102.13 and 613.52 cm− 1 are assigned to bending and stretching of Al-O and Si-O in zeolite (NZ) structure(Lateef et al. 2016a). The peak shift in FTIR spectra of different micronutrient doped nanozeolite (MNZ) to 983.81 and 707.90 cm− 1 (Fe@NZ); 979.32 and 709.77 cm− 1 (Cu@NZ); 975.75 and 701.04 cm− 1 (Zn@NZ); 979.34 and 697.63 cm− 1 (Mn@NZ) refers to the incorporation of nutrients in the zeolite structure that confirms the formation of doped products. Further the chitosan coated composites (MNZ@Ch) shows N-H bending around 1412 and 1634 cm− 1; C-N bonding/N-H stretching at 3350 cm− 1 in Ch@MNZ along with peak shift corresponding to Al-O and Si-O to higher wavenumber this confirms the chitosan coating over the composites(Yan et al. 2018).
The X-ray diffraction (XRD) studies were conducted to check the structural characterization of the prepared nano-zeolite and their composites. Powder XRD pattern was obtained on the basis of Bragg’s equation (Ʌ =2dsinƟ) using CuKα radiations as shown in Fig. 3.Strong peaks at 2Ɵ = 19.081, 28.614, 31.758, 45.498 and 56.25, with no hkl plane shows the formation of low crystalline structure of nano-zeolite. The observed XRD spectrum is well-matched with the CCDC No- 01-074-1183 of sodium aluminium silicate. Further the comparison of the spectra of MNZ with NZ shows that the basic structure of the nano-zeolite is intact, there is just a decrease in the intensity of the major peaks along with one extra prominent peak at 2Ɵ = 24.5, that may corresponds to the doped metal ion (Fe). Further a weak shifted peak at 2Ɵ = 31.9 in Ch@MNZ confirms the amorphous nano-particles with completely masked micronutrient loaded nano-zeolite particles(Wan Ngah et al. 2012; Bindra et al. 2019).
TEM analysis of NZ, MNZ and Ch@MNZ showed nanoparticlesmostly in a size range of 20–30 nm. The mesoporousstructure of the particles is visible in the image (A)of the NZ particles whereas these pores are found to disappear after loading with the micronutrients (image B and image C) (Fig. 4). The TEM image of Ch@MNZ shows a thin 2–3 nm chitosan layer coating on Ch@MNZ (shown in the inset)(Ghadi et al. 2014). The particle size range of the obtained nanoparticles as analysed by J-image software was presented in a form of histogram below in image D of Fig. 5.
3.2. Water absorbance, Swelling ratio and equilibrium water content of the zeolite composites
The slow release fertilizers have strong importance of different parameters that guide their efficacy. It includes the water absorbance, swelling ratio and equilibrium water content features of the prepared composites(Lateef et al. 2016b). The results for different NZ, MNZ and Ch@MNZcorresponding to all these three parameters are recorded in Table 1. All these parameters showed a similar trend corresponding to all the three analysis factors. Because zeolite often has high porosity, it can hold more water than its actual weight. Depending on the potential interaction of the loaded salt with water, water can also enter the porous structure of MNZ. By supplying moisture to plants in arid places, NZ and MNZ's unique feature helps increase output(Ramesh et al. 2011). Additionally, the presence of water facilitates the crops' gradual absorption of nutrients(Wu et al. 2008).The comparative evaluation of all the MNZ indicated that the Fe has the highest tendency followed by Mnto hold the water in comparison to Cu and Zn, this behaviour can be related with the more tendency of Fe and Mn to complexate with water. Further the coating of the MNZ composite with chitosan (Ch@MNZ) showed a different behaviour. There is significant decrease in the WA, SR and EWC values owing directly to the formation of chitosan coating over the MNZ.
Table 1
Physical properties of slow release fertilizers
| Test material | WA (%) | SR | EWC (%) |
| NZ | 38 | 0.656 | 39.61 |
| Fe@NZ | 41.4 | 2.16 | 68.35 |
| Cu@NZ | 10.6 | 0.236 | 19.09 |
| Mn@NZ | 18.6 | 0.546 | 35.31 |
| Zn@NZ | 6 | 0.23 | 18.69 |
| Ch@Fe@NZ | 2.8 | 0.72 | 6.7 |
| Ch@Cu@NZ | 0.8 | 0.18 | 15.2 |
| Ch@Mn@NZ | 1 | 0.392 | 28.16 |
| Ch@Zn@NZ | 0.6 | 0.16 | 13.79 |
3.3. Slow release studies
In order to analyse the optimal release behaviour of the nutrients for crop production, the slow release studies were carried out separately in the soil and tap water at two distinct pH levels. The studies were carried out in triplicate in both instances, and the result is reported as an average of the proportion of nutrients released out of the total number of nutrients present in MNZ(Fig. 6). The resulting findings aid in learning more about the precise timing of a fertilizer's release of particular nutrients as well as the availability of those nutrients to plants on a daily basis. These investigations are a valid method according to literature, for determining whether the fertiliser is appropriate for a crop or not(Pereira et al. 2012; Costa et al. 2013). Studies on the release of micronutrients after 7 days in pre-analyzed tap water revealed a predictable pattern, including,.FeCl2.xH2O, MnCl2.4H2O, CuCl2.2H2O, ZnSO4.H2O.The release is found to be boosted in acidic medium incomparison to neutral medium supported by the earlier reported works as well(Bindra et al. 2019). Additionally, the pattern under acidic conditions exhibited a slight variation in the pattern, where the progressive reduction appeared for the first 5 days with a bigger splash on day 7. The pattern also indicated a steady decrease in % nutrient release on moving from 0 to 7th day. Also the nutrient release from the composite with porous structure is influenced by pore size and variations in nutrient chemical composition(Khan et al. 2007).
Additionally, the comparison of various nutrients showed that, particularly in acidic conditions, copper and zinc released micronutrients at a higher rate than did iron and manganese. The more the nutritional salt dissolves in an acidic media, the more this unusual pattern can be explained.Additionally, the metal and nano-zeolite composite (Ch@MNZ) coated with chitosan and tested at various pH levels demonstrated a similar behaviour of greater release in acidic medium, but overall results showed that the release from coated counterparts is significantly lower than that from uncoated MNZ composites. This property of higher release of nutrients in acidic pH is quite beneficial in case of chitosan coated MNZ as it helps in stimuli controlled release of nutrients from the gated polymer in the arena of plant root zone with an acidic pH that helps in initiating the release of nutrients from the engineered molecules. The cumulative release percentage of all the micronutrients under different conditions are presented below in Fig. 6for all the MNZ and Ch@MNZ. This pH dependent release behaviour of Ch@MNZ fertilizers indicated their good plant stimuli responsive release behaviour.
Additionally, the 14-day delayed release behaviour of the nutrients in soil showed the same pattern as that seen in tap water, with the exception that the concentration of metal released is fairly low, which is only attributable to less leaching of the nutrients from the soil. Additionally, the findings are in line with earlier research, and the pattern seen encourages continued nutrient supply to plants, reducing leaching losses that are frequently seen with conventional fertilisers(Costa et al. 2013). In addition to the normal soil condition it was well observed that the acidic conditions of the soil and in practical cases the acidic condition of the root zone will help in early release of nutrients from the source making the availability of high nutrient content in the root zone are supporting the early germination and sprouting of seeds, which promotes the growth of healthy plants. After the plant receives its initial dose of nutrients, Ch@MNZ continues to release nutrients, promoting early blooming and fruiting that results in high yield crops. Figure 7 below shows a graphical illustration of the release behaviour.
3.4. Effect of nano-fertilizers on growth of okra plant seeds
On applying the composite fertilizersto okra seedlings, it was observed that the germination percentage increased to much extent when compared to the control sample in all the replications. The numbers of seeds germinated in treated pots are higher in comparison to the control sample with higher number of leaves and higher stem length. Further the comparative evaluation of the different micronutrient fertilizer indicated the highest growth activity in iron supplemented pots followed by copper, manganese and zinc. In iron supplemented pot, the early plant development is visible with first seed emergence in just 3 days whereas in control sample the first emergence was visible after 7 days. This is attributed to the higher rate of metabolic reactions that improved the enzyme activity and increases rate of photosynthesis(Al-Kaby et al. 2021; Lekshmi et al. 2022).
The comparison of chitosan gated and non-gated nano-zeolite composite materials indicated that the initiation of growth is much higher in non-gated molecules attributing to slower release of nutrients from chitosan coated nano-fertilizers but the overall results indicated the comparative growth rate in both the counterparts for long term is more visible in chitosan gates micronutrient carrier. The emergence of leaves and fruits were visible earlier in the chitosan gated nano-composites owing to their long term effect and availability of the nutrients in the plant system. And the field trials can further more clearly indicate the lower leaching effect leading to elongated effect of gated fertilizers. The other important observation was that the leaf vein disease visible in control sample was not observable in the treated pots showing the healthy growth of the plants in presence of micronutrients. Figure 8 below shows the comparative results of iron and copper treated okra plants after 7 days of treatment.