Investigation of catalytic CL performance of Fe3O4 NPs@Cu-TATB
According to the literature [39, 40], metal ions such as Co2+ and horseradish peroxidase (HRP) could serve as excellent catalysts for the luminol-H2O2 CL system. In this study, Fe3O4 NPs@Cu-TATB composite material was used as the catalyst for the luminol-H2O2 CL system. We evaluated the catalytic effects (Fig. 1A) of these substances under the same conditions and found that the catalytic effect of Fe3O4 NPs@Cu-TATB (4×10− 2 mg/mL) was approximately 7 times higher than that of HRP (4×10− 2 mg/mL), and its catalytic effect was close to the signal strength of Co2+ (4×10− 2 mg/mL). To investigate whether the catalytic ability of Fe3O4 NPs@Cu-TATB was stronger than that of Cu-TATB, Fe3O4 NPs, and Fe NPs@Cu-TATB individually, their catalytic effects were verified under the same conditions. Specifically, the catalytic ability of Fe3O4 NPs@Cu-TATB was found to be 6.5 times higher than that of Cu-TATB, 3.4 times that of Fe3O4 NPs, and 10.4 times that of Fe NPs@Cu-TATB, as shown in Fig. 1B. Also, the CL signal was recorded with the composite in different conditions. In Fig. 1C and Fig. 1D, CL intensity of Fe3O4 NPs@Cu-TATB was shown on paper and in solution under the same conditions. We found that the CL intensity in the solution was much higher than the CL intensity on paper [41]. Fe3O4 NPs@Cu-TATB may accumulate on the paper and greatly decrease the catalytic function for luminol-H2O2 CL system. This also suggests that the Fe3O4 NPs@Cu-TATB-luminol-H2O2 CL system performed better in solution.
Characterization of Fe3O4 NPs@Cu-TATB
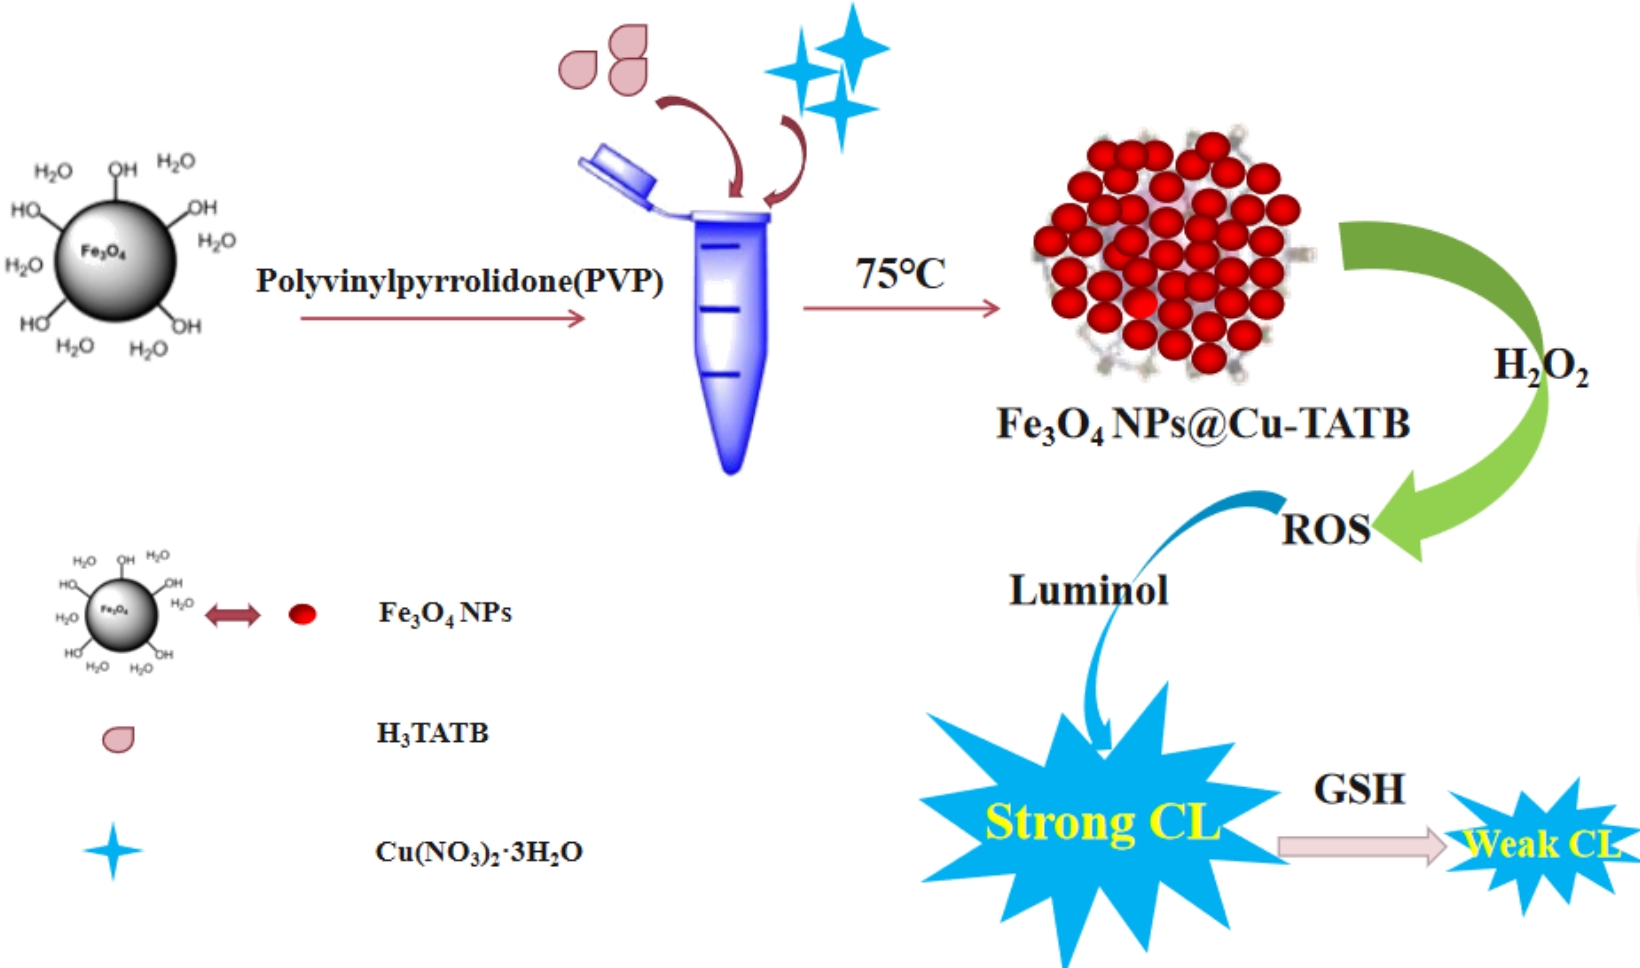
In this work, Fe3O4 NPs@Cu-TATB composite was synthesized. Then, the composite was charactered by the next methods. Firstly, the morphology of Fe3O4 NPs@Cu-TATB was observed using scanning electron microscopy (SEM). From Fig. 2A and Fig. 2B, it could be seen that Cu-TATB appears as regular octahedrons with micropores on the surface. From Fig. 2C we could see that a large number of Fe3O4 NPs could be observed in the composite material, indicating that Cu-TATB was heavily enveloped by Fe3O4 NPs. To confirm the successful synthesis of Fe3O4 NPs@Cu-TATB, the crystalline structure and functional groups of the samples were analyzed using X-ray diffraction data (XRD) and fourier transform infrared (FTIR) spectroscopy, respectively. As shown in Fig. 2D, the characteristic diffraction peaks of Fe3O4 NPs were observed at 2θ = 30.1°, 35.5°, and 43.1° [42], and those of Cu-TATB are observed at 2θ = 5.5°, 6.7°, 7.7°, 10.8°, 12.7°, 16.4°, and 19.5° [43]. The characteristic diffraction peaks of Fe3O4 NPs@Cu-TATB coincided well with those of individual Fe3O4 NPs and Cu-TATB, confirming that Fe3O4 NPs@Cu-TATB was successfully prepared. Subsequently, the functional groups of Fe3O4 NPs@Cu-TATB were investigated using FTIR spectroscopy (Fig. 2E). For Fe3O4 NPs@Cu-TATB, the absorption peak at 624 cm− 1 represented the stretching vibration peak of Fe-O [44]. What's more, peaks observed at 1246 cm− 1, 1354 cm− 1, and 1708 cm− 1 represented the stretching vibration peaks of C-O, C-N, and C = O groups, respectively. This confirmed the presence of H3TATB. Additionally, the peak at 748 cm− 1 proved the stretching vibration peak of Cu-O [45], indicating the coordination between Cu2+ and the ligand of H3TATB. The main FTIR absorption peaks of Fe3O4 NPs@Cu-TATB coincided with those of Fe3O4 NPs and Cu-TATB. This furtherly indicated the successful preparation of Fe3O4 NPs@Cu-TATB. Furthermore, the stability of Fe3O4 NPs@Cu-TATB was investigated. From the CL results in Fig. S1A, Fe3O4 NPs@Cu-TATB could maintain its catalytic performance steadily over 14 days. Utilizing the same batch of Fe3O4 NPs@Cu-TATB, CL signals remained stable after repeated the measurements for 30 times just in a single day (Fig. S1B). (the details of stability and reproducibility were provided in Supplementary Information, Section 5).
The catalytic mechanism of Fe3O4 NPs@Cu-TATB in the Luminol-H2O2 system
As Fe3O4 NPs@Cu-TATB could greatly enhance the CL intensity of luminol-H2O2 system, the luminescence mechanism should be investigated. To confirm the emitting species in the Fe3O4 NPs@Cu-TATB-Luminol-H2O2 CL system, CL spectra (Fig. S2A) were utilized for validation. It could be observed that with the involvement of Fe3O4 NPs@Cu-TATB, the maximum emission peak of the CL spectrum in this system was located around 425 nm. The position of the maximum emission peak in the CL spectrum was the same to Luminol-H2O2 CL system. This indicates that the emitting species in this system was the excited-state 3-aminophthalate anion (3-APA*). Furthermore, UV-visible spectrophotometry was investigated by Fe3O4 NPs@Cu-TATB. As shown in Fig. S2B, the position of the maximum absorption peak remained unchanged before and after the addition of Fe3O4 NPs@Cu-TATB in the Luminol-H2O2 CL system. This results showed that there was no new subtance's formation in this system. This confirms that Fe3O4 NPs@Cu-TATB was the catalyst in this system. The utilization of free radical scavengers (Fig. S2C-F) and electron spin resonance (ESR) (Fig. S2G-I) confirmed the presence of OH·, O2.− and 1O2 in the system. The three free radicals' confirmation could be found in the Supporting Information, Section 6.
Based on the experimental exploration of the mechanism described above, we could speculate the mechanism of Fe3O4 NPs@Cu-TATB in luminol-H2O2 CL system. Firstly, H2O2 decomposed under alkaline conditions to produce HO2−. Also, luminol can form the luminol anion (L−) in the system. Then, in the presence of Fe and Cu dual active sites of Fe3O4 NPs@Cu-TATB, the generated OH· from the decomposition of H2O2 reacted with L− and HO2− to produce luminol radicals (L.−) and O2.−. The generated O2.− can be transfered to 1O2. Finally, due to the synergistic effect of the Fe and Cu dual active sites in Fe3O4 NPs@Cu-TATB, L.− was oxidized by a large amount of O2.− to the excited-state 3-aminophthalate anion (3-APA*). When it returns to the ground state, it emits intense blue CL. The specific principle is illustrated in Fig. 3.
The sulfhydryl group in GSH reacts with Cu2+ to generate CuS, resulting in a decrease in the CL intensity of the system. The extent of the decrease in CL signal could be used to determine the concentration of GSH. This was the principle for Fe3O4 NPs@Cu-TATB-Luminol-H2O2 system to detect GSH (the details of principle was provided in Supplementary Information, Section 7 (Fig. S3)). In addition, optimization of the detection conditions for GSH revealed that the strongest CL signal was achieved with 0.5 g of Fe3O4 NPs, 1.0 mM of luminol, 6.5 mM of of H2O2 and the best pH value of 12.5 (the details for the optimization of the detection conditions were provided in Supplementary Information, Section 8 (Fig. S4)).
The sensitivity of GSH detection
Under the optimized experimental conditions, GSH was visually detected using the Fe3O4 NPs@Cu-TATB-Luminol-H2O2 system. Figure 4 shown the variation in CL intensity of the solution system at different concentrations (0-200 µM) of GSH. In a dark background, CL photos were captured at different GSH concentrations using a mobile phone. It could be observed that the CL intensity of the solution system gradually decreased with the increased GSH concentration. With luminol of 1.0 mM, H2O2 of 1.0 M, Fe3O4 NPs@Cu-TATB of 3.0 mg/mL, the blue luminescence dimed with the addition of 50 µL GSH in 2 minutes. During the visual detection, changes in luminescence intensity from 0 to 200 µM GSH concentrations could be clearly observed by the naked eye. To quantitatively express the visual results, photos were taken with a mobile phone. Then, Photoshop software was used to convert brightness into grayscale images. The CL intensity at each concentration of GSH was quantitatively expressed using grayscale values. As shown in Fig. 5A, a standard curve was plotted for GSH concentrations ranging from 0 to 10 µM. The grayscale values showed a negative correlation with GSH concentration. The linear regression equation was determined as G = -3.98C + 62.07 (R2 = 0.9776), where G represents the grayscale value and C represents the concentration of GSH. In Fig. 5B, a standard curve was plotted for GSH concentrations ranging from 20 to 200 µM. The linear regression equation was calculated as G = -0.05C + 17.57 (R2 = 0.9999), where G represents the grayscale value at the respective GSH concentration and C represents the concentration of GSH. According to the 3σ rule, the detection limit of GSH with the visual method was determined to be 0.7 µM, indicating good sensitivity for GSH detection.
The Fe3O4 NPs@Cu-TATB-Luminol-H2O2 system was employed for CL detection of GSH. As shown in Fig. 6A, the CL curves of the Fe3O4 NPs@Cu-TATB-Luminol-H2O2 system at different GSH concentrations indicate a decreasing trend in CL intensity with the increasing GSH concentration. In Fig. 6B, when the GSH concentration ranged from 1 to 20 µM, the relative CL intensity was proportional to the GSH concentration, with a linear regression equation of IR = 41.004C + 160.933 (R2 = 0.9993), where IR represents the relative CL intensity and C represents the concentration of GSH. In Fig. 6C, when the GSH concentration ranged from 20 to 200 µM, the relative CL intensity was also proportional to the GSH concentration, with a linear regression equation of IR = 4.152C + 895.988 (R2 = 0.9970), where IR represents the relative CL intensity at the respective GSH concentration and C represents the concentration of GSH. According to the 3σ rule, the detection limit of GSH was determined to be 0.3 µM, indicating good sensitivity for detecting GSH using CL.
The interference determination during detection of GSH
In order to assess the selectivity of this method for detecting GSH, we investigated the effects of coexisting ions (K+, Na+, Ca2+, Fe3+), glucose, amino acids (glycine (Gly), serine (Ser), histidine (His), cysteine (Cys)), and vitamin C (Vc) in human blood [46, 47]. Typically, human blood contains approximately 4 mM K+, 140 mM Na+, 2 mM Ca2+, and 10 µM Fe3+, as well as 200 µM Gly, 128 µM Ser, 32–107 µM His, 5 µM Cys, and 5.7 µM Vc. As shown in Fig. 7, when 100 µM GSH was mixed with interfering substances at 10-fold or 0.1-fold concentrations, using the Fe3O4 NPs@Cu-TATB-Luminol-H2O2 system for CL detection, it was found that the CL signal was not significantly affected. Although Cys and Vc could cause a decrease in the CL intensity of the system, their concentrations in human blood (µmol/L) were much lower than the concentration of GSH (mmol/L) [47, 48]. In summary, these interfering substances do not interfere with the detection of GSH, indicating that the Fe3O4 NPs@Cu-TATB-Luminol-H2O2 system had good selectivity for detecting GSH in human blood.
The detection of GSH in actual blood samples
To evaluate the feasibility of detecting GSH in human blood using the Fe3O4 NPs@Cu-TATB-Luminol-H2O2 system, blood samples were collected from three healthy volunteers at Shaanxi Normal University. After pretreatment, gradient concentrations of reduced GSH were added to the blood samples. The spiked blood samples were then detected, and the results were compared with those obtained using standard electrochemiluminescence (ECL). It was found that there were no significant differences between the two methods. The analysis results, as shown in Table 1, indicated that the GSH content in the blood of the three volunteers was approximately 1.1 mM. Using the standard addition method to determine the recovery rate, it was observed that the recovery rate was ranging from 90–110% (n = 3). These results demonstrated the feasibility of this detection method for measuring GSH in human blood.
Table 1
Detection of GSH in Human Serum Samples by CL Method (n = 3)
| Sample | Found in sample(mM) | Add(mM) | Total found(mM) | Recovery(%) |
| ECL | CL |
| | | 1.0 | 2.0 ± 0.1 | 95.2 |
| 1 | 1.1 ± 0.2 | 1.1 ± 0.1 | 3.0 | 4.1 ± 0.3 | 100.0 |
| | | 5.0 | 5.9 ± 0.1 | 96.7 |
| | | 1.0 | 2.1 ± 0.1 | 105.0 |
| 2 | 1.1 ± 0.1 | 1.0 ± 0.1 | 3.0 | 3.9 ± 0.1 | 97.5 |
| | | 5.0 | 6.2 ± 0.2 | 103.3 |
| | | 1.0 | 2.1 ± 0.3 | 105.0 |
| 3 | 1.1 ± 0.2 | 1.0 ± 0.3 | 3.0 | 4.1 ± 0.2 | 102.5 |
| | | 5.0 | 6.1 ± 0.2 | 101.7 |