Clinical characteristics of HCC patients
Patient data, treatment parameters and clinical characteristics of both the TCGA and GEO cohorts are summarized in Table1 and supplementary Table1. In the TCGA cohort, patient’s age, pathologic stage and pathologic stage T were negatively associated with OS (P<0.05 for all cases, student t test or fisher exact test, Table1). In the GEO cohort, patient’s tumor size, multinodular, cirrhosis, tumor stage and AFP level were found to be adversely correlated with OS (P<0.05 for all cases, student t test or fisher exact test, Table1). The other characteristics did not show a significant association with OS in the TCGA and GEO datasets (P values >0.05 for all cases, student t test or fisher exact test, Table1 and supplementary Table1).
Overall survival analysis
To evaluate the predictive capability of gene expression for patients’ OS, the 373 HCC patients in the TCGA dataset were divided into low and high expression groups according to median values. Kaplan-Meier survival analysis showed that high expression levels of 1253 genes and 2082 genes were associated with favourable or poor prognosis respectively, such as solute carrier family 25 member 15(SLC25A15), RAB8A, member RAS oncogene family (RAB8A), glutamic-oxaloacetic transaminase 2(GOT2), sorbin and SH3 domain containing 2 (SORBS2), four and a half LIM domains 3(FHL3), adenosylmethionine decarboxylase 1(AMD1), DDB1 and CUL4 associated factor 13(DCAF13) and ubiquitin conjugating enzyme E2 E1 (UBE2E1) (P <0.05 for all cases, log rank test, Figure1, supplementary Figure1). Then multivariate analyses were performed between patients’ OS and the mortality-associated features, including patients’ age, pathologic stage and pathologic stage T and 3335 gene expression levels. Multivariate survival analyses confirmed that high expression of 823 genes was significantly associated with decreased mortality, such as SLC25A15, RAB8A, GOT2, SORBS2. The hazard ratios of the four genes ranged from 0.44 to 0.51, with a mean of 0.48 (P<0.05 for all cases, supplementary Table2). While high expression of 1442 genes was associated with increased mortality, such as FHL3, AMD1, DCAF13, UBE2E1. The hazard ratio ranged from 1.99 to 2.39 for the four genes, with a mean of 2.18 (P<0.05 for all cases, supplementary Table2, supplementary Figure1).
Validation of survival analyses
In order to validate the findings above, the association between 2265 gene expression and mortality was evaluated in 242 HCC samples of the GEO dataset. Of 2265 prognosis-associated genes, Kaplan-Meier survival analysis confirmed that high expression levels of 231 genes was associated with a favourable prognosis in HCC. In contrast, high expression of 244 genes was associated with a poor prognosis (P <0.05 for all cases, log rank test, supplementary Figure1). Then multivariate analyses were performed between patients’ OS and the mortality-associated features, including tumor size, multinodular, cirrhosis, tumor stage and AFP level and 475 gene expression levels. Multivariate survival analyses confirmed that high expression of 98 genes was associated with decreased mortality, while high expression of 85 genes was associated with increased mortality. The top protective genes SLC25A15, RAB8A, GOT2, SORBS2, interleukin 18 receptor accessory protein (IL18RAP) and risk genes FHL3, AMD1, DCAF13, UBE2E1, phosphatidylserine synthase 2(PTDSS2) were confirmed to be significantly associated with OS in the validation dataset (P< 0.05 for all cases, supplementary Figure1, supplementary Table3).
Bioinformatics analysis of prognosis-associated genes.
The GO function analysis indicated that the 98 risk genes were mainly enriched in 48 GO terms, such as the regulation of DNA replication, cell cycle, DNA repair, DNA recombination and cell division (Supplementary Table4, adjusted P values <0.05 for all cases). The 85 protective genes were significantly enriched in 26 GO terms, such as organic acid metabolic process, small molecule metabolic process, steroid metabolic process, protein localization to peroxisome and aspartate family amino acid metabolic process. The KEGG pathway analysis suggested that 98 risk genes were significantly enriched in the DNA replication and cell cycle signalling pathways, the 89 protective genes were significantly enriched in cholesterol metabolism, bile secretion, PPAR signalling pathway and metabolic pathway (Supplementary Table5, adjusted P values <0.05 for all cases).
Assessment of diagnostic value
Of the 183 prognosis-associated genes, 88 up-regulated genes and 66 down-regulated genes have been found between 50 pairs of HCC tissues and normal controls, while 93 genes were down-regulated and 81 were up-regulated in 247 HCC samples as compared to 241 normal controls (adjusted P values < 0.05 for all cases, supplementary Figure2A and B). By intersecting the DEGs between the GEO and TCGA cohorts, we found 83 common down-regulated and 64 up-regulated genes in HCC (P< 0.05 for all cases, supplementary Figure2C and 2D). ROC curves were constructed to further explore the diagnostic values of the 183 genes. 24 genes in particular exhibited high accuracy in differentiating HCC tissues from bone marrow tissues, such as DNA topoisomerase II alpha (TOP2A), thyroid hormone receptor interactor 13(TRIP13), cytochrome P450 family 2 subfamily C member 8(CYP2C8), Rac GTPase activating protein 1(RACGAP1) and cyclin dependent kinase 1(CDK1) (P values <0.05, AUC>0.9 for all cases, Supplementary Table6). Of the top five protective genes and top five risk genes, SLC25A15, GOT2, IL18RAP were significantly down-regulated and DCAF13, PTDSS2 and SORBS2 were significantly up-regulated in the HCC samples as compared to normal liver tissues in the two cohorts (P<0.05 for all cases, AUC> 0.8 for 50% cases, Figure2).
Unsupervised hierarchical clustering analysis
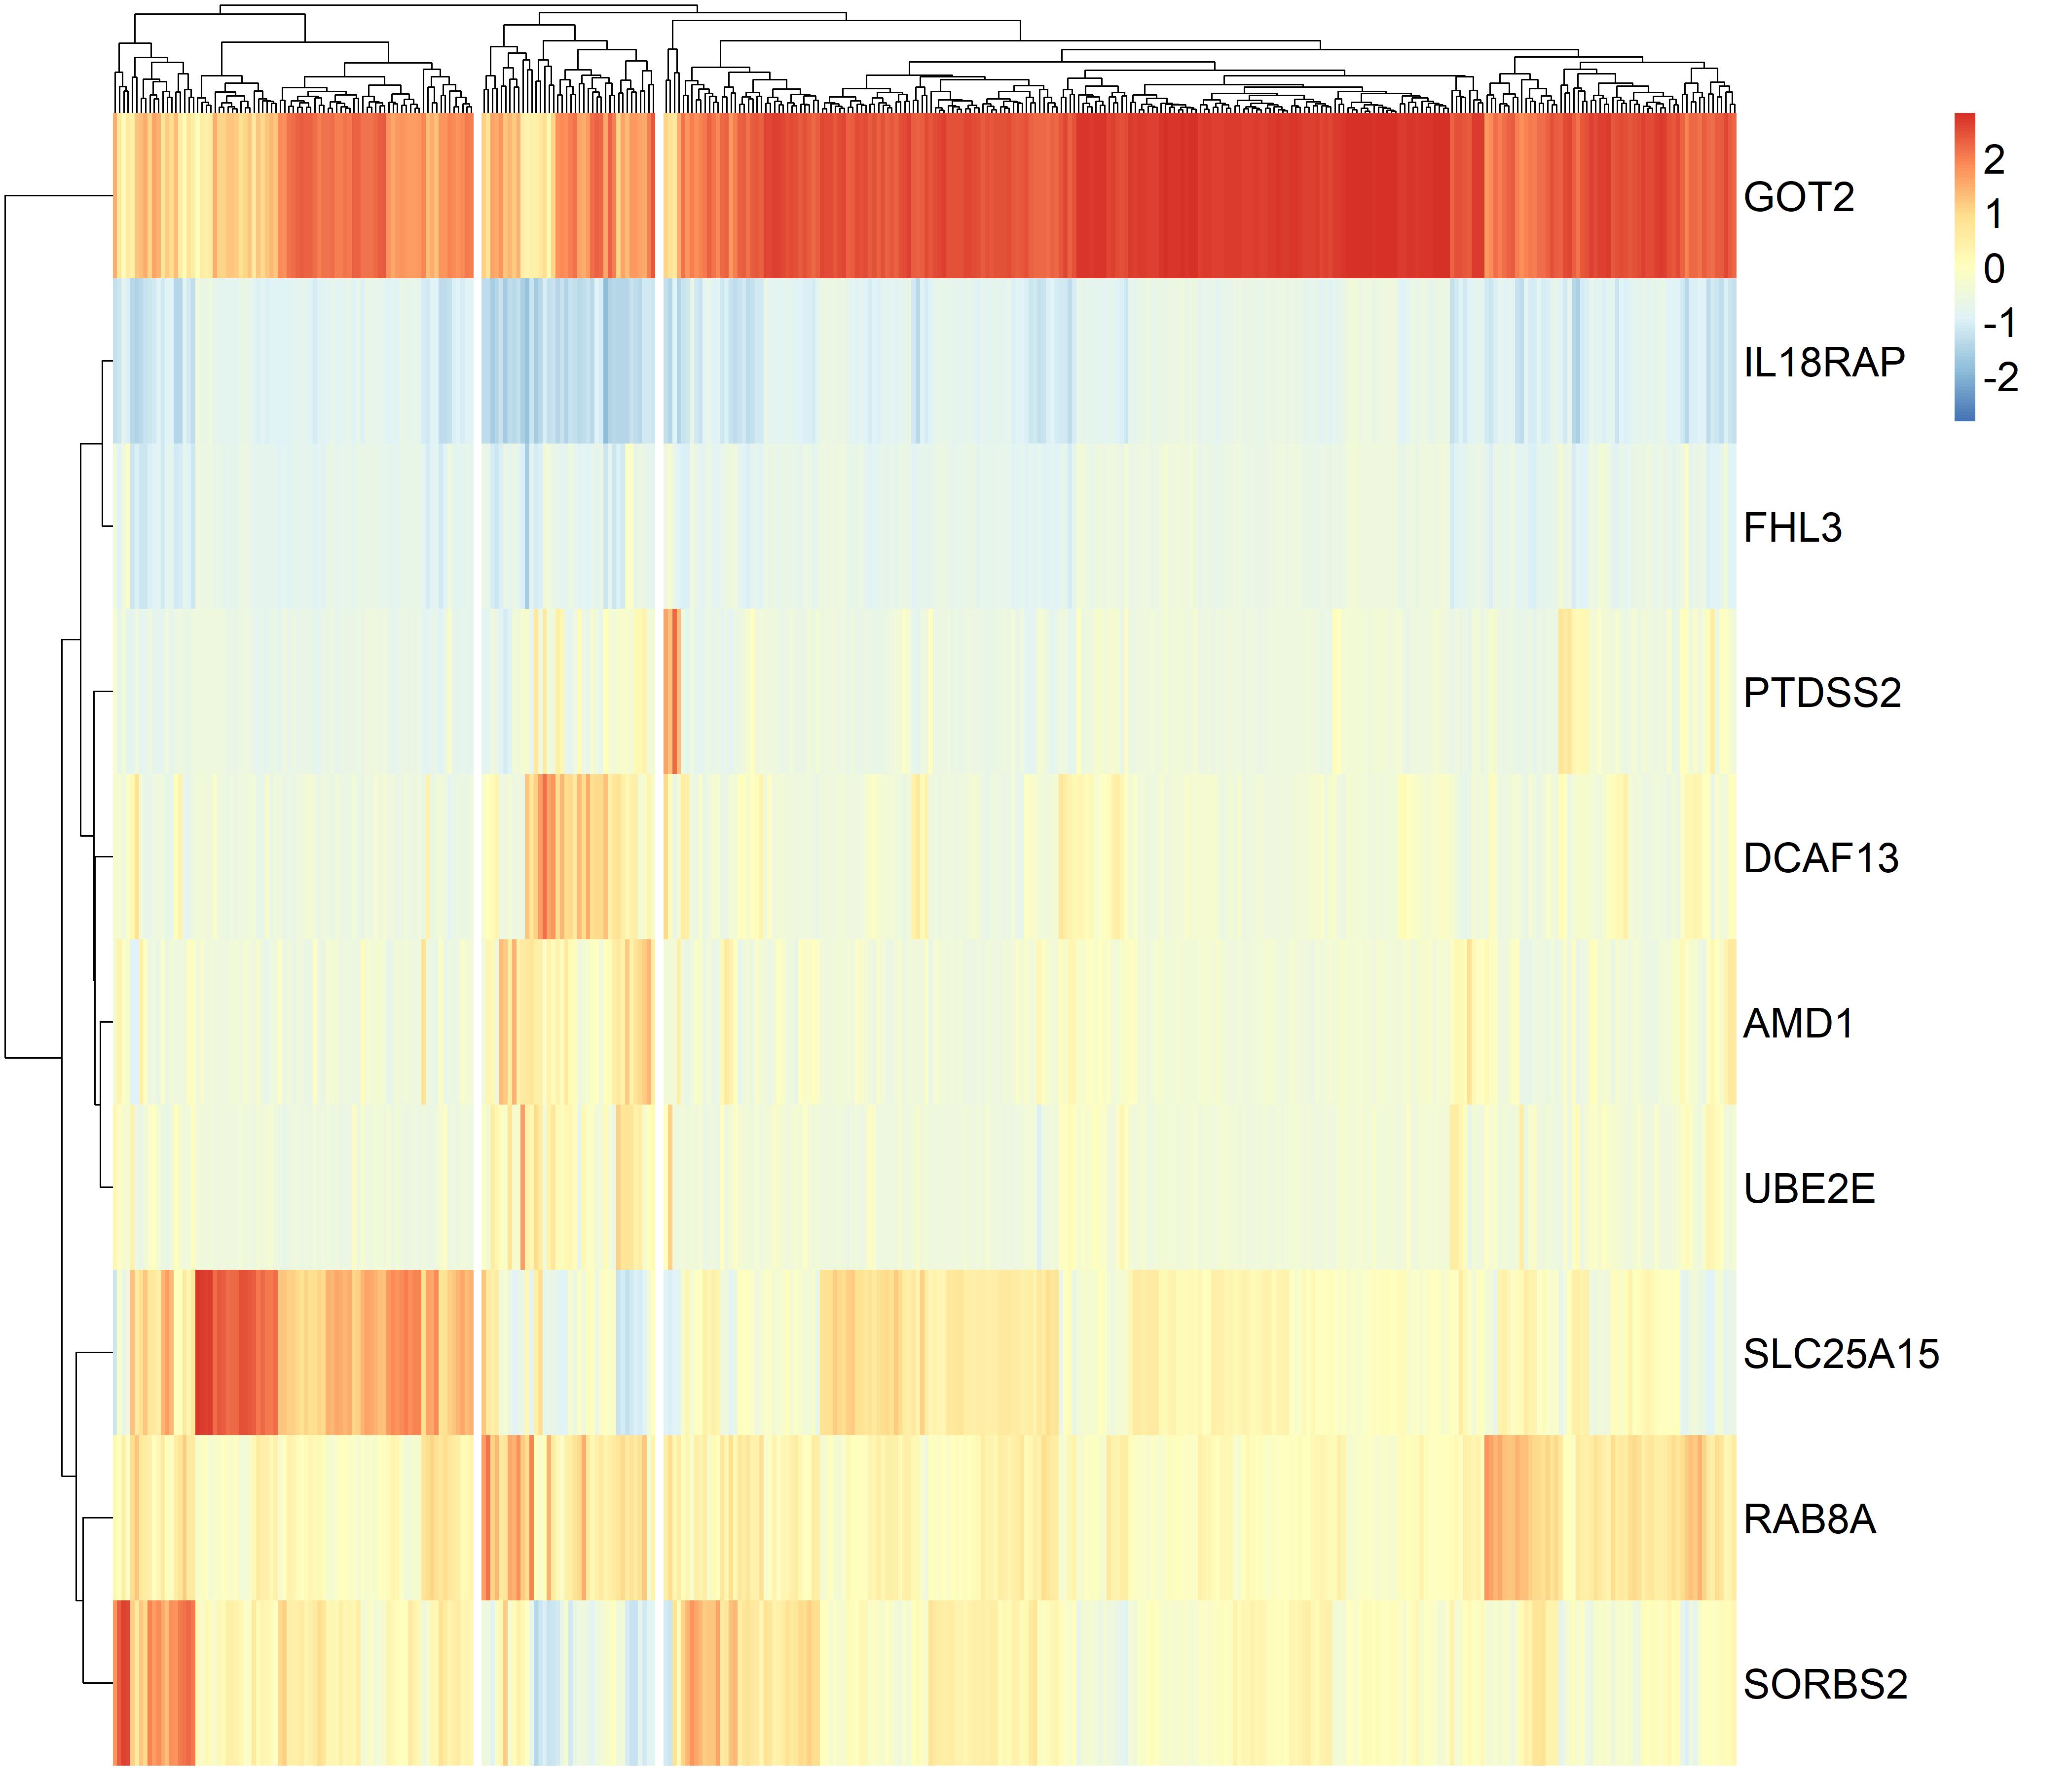
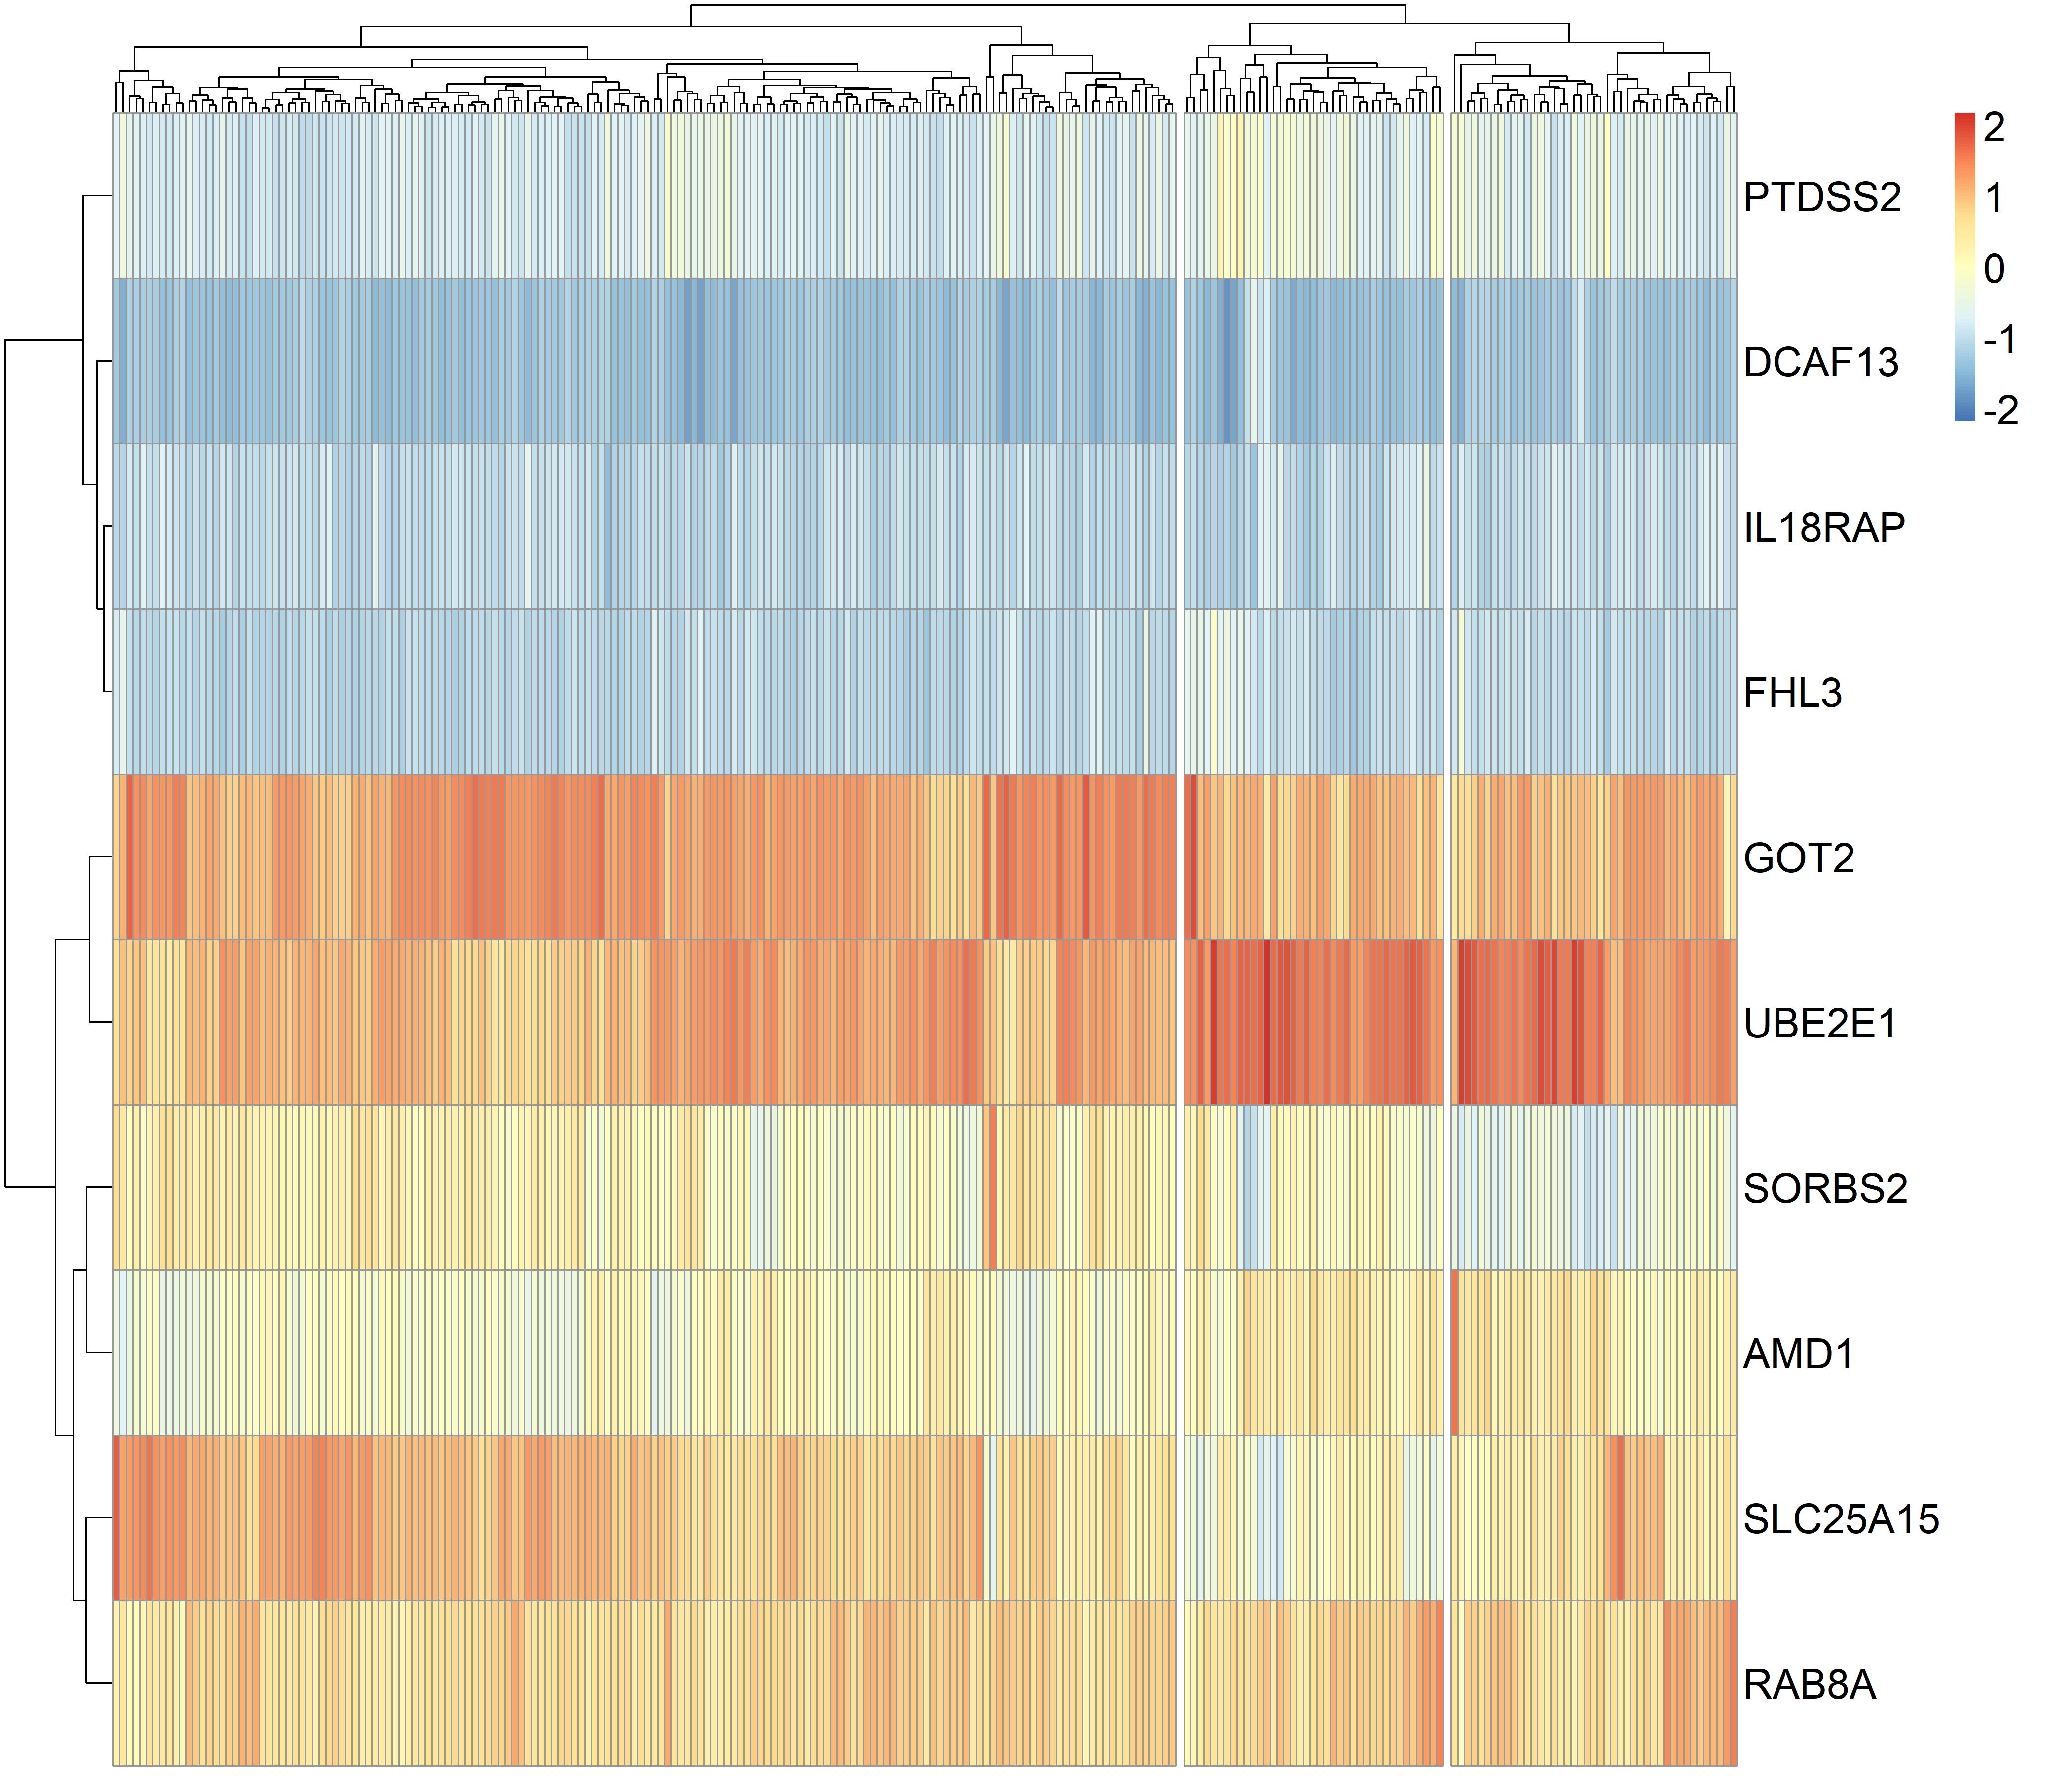
We performed the classification of 373 HCC patients using the gene panel comprising top five protective genes, SLC25A15, RAB8A, GOT2, SORBS2, IL18RAP and top five risk genes, FHL3, AMD1, DCAF13, UBE2E1, PTDSS2 and found three clusters of HCC patients in the TCGA dataset (supplementary Figure3). Cluster1 and 2 tumors were significantly associated with more favourable OS than cluster3 tumors, cluster2 tumors showed higher pathologic stage than cluster3 tumors (P values <0.05 for all cases, fisher exact test or log-rank test, Supplementary table7 and supplementary Figure4). Hierarchical clustering analysis of the gene panel revealed three subgroups of HCC patients in the GEO dataset (supplementary Figure5). The cluster1 HCC patients were associated with smaller tumor size, lower cancer stage, lower AFP levels and more favourable OS than cluster2 or 3 tumors (P values <0.05 for all cases, fisher exact test or log-rank test, Supplementary table8, Figure3).
Risk score is a negative predictor for overall survival in HCC
We constructed a risk score formula by linear combination of expression values of top five protective and risk genes using the coefficients of the multivariate Cox regression models from the TCGA dataset. Risk score =0.44×expression of SLC25A15 + 0.47×expression of RAB8A +0.51×expression of GOT2 + 0.51×expression of SORBS2 + 0.51×expression of IL18RAP+2.39×expression of FHL3 + 2.23×expression of AMD1 +2.11×expression of DCAF13 + 1.99×expression of UBE2E1 + 1.97×expression of PTDSS2. Dead HCC patients showed significantly higher risk scores than decreased ones in both cohorts (P<0.05 for all cases, student t test, Figure4A). Kaplan-Meier survival analysis suggested that HCC patients with high risk scores showed poorer survival than those with low risk scores in the TCGA dataset (P< 0.05 for all cases, Figure4B). The multivariate analysis further confirmed that risk score was a risk factor for predicting overall survival independently of prognosis-related clinical features in HCC. Using the same methods, the negative association between risk score and overall survival was also validated in the GEO dataset (P< 0.05 for all cases, Table2 and Figure4C).